Covid-19 International Dashboard April 21
by Horace Dediu
The Covid-19 case rate for 55 selected countries and the EU including Apple Mobility Trends for driving. All data is 7-day average.
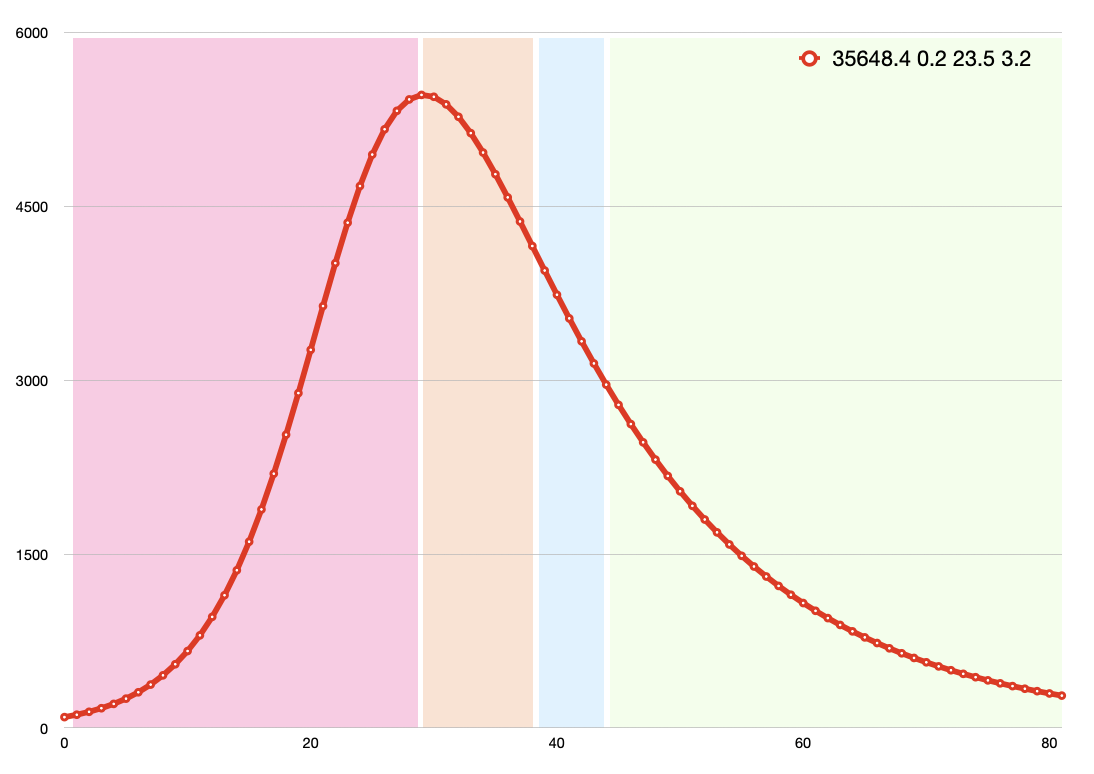
Red line is case rate in cases/day starting at 30 cases/day.
Black line is Stringency Index which is inverse of Apple Mobility Trends (lower bound means no change in mobility, upper bound is zero mobility).
Color coding:
- Green: Late Stage (>50% post-peak)
- Blue: Middle-Late Stage (~50% post-peak)
- Orange: Middle-Early Stage (peaked)
- Pink: Early Stage [or indeterminate] (pre-peak)
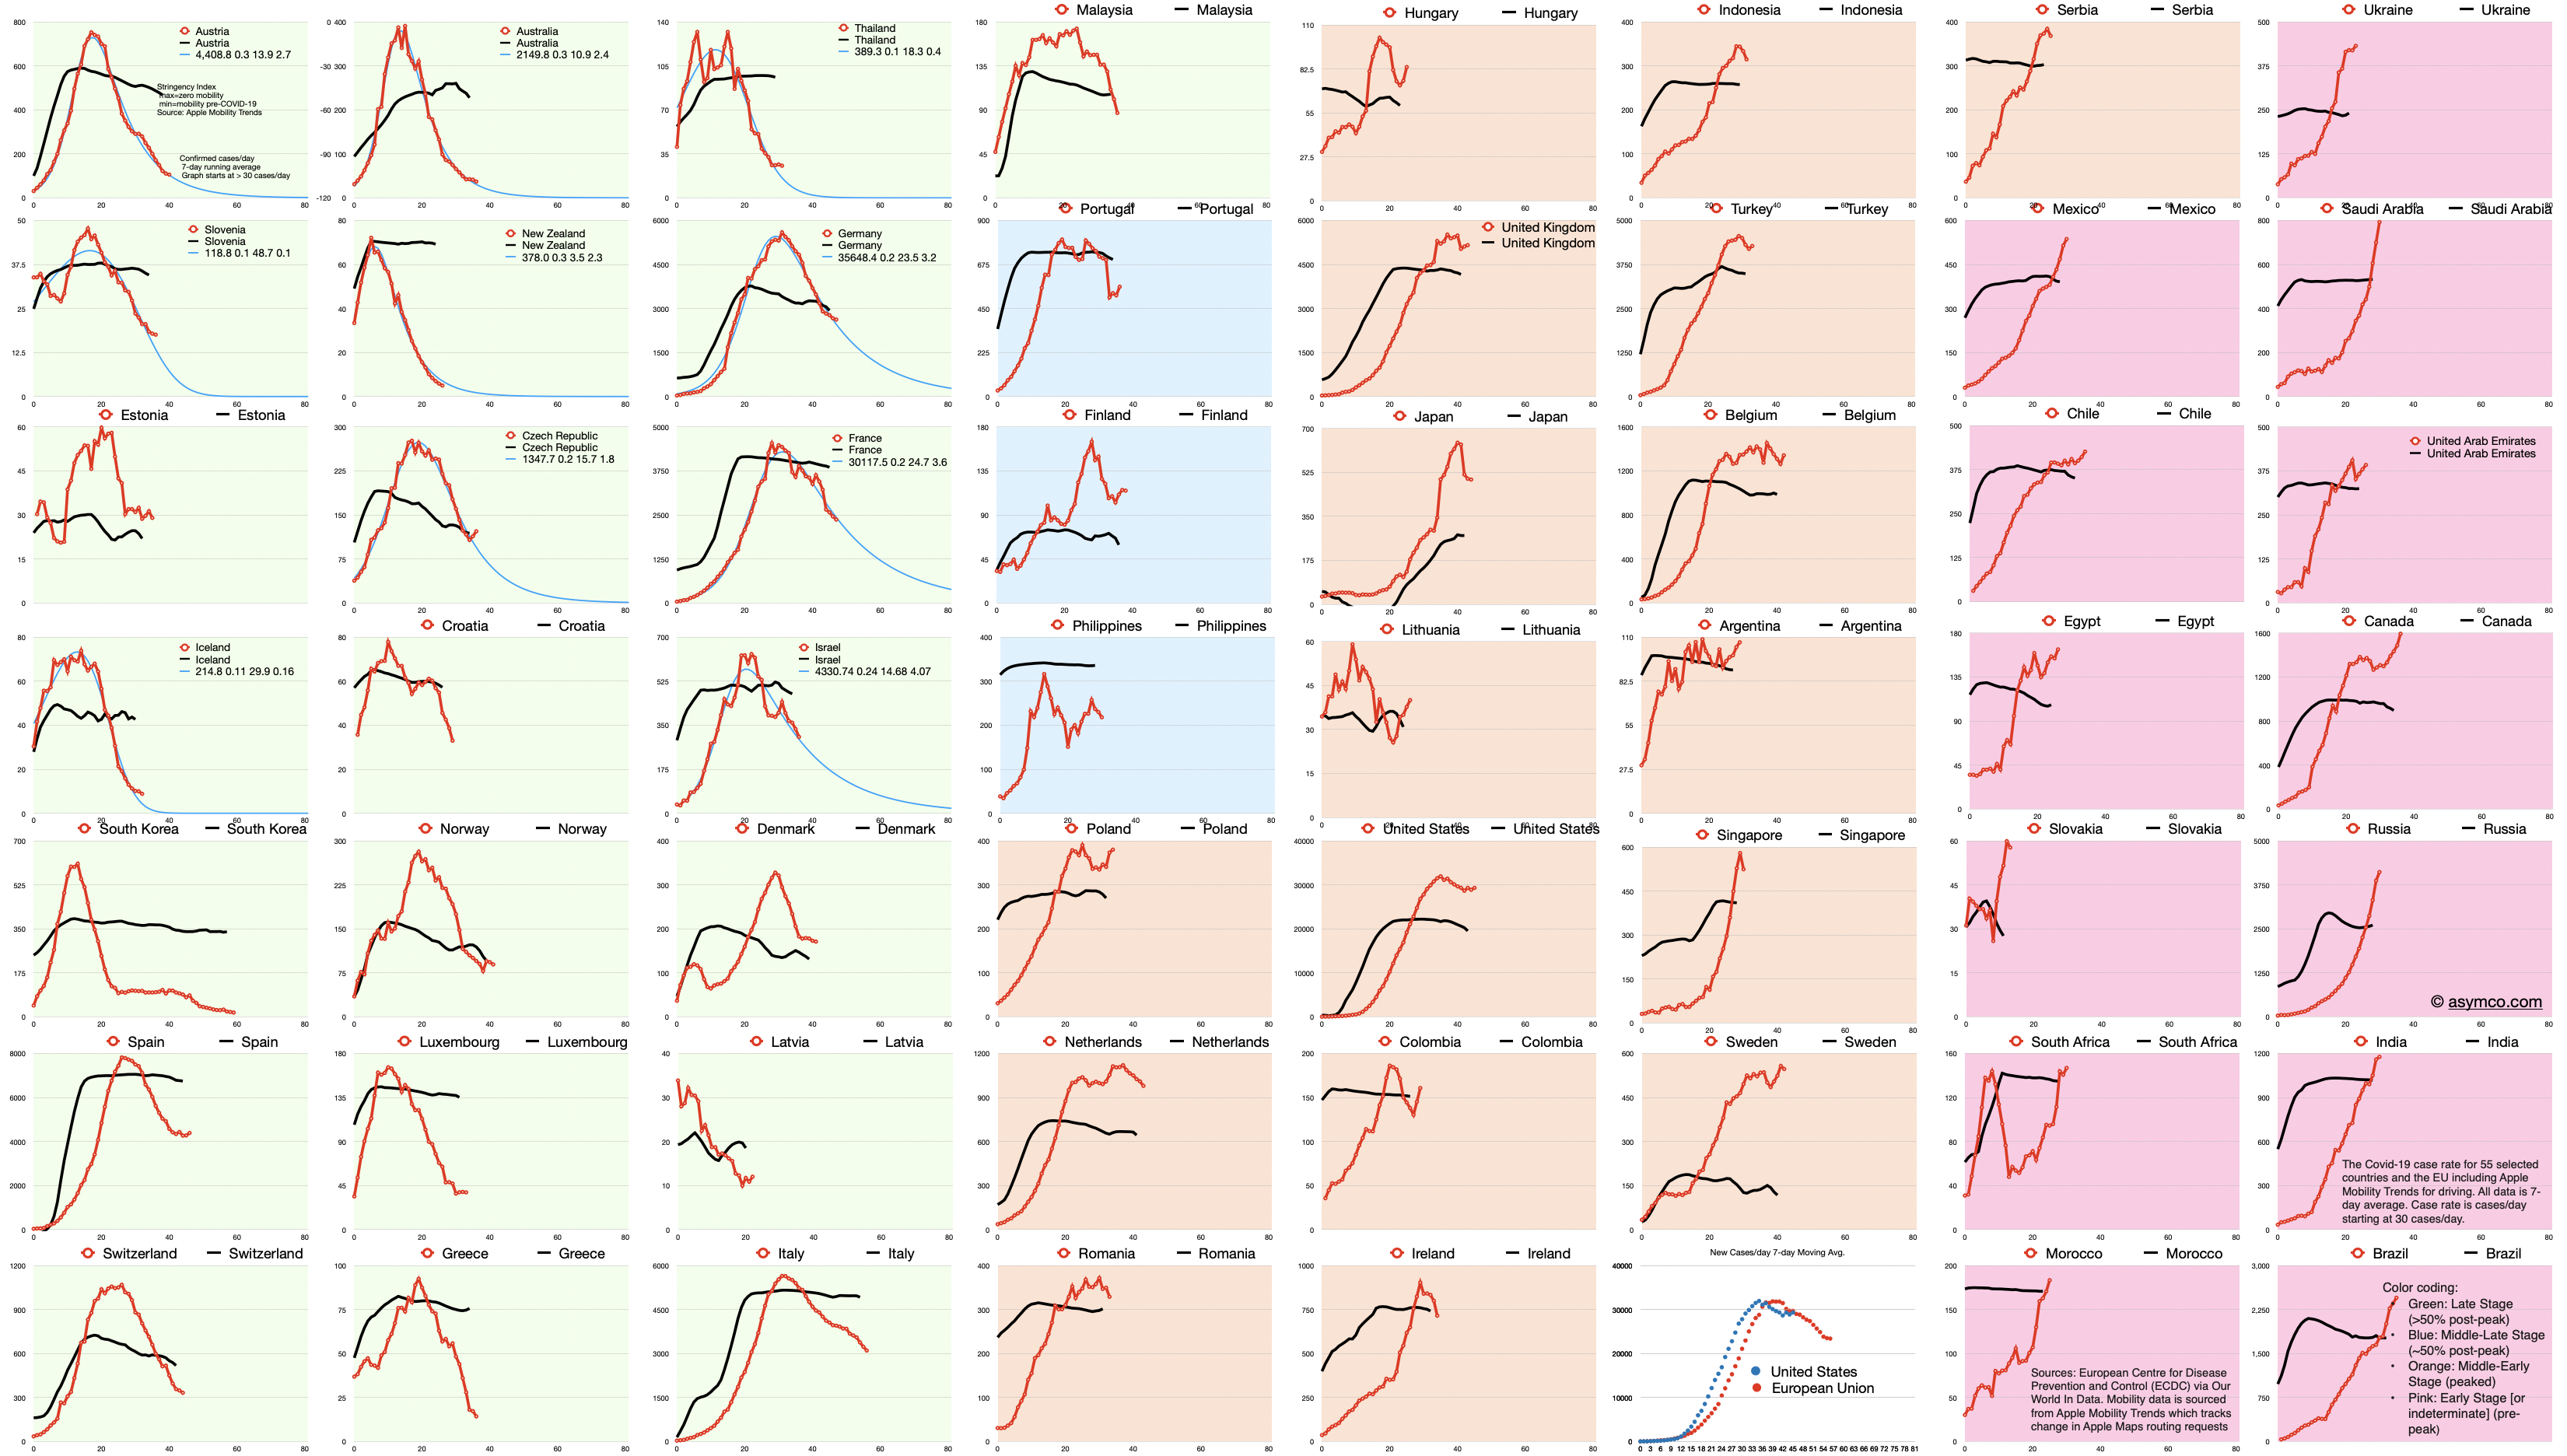
Download link for full resolution: https://asymco.com/wp-content/uploads/2020/04/Screen-Shot-2020-04-21-at-9.57.06-AM.png

Sources: Data is sourced from the European Centre for Disease Prevention and Control (ECDC) via Our World In Data. Mobility data is sourced from Apple Mobility Trends which tracks change in Apple Maps routing requests.
Comments