Covid-19 US Dashboard May 11 Including Mobility Data
by Horace Dediu
Join us for another #AsymcoFridayNight this Friday to discuss these latest developments and news from the markets.
Sign up here: https://vito.community/events/asymco-friday-night-fever
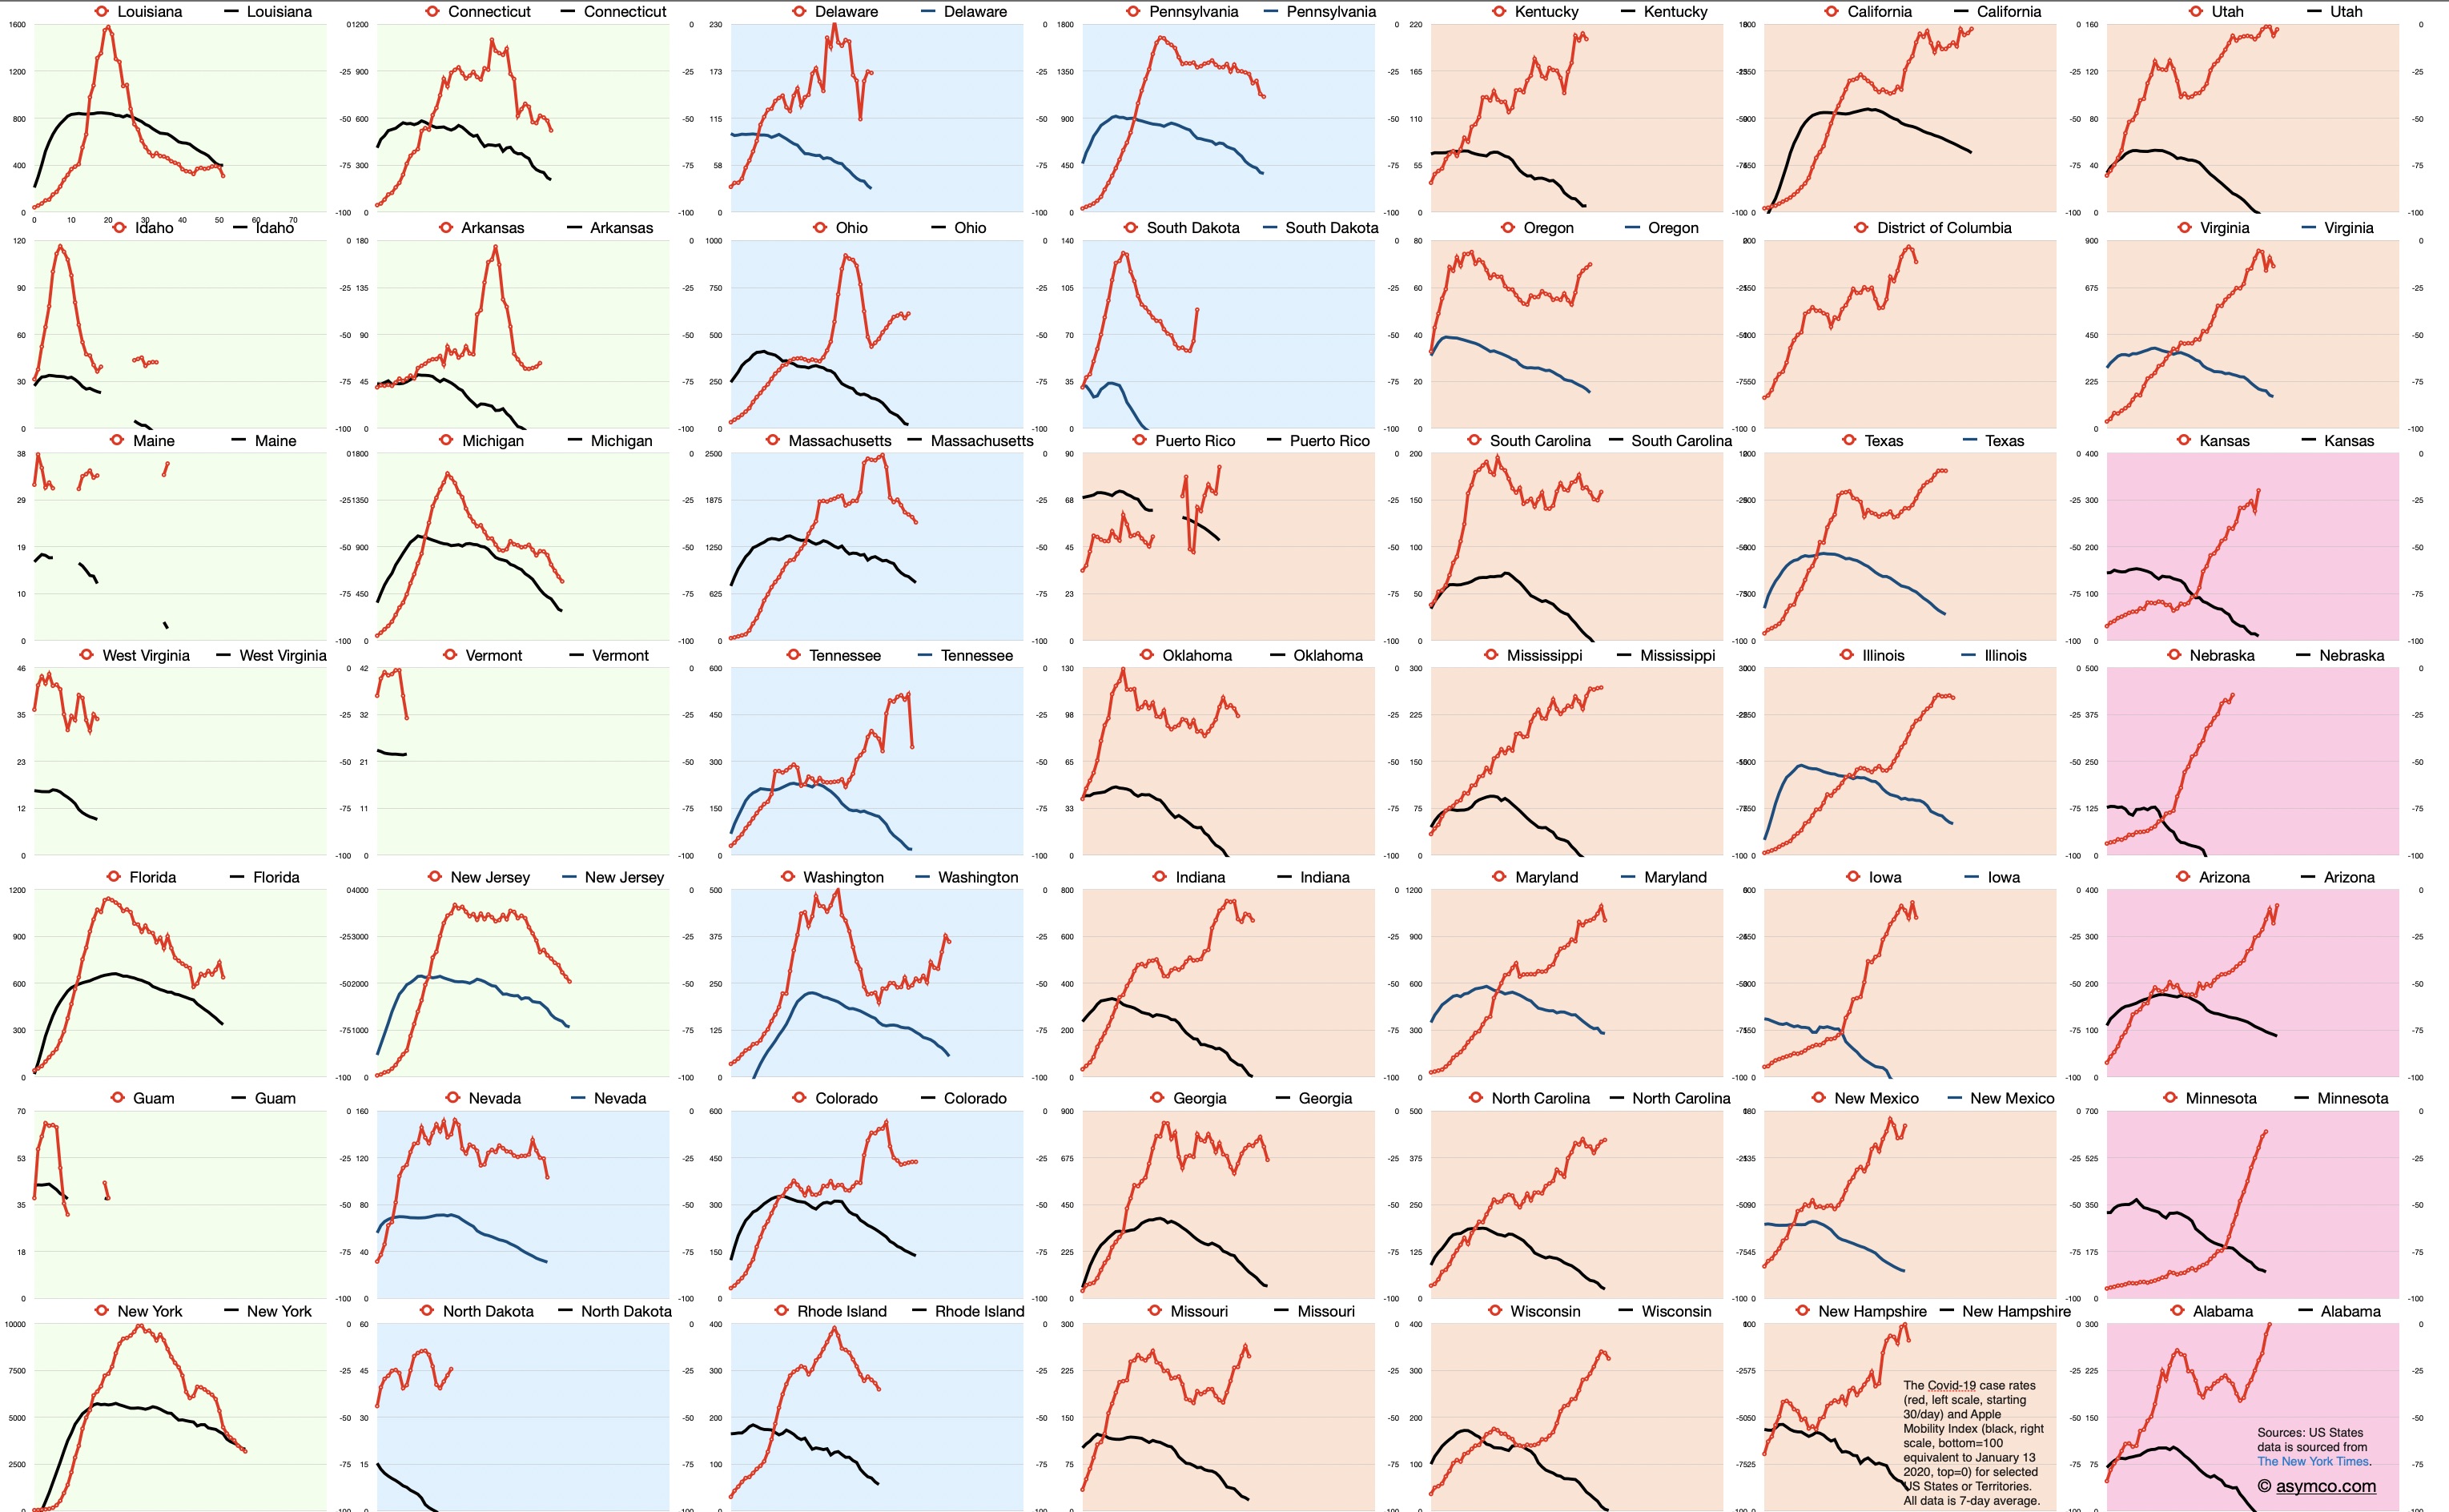
The Covid-19 case rates for selected US States or Territories including Apple Mobility Trend.
The Covid-19 case rates for selected US States or Territories including deaths/day data. Note that the two curves are not for the same dates but are offset in time to start from 30 cases/day over a 7 day average and 5 deaths/day over a 7 day average.
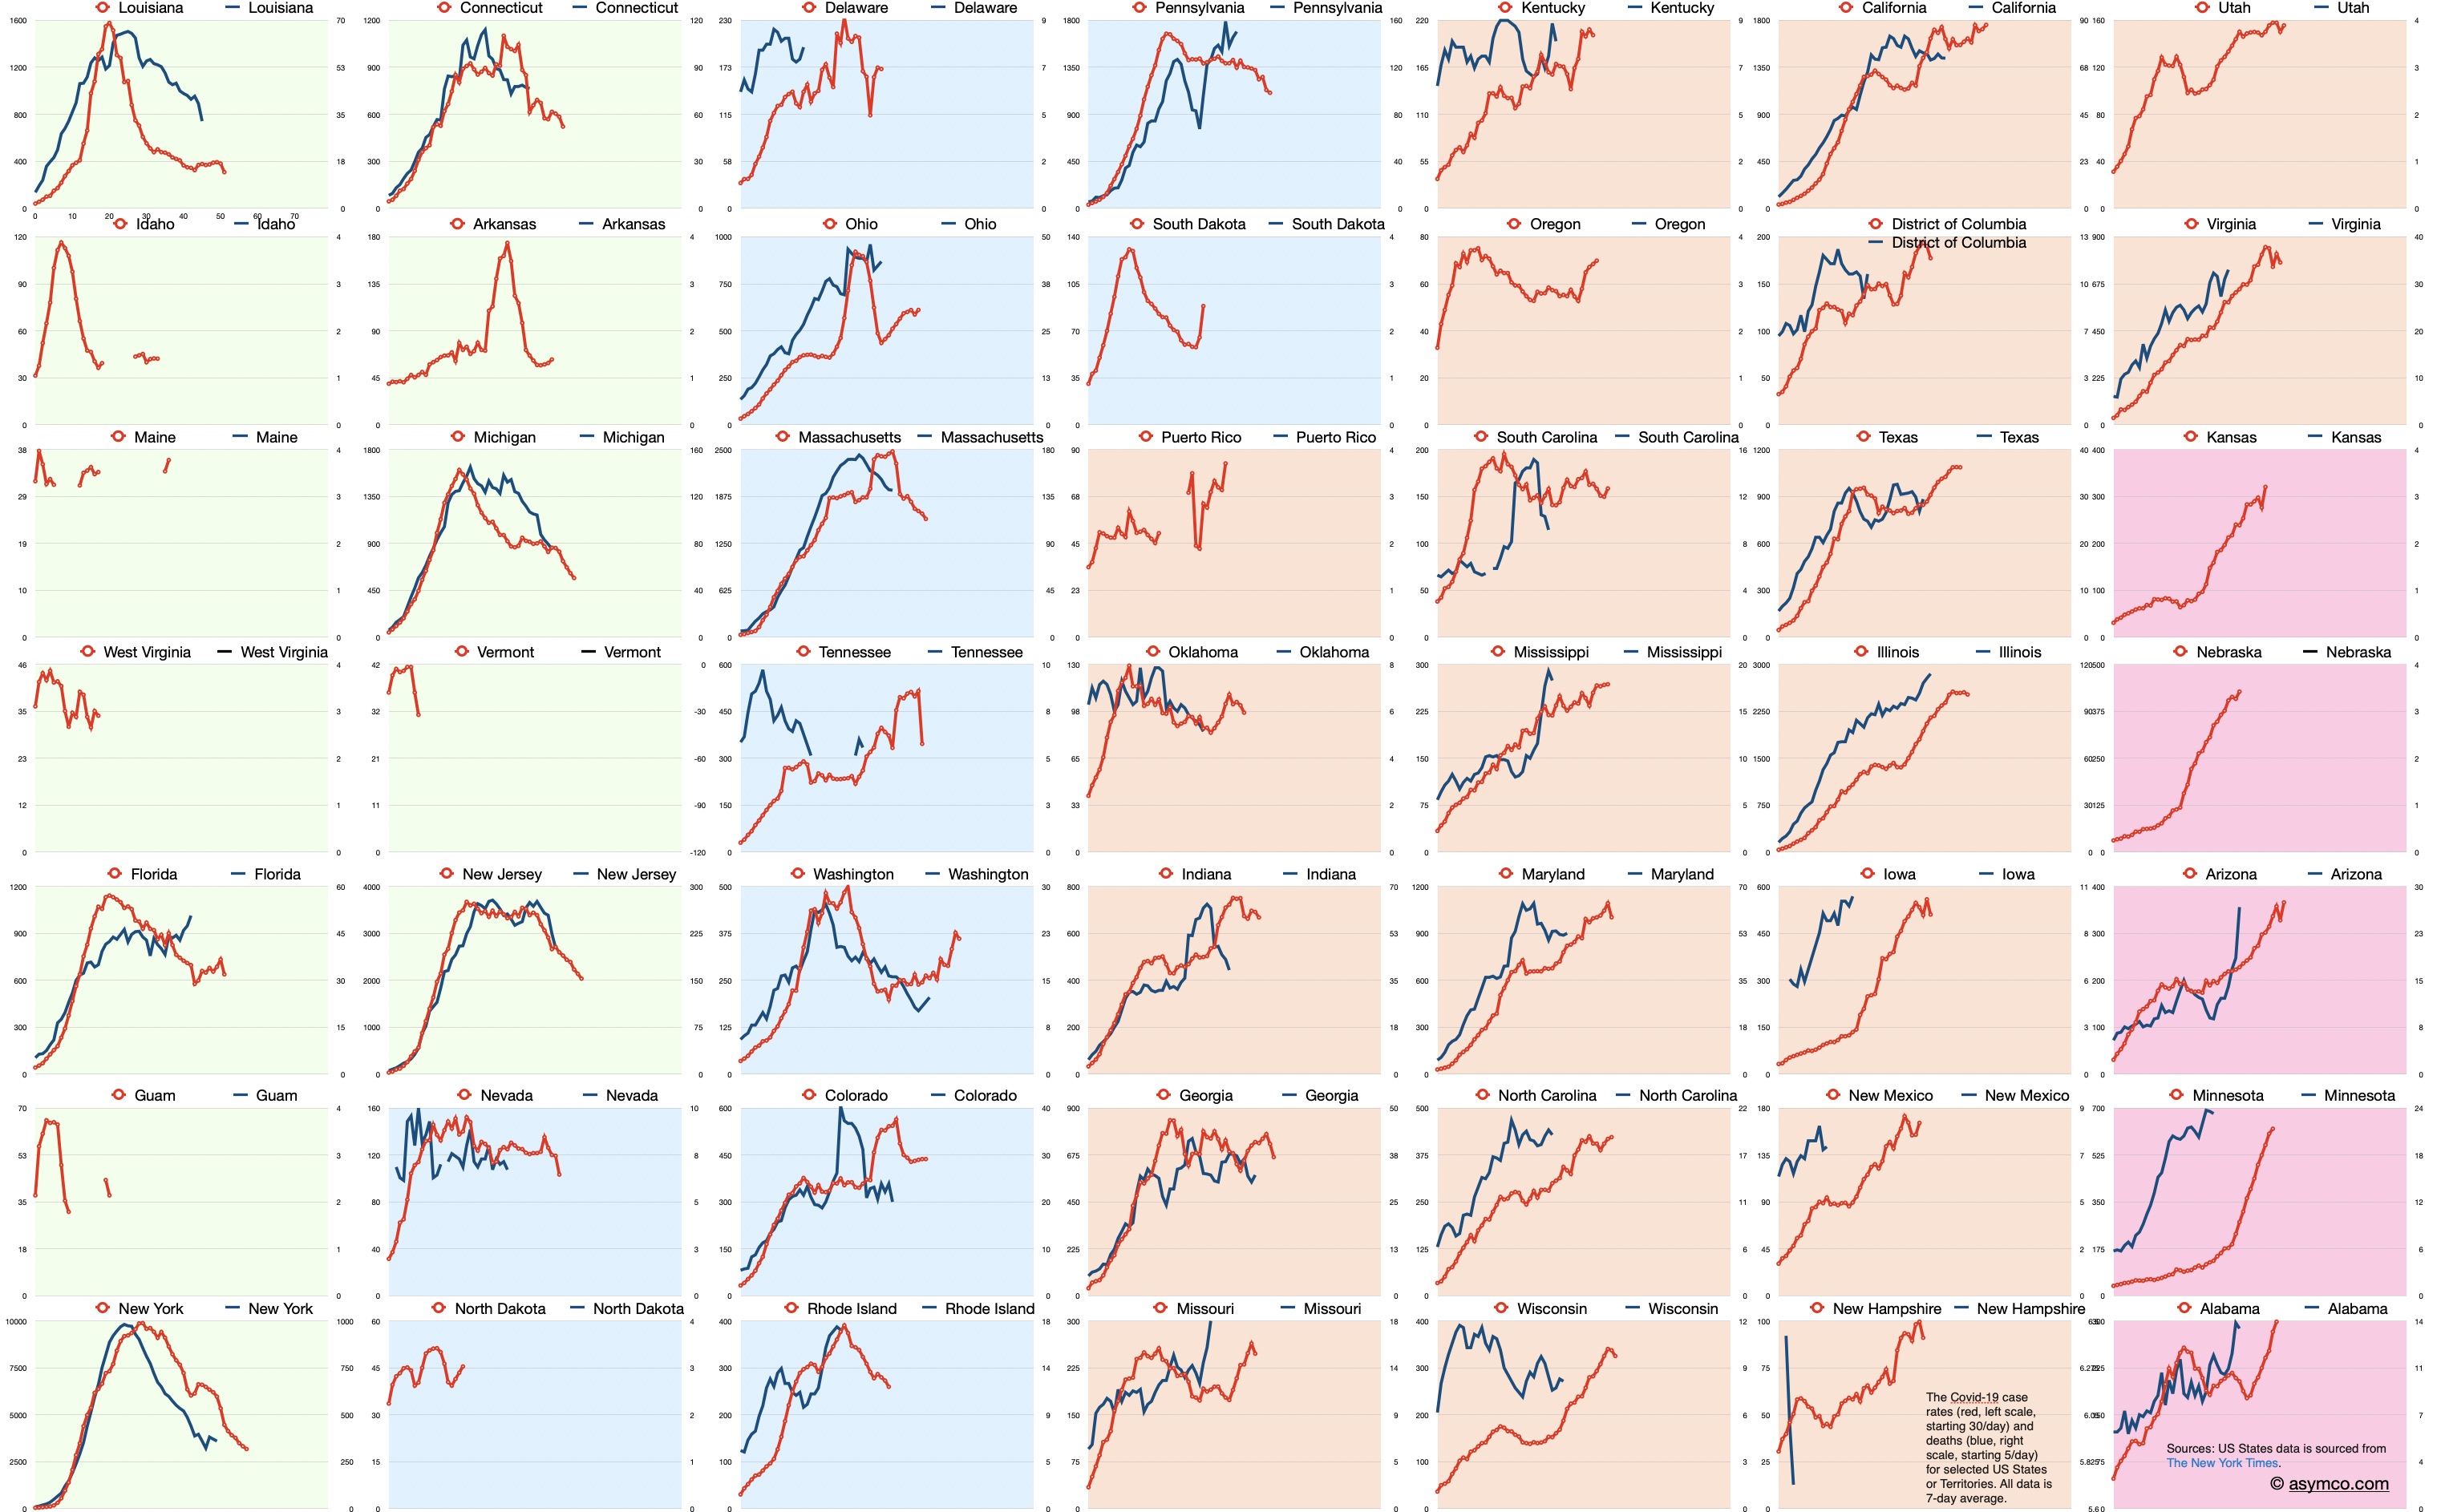
Color coding:
- Green: Late Stage (>50% post-peak)
- Blue: Middle-Late Stage (~50% post-peak)
- Orange: Middle-Early Stage (peaked)
- Pink: Early Stage [or indeterminate] (pre-peak)
US States data is sourced from The New York Times.
Comments