Horace and Jim begin with the industry's rhetorical bubble. We consider the auto eco-system's atmospherics on auto companions and quickly revert back to the reality of today's manufacturing practices and industry lead times.
How Apple is managed is one of its enduring mysteries. The idea that a company with $235 billion in sales is managed with a single P/L ((Profit and Loss statement is an income statement usually applied for a subset of a larger company which allows subdivisions to be managed individually.)) is fascinating in many ways. Not least of which is how it allocates resources. The fundamental question of which great idea gets to be funded and which great idea gets to be ignored is the core of every manager's dilemma. The Apple problem is at scale when each decision's consequences are so momentous. In the case of Apple there are so few projects that reach the market and their impact is so great that one wonders how they can be sure they are doing the right thing.
Conventionally, product development is filtered through a sieve of metrics, market sizing and impact on top/bottom income lines. These "financial" measures of success are considered prudent and optimized for return on equity (also known as the maximization of shareholder returns).
But this can be a toxic formula. The financial optimization algorithm always prioritizes the known over the unknown since the known can be measured and is assigned a quantum of value while the unknown is "discounted" with a steep hurdle rate, and assigned a near zero net present value. Thus the financial algorithm leads to promoting efficiency at the expense of creation. Efficiency may be the right priority when times are difficult and resources are scarce but creativity is the right priority in a time of plenty. And abundance is what being big is all about.
To allow for some creation large firms create divisions. Some divisions are tasked with "core products" which are measured by a set of firm metrics and some are tasked with "emerging products" which are given a set of loose metrics. This leads to obvious resentment and war between divisions when resources need allocating.
Ominously, the core divisions tend to always win. At the root of divisional power struggles are measurements--the roots of financial metrics. Managers fight with data. "You can't manage what you can't measure" they're taught. But if you have something that can be easily measured and something that is difficult to measure, won't the easily-measured be managed and the hard-to-measure be ignored?
There is a general principle at work here: Managing by measurement is fraught with the pitfall of measuring the wrong thing. Making sure that you're measuring the right thing becomes the value-adding role of the manager. A role that is increasingly being neglected.
The mass phenomenon of measuring the wrong thing because it's the easiest to measure is called "financialization". Financialization is the process by which finance and finances (rather than creation) determine company, individual and society's priorities. It comes about from an abundance of data that leads to fixation on what is observable to the detriment of awareness of hazards or obstacles or alternatives. This phenomenon is more likely when the speed of change increases and decision cycles shorten.
Financialization is creeping into all aspects of society and the extent to which it infects companies is the extent to which they suffer from early mortality.
So is Apple avoiding financialization? How can anyone avoid the tyranny of mis-optimization?
The unified P/L might be a clue. It obviates the need for divisional rivalry and power-based or financial politics. Without divisional P/L, management can be organized functionally with the obvious benefit of de-politicization. The singular P/L does create another problem however: the absence of an alternative resource allocation algorithm centralizes the decision. By centralizing decisions at the highest level, few decisions can be taken and that means each decision has to be right more often. We swap a distributed but financialized process for a central but capricious one.
So how is the central decision process made fair? What guides the allocation process?
I believe that Apple does not avoid quantified decision making. I believe the logic of their decisions is based on a nuanced quantification of the company's customer base. Opting to think about how many customers they have rather than how many things they can sell could offer the Apple manager a better decision tool, avoiding financialization and mis-optimization.
The guiding principle is putting the customer rather than the firm at the center of the decision process. The idea of this change of orientation extends to a re-definition of the purpose of the firm. Apple calls it its "North Star" and it places "making the best product" at that location.
The challenge is how to measure "goodness" of product. It's easy to overshoot "best" and become too good. What regulates greatness is another measurement: absorption of what you create. The true orientation (which Apple won't confess to) is absorbable greatness.
Absorbable greatness is measured through other proxies: customer creation, customer satisfaction, and customer retention. By adding and preserving great customers you can be sure that what you create is indeed the "best". Setting the goal, and indeed the purpose of the firm, as the creation and preservation of customers seems to be the unwritten constitution of Apple.
The idea that the purpose of the firm is to create and maintain customers is not new ((Customer creation is in contrast to the notion that the purpose of the firm is to maximize shareholder returns. The notion of customer creation as primary purpose was popularized by Peter Drucker. The notion of optimization through shareholder value creation was popularized by Jack Welch.)) but it is relatively rarely practiced. The reason is that the data is harder to obtain. The data that comes from sales is crisp and concrete. The data about customers is muddy and soft. In a world where spreadsheets are used as weapons, the crisper the data, the better the ammunition.
Clarity wins arguments but it may not be where salvation or truth can be found. Good judgement in a cloudy reality is a better compass than a clear road map to a fantasy world.
Optimizing around customer acquisition rather than equity returns leads to a new set of metrics. What would these metrics look like for Apple?
The company publicly offers three separate sets of quantity of customers and quality of customers.
In terms of quantity we have:
Number of iTunes accounts
Number of iCloud accounts
Number of active devices
In terms of quality of customers we have:
Average selling prices for devices (as a proxy for willingness to pay)
Customer satisfaction (as a proxy for loyalty )
Services and accessory revenues (post-sales and recurring value)
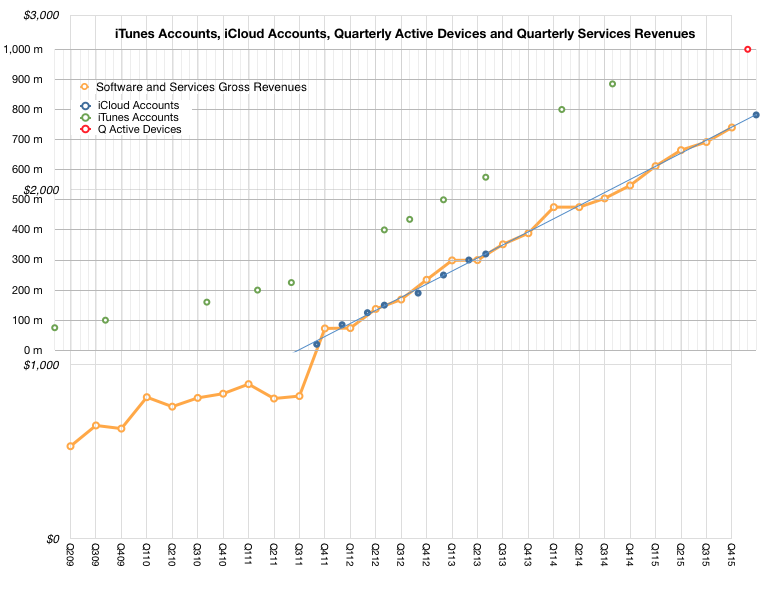
The following graph shows the historic data for service accounts and corresponding services revenues.
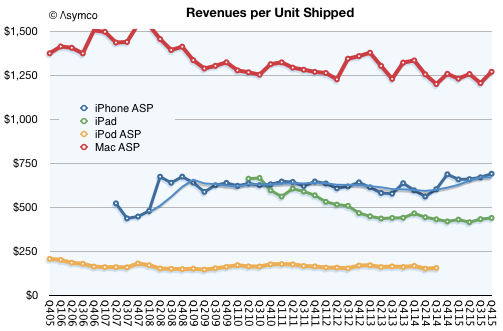
The following graph shows the average price per hardware product indicative of loyalty through stability in the face of growing competition.
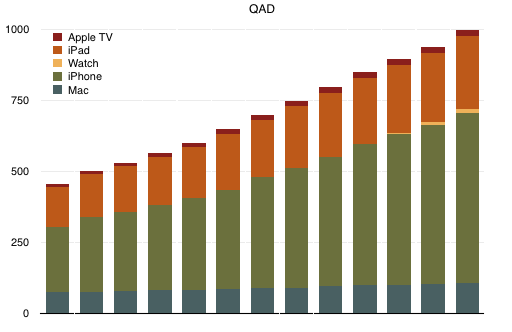
The following graph shows an estimate of growth in active devices as a proxy of customer base.
Unlike product shipments and revenue data which follow rises and falls in individual products due to the cyclicality of technology and adoption, these graphs show a smoothness and predictability of customer base behavior.
Looking at Apple this way gives the impression that the company has a large number (nearly a billion) of repeat (subscribed to service) customers. These customers can be seen to spend a predictable recurring amount (average selling price) on Apple's brand. The repetition of these metrics in public commentary suggests that customer acquisition and retention are among Apple's goals.
The key question is whether this is Apple's primary goal.
Seen this way each centralized resource allocation question can be assumed to be prefaced with "In order to create/preserve customers should we...?"
This leads to answers quite different from questions that start with "In order to sell/profit more should we...?"
For instance, offering education products, retail store experiences, healthcare products, green energy initiatives, accessories, content and services make sense even if they may have poor financial "returns". These initiatives score highly on customer retention and satisfaction. They may lead to engagement and repeat sales. Managers working on these initiatives would gain the respect of their peers, leading to more esteem and higher quality output. Finally, and most importantly, these efforts would be preserved regardless of cyclical downturns.
The assessment of analysts should therefore be couched in similar terms: "What is the impact of a new initiative in customer creation and preservation?" rather than "What is the impact of a new initiative in driving revenues and profitability".
We can see immediately why the second question is popular while the first isn't: it's easier to assess an answer to the second because we have the data that allows for its calculation.
This is why asking the wrong questions is popular.
Some say that advertising keeps the internet lights on. Advertising is a great business model for services but it has limits. There are only so many ad budgets to go around. What will fuel an internet that outgrows all the ad money in the world?
This is the topic that Ben Bajarin and I will explore in our next event: SUBSCRIBE: The Future of Online Services.
We will explore:
How will the online services business models evolve?
How will VR affect entertainment and communications?
How will AI affect shopping?
How will blockchain affect economics?
How will hardware affect software and services and vice versa?
How will users, usage, and capital connect?
Join us to learn more about the internet economy by studying the economics of the internet.
Horace and special guest Ben Bajarin of Creative Strategies discuss the Glance conference. They investigate the job of the Watch and touch on the changing responsibilities amongst the upper ranks at Apple.
Horace and Anders discuss the iPhone analog audio port, the lightning port's use by Apple Pencil and Apple's viewpoint on privacy and the environment. Horace rounds the episode out with a definition of disruption.
In my quoting of the "Cook Doctrine" I cited the primary criteria for Apple to enter a new market:
We believe that we need to own and control the primary technologies behind the products we make, and participate only in markets where we can make a significant contribution.
These criteria, often repeated, were certainly in force when Apple chose to enter the watch market. Apple has sought and achieved a significant market share and did so while owning and controlling the primary technologies behind the product.
I now turn to the significant contribution criterion to study the possibility of Apple's entry into the car industry. ((Control of the primary technologies behind the product is a topic for another post.))
The significance test shifts the speculation from whether Apple would build a car, to how many cars is could build. Making a few cars is easy (see first commandment of The Entrant's Guide to the Automotive Industry). Making lots of cars is hard and hence significance in the automotive market (as in watches and phones) means achieving some degree of adoption, a higher degree of usage and a very high degree of profitability.
So what does being significant in the car business mean? Does it mean becoming the next Tesla? The next BYD or the next VW? How quickly?
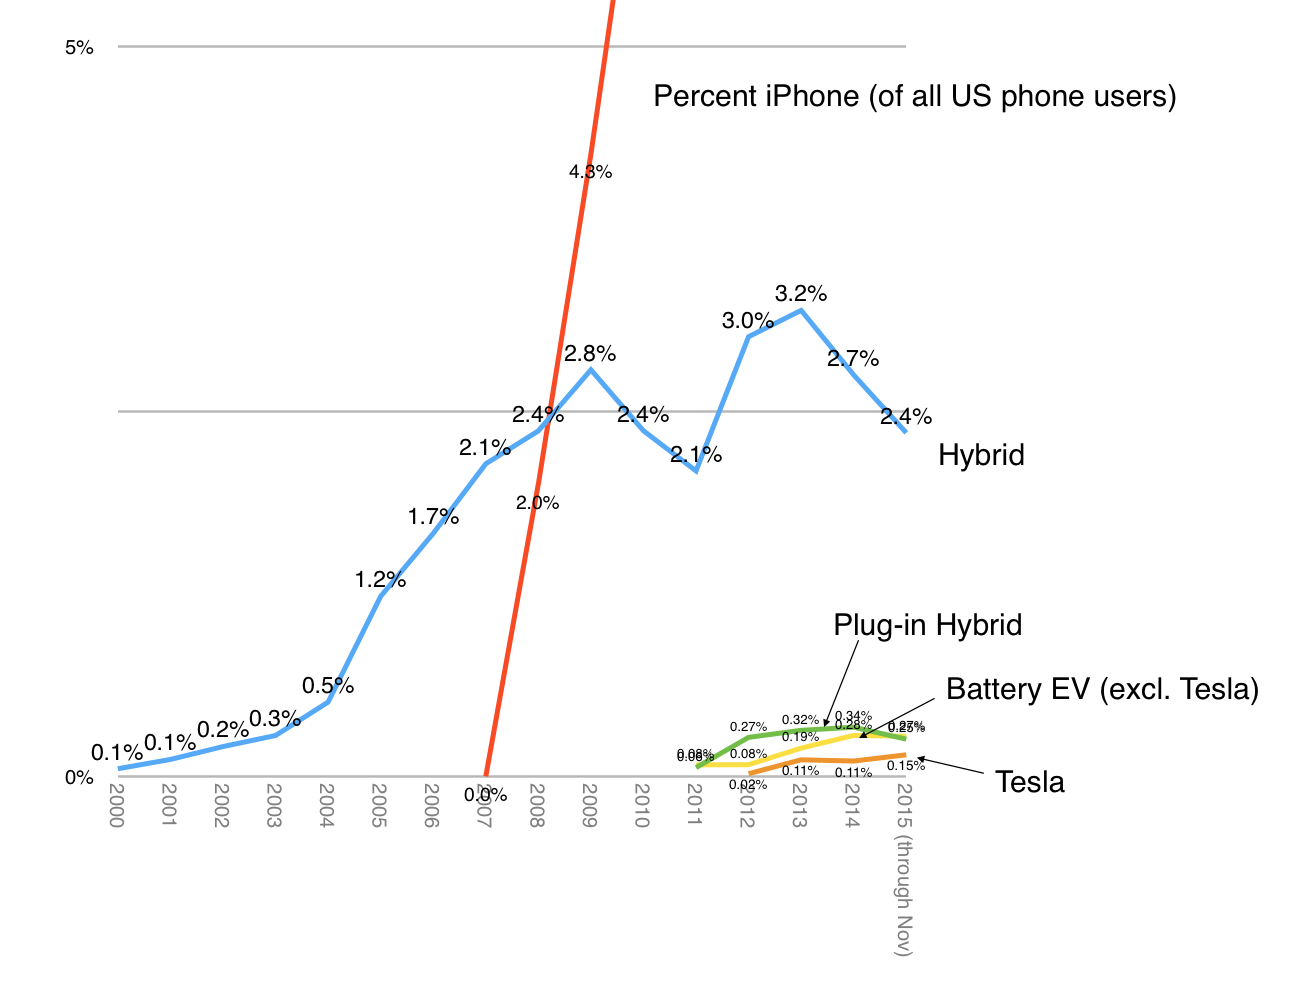
Fortunately, we have something to compare an Apple entry to. Apple has made a "significant" market entry in phones and others have made entries in cars. If we contrast the rate of growth of Tesla, EVs, and Hybrids ((Of which Toyota has 70% to 80% share)) to the rate of growth of iPhones in their respective US markets, we obtain a test of significance:
The graph shows the percent of sales for the alternative car technologies (and Tesla) vs. the percent of US phone users using iPhones (comScore). Here are the conclusions:
Hybrid cars were introduced in 2000 in the US. They managed to gain 2.5% within 8 years but have not increased to a consistently higher level since.
Electric vehicle sales re-sarted in earnest in 2008 and have gained 0.4% share in eight years. They are still growing, partly helped by significant federal and state subsidies.
Between sales start in 2008 and 2015 Tesla achieved 0.15% share.
The iPhone ushered in a new paradigm within the phone market ((Incidentally the number of phones in use and cars in use in the US is comparable.)) in mid 2007. In the time since, Apple achieved the equivalent of about 35% share of unit sales. ((Significantly more in terms of sales value and over 90% of profitability.))
Between 2002 and 2015 the share of smartphones as a percent of all phones reached over 80%.
To summarize, the range for entrant technology share capture spans between 0.4% (EVs between 2008 and 2015), 2.4% (Hybrids between 2000 and 2015) and 80% (Smartphones between 2002 and 2015).
Within a similar time frame, the range for entrant company share capture spanned between 0.15% (Tesla as percent of US car market) and 35% (Apple iPhone percent of US phone market). ((Toyota's capture of 2% of the market with hybrids may or may not be considered entrant--I chose to consider Toyota an incumbent which took share from others with the Prius))
The differences thus span two orders of magnitude (>100x). Put another way, if Tesla's car entry was equivalent to Apple's iPhone entry they would have delivered about 5.5 million cars rather than the 50.5k they delivered in 2015.
This wide gap in the impact of entry in the two markets has much to do with how modular are the systems being engaged by the entrants. An electric automotive system requires new infrastructure, new user behavior, and, in the case of Tesla, new distribution network and new post-sales support network. Offsetting this partially is a government subsidy.
In contrast, the smartphone communications and computing system leveraged existing infrastructure ((And vice-versa)), consistent behavior, at least initially, and the same distribution and support network. In addition, smartphones benefited from significant hardware and software and services ecosystems which encouraged third parties to add value to the system.
The difference in collaborative development and conforming user experiences (i.e. modularity) between the two innovations allowed the speed of change to be two orders of magnitude faster. The result is what I would consider significance for the iPhone vs. insignificance for electric vehicles to date.
Which leads us back to the question of why Apple would enter this market. If the absence of modularity prevents rapid change, that implies Apple cannot achieve any significant impact from entry.
We could ask the question differently: If they do enter, they could achieve significance only if they change the degree of modularity in the system. Think of it as allowing infrastructure leverage, consistent user behavior, wide distribution, wide support network, ecosystems, and component architecture; allowing rapid scale production and lower costs, etc.
Therefore the only way that Apple could justify entry would be if they "rationalized" the system into a sufficiently modular alternative. Only if we assume that change is possible could we then target share above the 0.1% insignificant change that has been demonstrated. They might even perhaps aim at 1% impact within a few years of entry. 1% was the iPhone target within the first full year of sales.
If system-wide change could be brought about and made uniquely (through some form of sustainable asymmetry) then the foreseeable share possibility quickly reaches the 10% range.
The last time that happened was when Toyota changed the way cars are designed and built. ((VW before Toyota and GM before VW. Incidentally Toyota, GM and VW are now nearly tied as the top three automakers globally.))
We consider the landscape that Apple's purported Titan project will address in a few years time.
Horace discusses the pattern of disruption powered by Moore's law. We turn to the transportation sector and consider the "reimagining" of the car. We further consider scenarios, from sustaining where the current players grow, to new entrant opportunities.
The conversation diverts a bit into the regulatory and taxation regime, specifically US road funding is largely tied to fuel taxes. We note the odd situation where an entry level car driver pays fuel taxes while a luxury Tesla driver does not.
We speculate on Apple's possible "meaningful contribution" to transportation and the required product, customer experience, sales channel, price and financing options.
Horace and Anders discuss viewing Apple's business as a recurring revenue model, then touch on the iPad Pro somewhat unsuccessfully and host a very special guest.
Apple Watch was released April 10th 2015. Eight months later we are holding the first Apple Watch conference. To kick off the discussion, here are my favorite myths about this new product:
The Apple Watch scored 100 out of 100 on the "IBM Watson Trend Scale". According to various surveys, about 100 million people will shop this Thanksgiving weekend in the US. One wonders how many purchases by 100 million shoppers merit a score of 100/100.
My estimate for units shipped has been 20 million in the first calendar year. About 7 million have been sold in the first two quarters. That leaves 13 for the holiday and Q1 (which includes Chinese New Year.) I still like these odds.
To learn more about the reasoning around this estimate and hear additional supporting data, join us at Glance conference.