Visualization of Apple's Income Statement
by Horace Dediu
This graphic representation of the current and year-ago sources of income and sources of expense for the company shows how the business evolved in the last year.
The colored segments in the first column are Gross Margin contributions per product for Calendar Quarter 2, 2010. The white segments are cost of sales for those products. These costs are combined in the second column and the operating expenses are shown in the third column, taxes in the fourth and Net Income is shown in the fifth.
The same information is shown for Calendar Quarter 2, 2011. Click for larger view (1440 x 873 pixels)
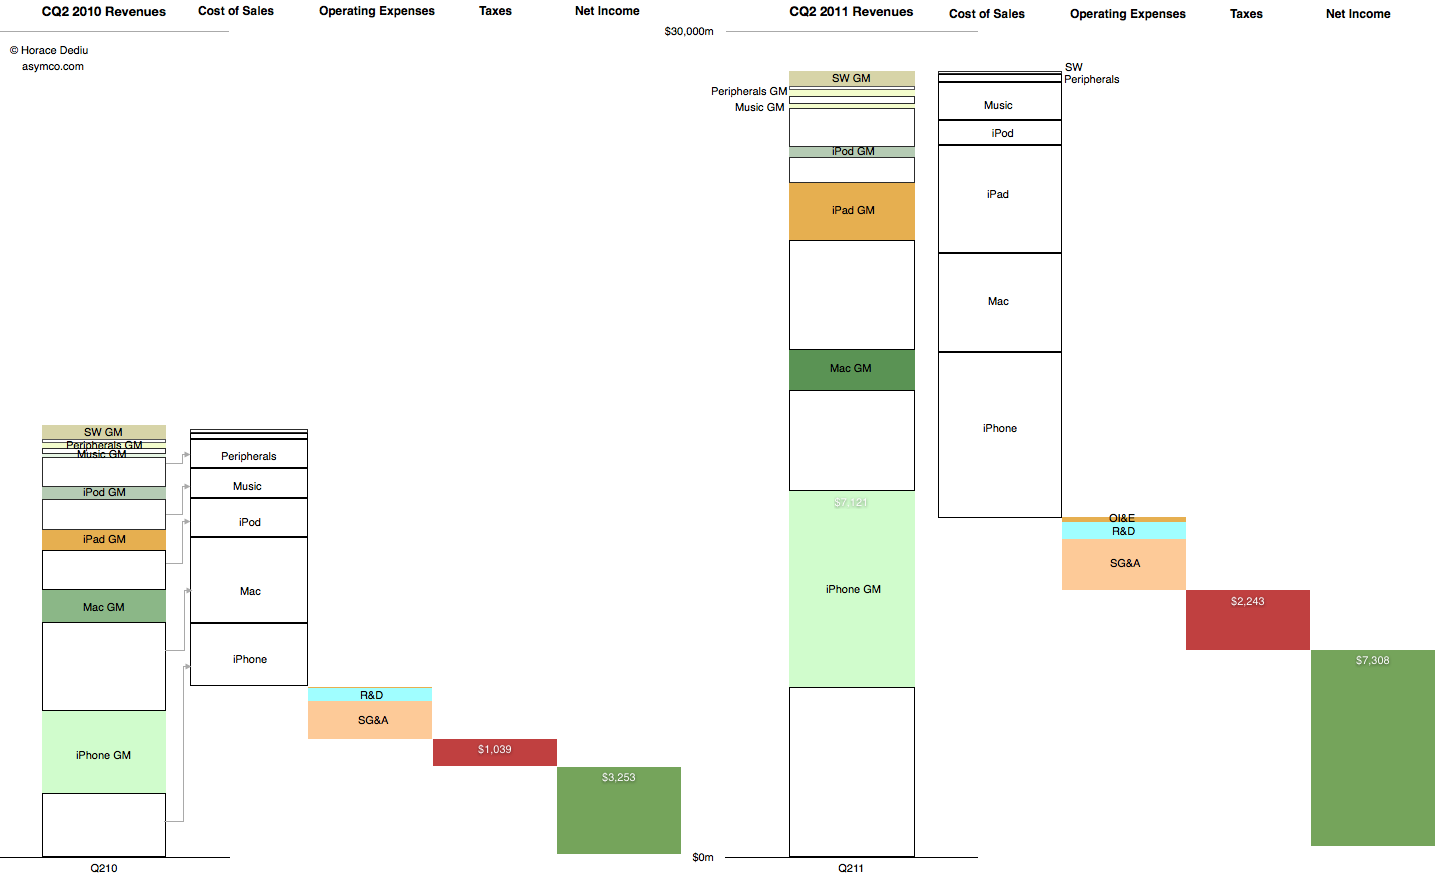
The increase in the first columns is the "top line" growth and the increase in the last (fifth) columns is the "bottom line" growth
Similar charts for the last few quarters are shown here:
Combating superlatives fatigue | asymco
12 comments
westech ·
I'm curious about your cost of sales by product. Can you elucidate where you got them? How confident are you about them?
Good chart, as always.
asymco ·
Hardware cost of sales are estimated based on historic analysis of bill of materials. Gross margin for peripherals, music (iTunes) and software are 45%, 10% and 80% based on comparable results at other companies and anecdotal data.
Eric D. ·
Does SG&A refer to selling, general and administrative? Would marketing overlap between this column and cost of sales?
Either way, it's amazing how Apple leverages its R&D.
asymco ·
Cost of sales does not include marketing. All marketing is SG&A. Cost of sales includes components, manufacturing warranty expense and transportation. Any cost that is directly in function of the number of units built (which is why for software cost of sales is usually negligible).
@ZeeNoGee ·
There's a mistake in cost of sales for 2010 I think. iPad is missing and has caused everything above it to shift down one. Best wishes. Alex
@ZeeNoGee ·
Sorry, to be clearer - the label iPad is missing. The data is ok I think.
asymco ·
Yes, thanks for pointing out. The labels did not get updated correctly.
westech ·
Cost of sales also includes labor and manufacturing overhead. Since manufacturing is contracted out it also includes the contractor's profits. Apple buys the raw materials (components) at costs far below market so using historic industry bills of materials is very misleading.
westech ·
FWIW, I have been using GM's of 58% for the iPhone, 35% for the iPad, 30% for Macs, 25% for the iPod, 20% for peripherals, 75% for software and 10% for iTunes. I can't really defend these numbers except that they seem to work.
Daniel ·
Hi, what software did you use to create this chart?
asymco ·
Numbers ($19.99 on Mac App Store).
Damon McCormick ·
I believe that in the cost-of-sales column of the left (2010) figure, your top 3 labels are shifted down one from what you intended. Current labels are "Peripherals", "Music", and "iPod", but they should be "Music", "iPod", and "iPad".