Valuation in a time of AI
by Horace Dediu
Cash flow is a fact, earnings are an opinion and share price is a dream.
A company's total worth is the number of outstanding shares multiplied by their value. This product is called the market capitalization or Market Cap.
That's a simplification. If you want to be more accurate, you should take the Market Cap and net out cash and debt--these are not part of the future flows of cash that can benefit shareholders.
More precisely, there is another measure called the Enterprise Value (EV) which is the total price tag of a company, representing what it would cost to buy the entire business and pay off its debts. EV = Market Cap + Total Debt + Preferred Stock + Minority Interest - Cash and Cash Equivalents.
This is the precise and complete measure of the firm's value but we use the shortcut of Market Cap since In most cases the Preferred stock and minority interest are negligible and if cash equals debt then the result is EV =~ Market Cap. it's easier to calculate anyways as the shares outstanding and share price are easily available. Not so for EV.
To get a sense of how much you're paying for the company it makes sense to divide the Market Cap by the company's Earnings so you get an idea of how many years it will take to get back your investment. When dividing both Market Cap and Earnings by the number of shares it becomes the famous P/E ratio or Price per share / Earnings per share.
But if you want to be fully precise, instead of using Market Cap you should use Enterprise Value. In that case the denominator should be Free Cash Flow or FCF1. The ratio becomes EV/FCF. Free Cash Flow is a better measure than earnings because it takes into consideration depreciation, change in working capital and capital expenditures. It measures the actual cash a company generates after paying for its operating and capital expenditures.
EV/FCF takes into consideration unusual situations such as huge amounts of cash or debt or capital expenditures which removes shareholder access to what the company "earns" on paper. This why the adage of "earnings are an opinion but cash flow is a fact" exists.
I used EV/FCF years ago to value Apple because at a time when it held huge amounts of cash. This was before it began aggressively reducing its cash through its capital return program. The P/E ratio at the time was very low but excluding the cash, it was even lower. It was a huge red flag indicating that the company was being priced for liquidation, or as some analyst put it, priced like a steel mill going out of business. If at that time you did not believe that its demise was imminent you would have surely been richly rewarded.
Today the anomaly that throws the P/E off is not Cash but CapEx. And it's not for Apple but for the other mega caps or AI "hyper scalers". Without worrying who is or isn't in the "Magnificent 7" I compiled the largest 10 market capitalization companies and looked at their P/E and EV/FCF ratios. At time of writing:
| Company | Market Cap | P/E Ratio | EV/FCF |
| NVDA | $4,014,456,963,072 | 33.6 | 44.4 |
| AAPL | $3,624,949,514,240 | 31.3 | 30.3 |
| GOOG | $3,304,174,911,488 | 25.2 | 44.3 |
| MSFT | $2,667,926,257,664 | 22.5 | 35.0 |
| AMZN | $2,157,182,320,640 | 28.0 | 297.0 |
| TSM | $1,641,528,688,640 | 30.6 | 50.0 |
| TSLA | $1,333,163,982,848 | 332.0 | 225.0 |
| META | $1,356,802,949,120 | 22.8 | 32.6 |
| BRK-B | $1,023,780,323,328 | 15.3 | 44.1 |
| LLY | $793,550,454,784 | 38.6 | 142.3 |
As recently as six months ago, there was a lot of talk about an AI bubble. Back then I looked at the data then and by looking at the P/E ratios convinced myself that the valuations were not "bubble" level. They were in the mid-thirties. These were not historical high especially when considering the growth these companies were experiencing (over 30%). Since then prices have come down significantly.
This is as the CapEx elephant in the room has been making itself known and there is renewed alarm at the scale of capital spending. This is reflected in the EV/FCF number but not in the P/E number.
The table above shows how much more elevated the EV/FCF ratio is relative to P/E for many of the companies. This "truer" measure of what you are paying as a share buyer is now reflecting in reduced share price and hence reduced P/E.
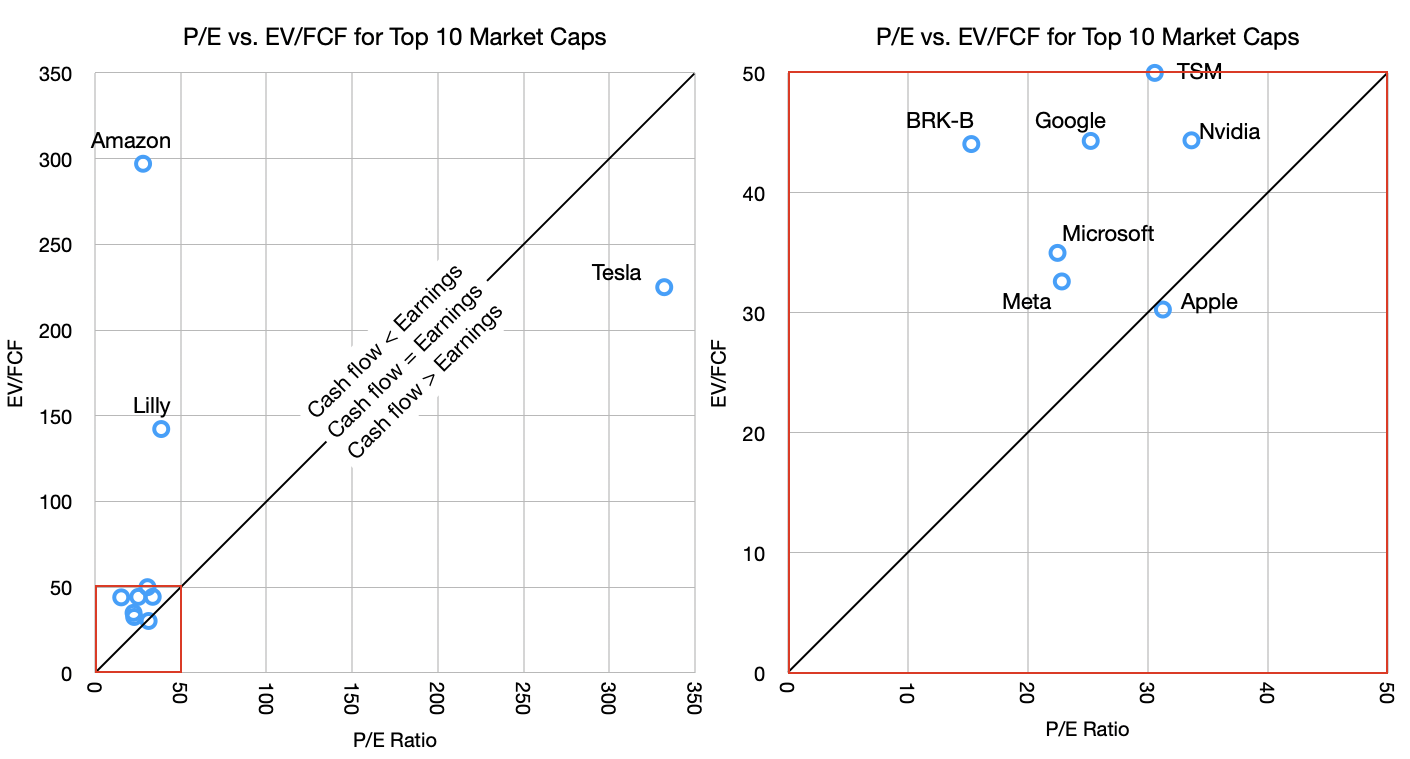
Of course, this is not true for Apple. Apple's P/E ratio and EV/FCF are nearly identical. To see this more clearly I put together these graphs.
The graph shows the P/E vs. EV/FCF for the companies in the table. The graphs are the same data but the one on the right is zoomed in on the lower left corner (note the red squares).
The reason for the zoom is that there are three outliers. Tesla, Amazon and Lilly. Tesla has absurd valuation on both P/E (300 to 400 range in last 6 months) and EV/FCF while Amazon has an outrageous EV/FCF value due to abnormal capital spending. Basically, Tesla has negligible earnings (and negative growth) while holding astronomical share price and Amazon is spending far above its median on CapEx. Amazon's 10-year EV/FCF is much lower, at approximately 55.
But let's ignore the outliers and concentrate on the other seven in the cluster. These are below 50 P/E and 50 EV/FCF thresholds.
Note that I drew a diagonal line representing the equation of P/E = EV/FCF. This should, under normal circumstances, hold for most stocks. Just like Market Cap should roughly equal Enterprise Value so Earnings should equal Free Cash Flow.
Most companies should not stray too far from this line. But what we are seeing, with the notable exception of Apple, is that most tech companies have cash flow far below earnings. This is again due to the CapEx elephant.
The argument goes that this is a temporary situation with that capital being wisely deployed for returns from AI. Presumably, these companies will swing to the other side of the line, where cash flows will exceed earnings, compensating for the capex that was denied to the shareholders.
This is where the old adage comes into play: Earnings are an opinion but cash flow is a fact. I added to that "and share price is a dream". Take the free cash flow and multiply it by a "dream" and you get the price the market sets. This dream is the multiple.
What makes the AI "bubble" interesting is how it's not fueled by debt2 but by cash flow. Companies are turning over large portions (almost all and sometimes more) of their cash flows to investing in the dream of AI profits. All but one, of course.
There is something obviously contrarian in Apple's strategy. Perhaps it's not Apple that is odd but rather there is groupthink on behalf of the others. The question of who's right will rest on whether it turns out that AI is going to commoditize quickly or perhaps never, whether AI turns out to be modular or integrated, whether AI exhibits disruptive or sustaining competitive responses, whether it's an infrastructure subject to regulatory corrosion or whether it will migrate to the edge and iterate freely, whether it's a new experience or simply better existing experiences, whether it creates new markets or just makes existing ones more efficient.
These are not new questions. They have been applied to all software and hardware innovations of the last 40 years. We have a lot of history to inform us.
Join me as we learn.
- To calculate FCF, look at the Income statement, start with earnings before interest and taxes (EBIT), add depreciation, subtract taxes and CapEx.
- There is some debt of course, but the scale is so immense and the risks so high that most lenders would not touch this type of investment.
1 comment
deemery ·
THANKS! This explains the P/E and EV/FCF in ways that I can grok.
But as a test of my understanding: EV/FCF can be interpreted as "how long would it take for the enterprise to buy itself?"