Estimates for Apple's March Quarter 2026
by Horace Dediu
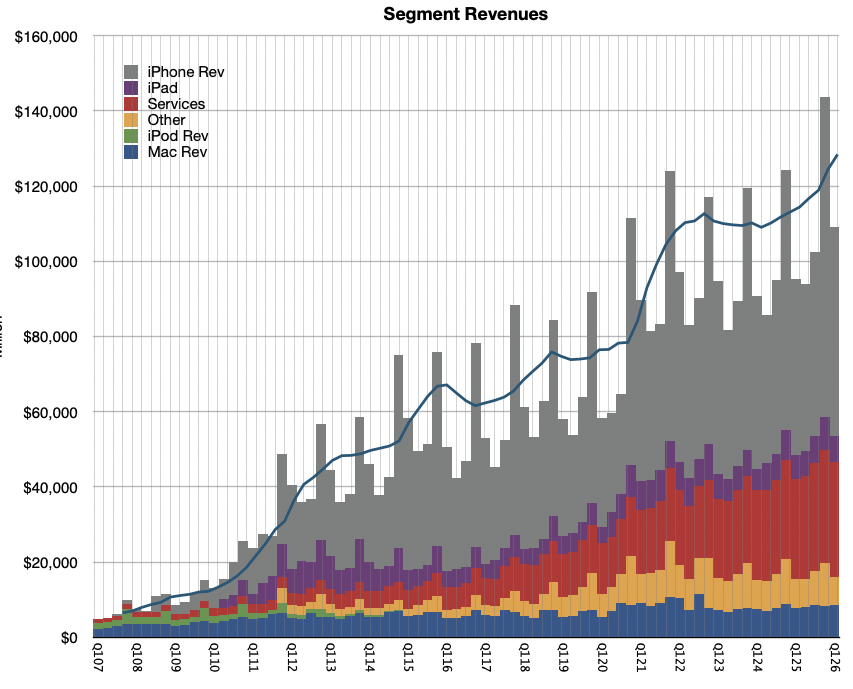
Revenues and growth rates for iPhone, Mac, iPad, Services, Wearables, plus Net Sales, Gross Margin, Operating Expense, Other Income and Expense, Tax Rate, Net Income, Share Count and EPS with a comparison to CFO guidance.
Kevan Parekh, Apple CFO: As we move ahead into March, I would like to review our outlook, […]. We expect our March total company revenue to grow by 13% to 16% year over year, which comprehends our best estimates of constrained iPhone supply during the quarter.
We expect services revenue to grow at a year-over-year rate similar to what we reported in December. We expect gross margin to be between 48-49%. We expect operating expenses to be between $18.4 billion and $18.7 billion, which is at a similar level to what we reported in December and driven by higher R&D on a year-over-year basis. We expect OI&E to be around $100 million, excluding any potential impact from the mark-to-market of minority investments, and our tax rate to be around 17.5%.
I've seen several market reports which estimate that iPhone shipments grew around 3% to 6% in the quarter. When I plug in, say, IDC's iPhones number into my model, and assume quite aggressive growth on the other categories (including Services) I get a y/y revenue growth of 11%. This is far below Kevan's January's guidance quoted above (13% to 16%).
Are IDC, Gartner, et. al. signaling a huge miss?
I need to point out that in the preceding December quarter the iPhone grew revenues at 23%! In order for Apple to hit its targets
I'd also point out that when Kevan Parekh made his forecast, in late January, a full month was already on the books for Apple. Visibility into the next month would have been relatively good as orders from the channel are partly foreseeable. For a change from implying nearly 20% growth in sales/14% in units one third of the way in, to IDC's 3% in units for the whole quarter would imply a collapse in demand into February and March. We're talking double digit decline in order volumes.
Moreover, IDC commentary on Apple is
Apple secured second place, driven by the strong performance of the iPhone 17 series, which saw significant growth in China of over 30%. This led to a 3.3% year-over-year increase in global sales for Q1. Although demand remains robust, supply disruptions and a reduction in channel support in some key markets have hindered growth..
30% growth in China! For this to be tied to 3.3% growth globally would imply significant declines elsewhere. I struggle to see how this adds up.
Here is my complete forecast for the quarter including growth rate for revenues for iPhone, Mac, iPad, Services, Wearables, Net Sales, Gross Margin, Operating Exp., OIE, Tax Rate, Net Income, Share Count and EPS with a comparison to CFO guidance.
| Asymco Est. (in $ million) | Asymco est. growth | Kevan Parekh, Apple CFO Guidance | |
| iPhone Revenue | $55,717 | 18.9% | |
| Mac Revenue | $8,640 | 8.7% | |
| iPad Revenue | $6,955 | 8.6% | |
| Services Revenue | $30,375 | 14.0% | |
| Wearables Revenue | $7,522 | 0.0% | |
| Net Sales | $109,209 | 14.5% | 13% to 15% |
| Gross Margin | 49.2% | 48% to 49% | |
| Operating Exp. | $18,496 | 21.1% | $18.4 to $18.7B |
| OIE | $100 | $100 | |
| Tax Rate | 17.5% | 17.5% | |
| Net Income | $29,115 | 24.2% | |
| Share Count (million) | 14,720 | -0.6% | |
| EPS | $1.98 | 20.2% |
2 comments
AAPL ·
Rhetorical question...How is a company that's likely reporting sales and profits growing by about 15% + 24% respectively (YOY) for a net income of $2.25 BILLION dollars per week (in their historicaly slowest quarter) have a PE ratio of just 33.4?
deemery ·
I spent a couple minutes at an Apple store, playing with a Neo. That display looks great, and it loaded websites quite quickly.