The Composition of Active Devices
by Horace Dediu
Measuring the future
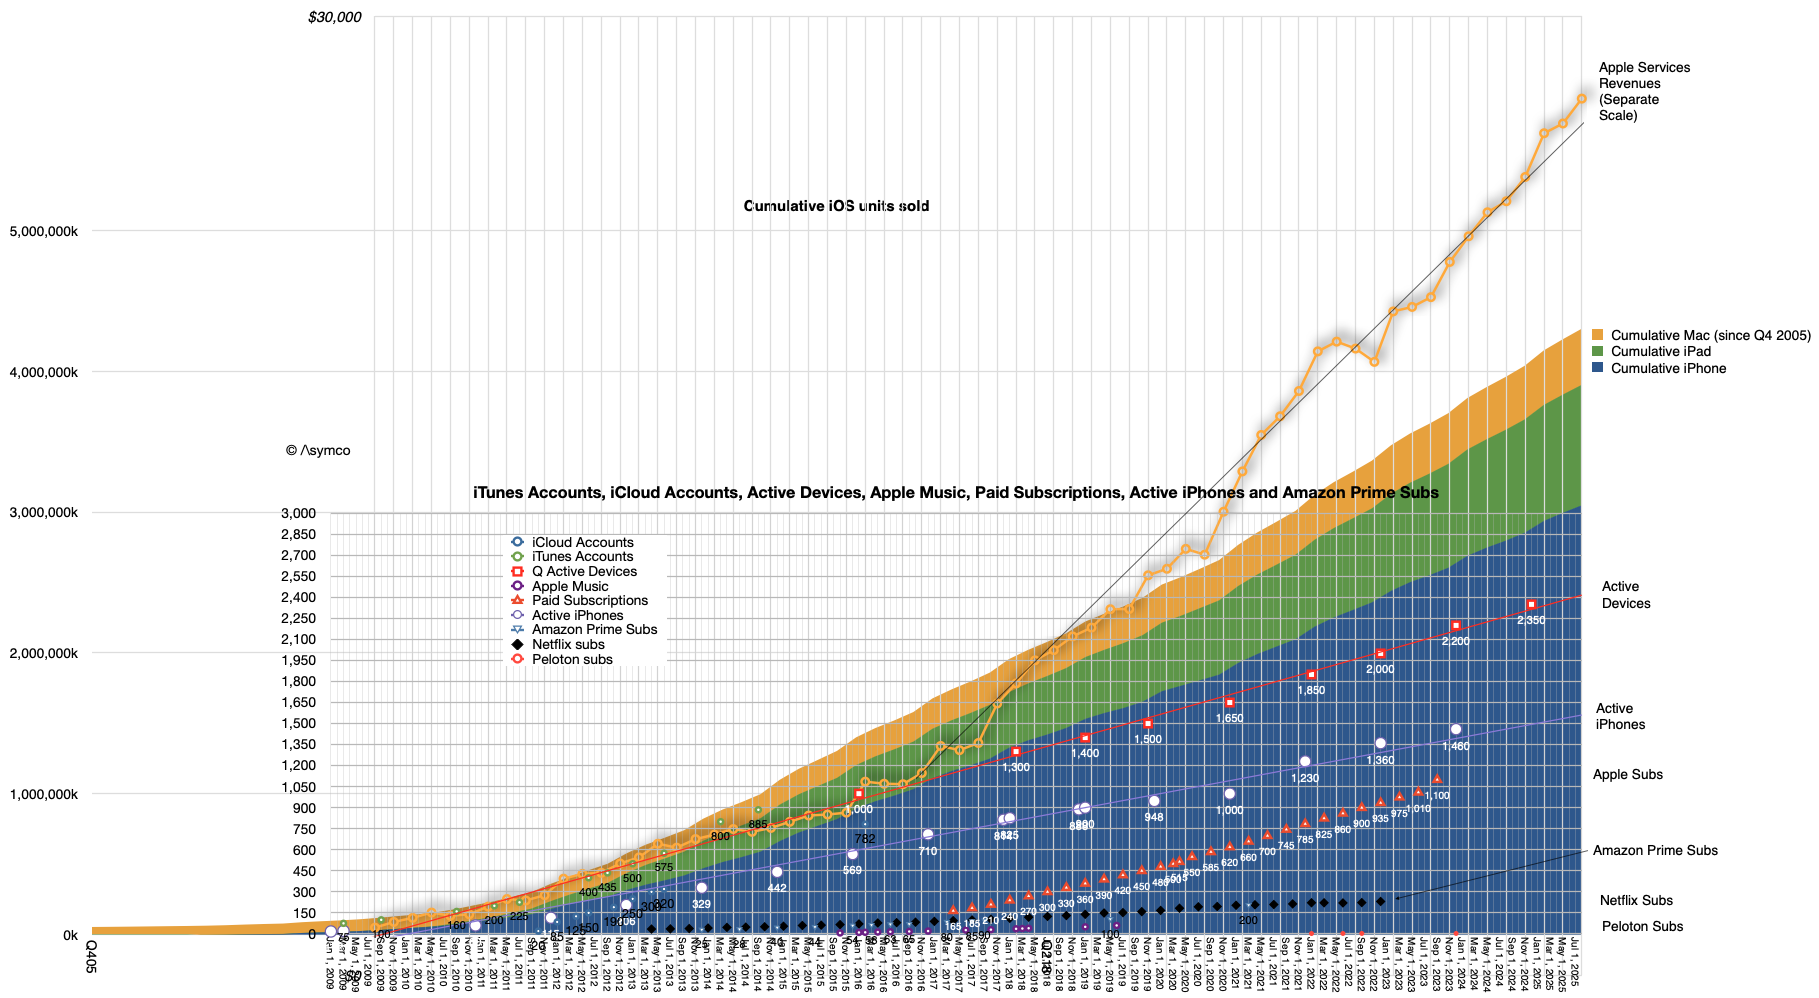
In January this year Apple reported that there were 2.5 billion active Apple devices in use. This figure has been getting updated for years and I've been reporting its trajectory and other measures that are correlated to it. For instance the number of Apple subscriptions, Apple Services revenues and other historical indicators such as iCloud accounts and Apple Music.
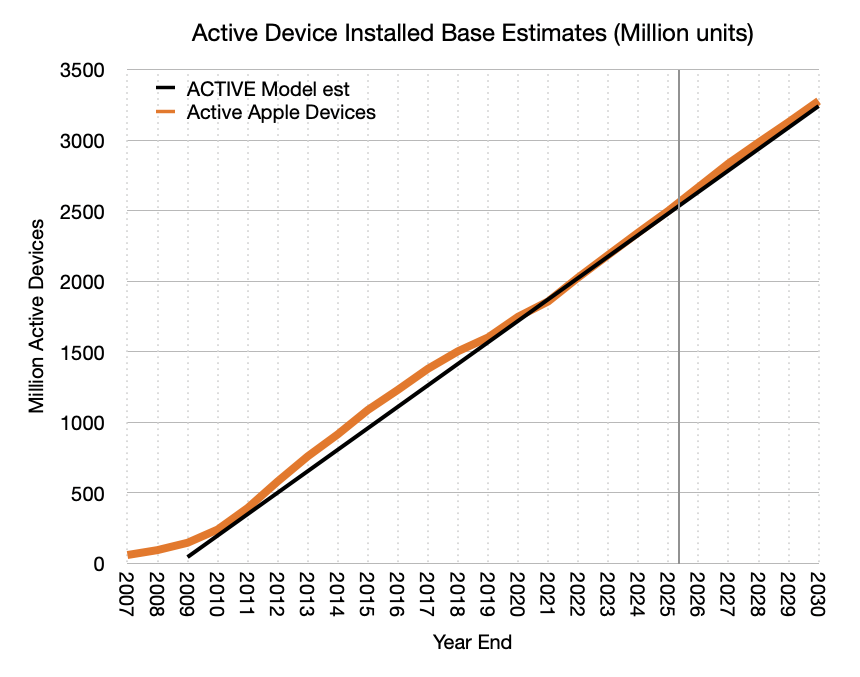
Simplifying, I published the "ACTIVE" model which makes some basic projections of this total device count and it's shown below"
One element of the analysis that has eluded me was the more precise composition of this total "devices". In other words, which devices and what is their mix. We have seen numbers for iPhones but not for other types of devices. I should note that this is not easily derived because we have neither the units sold (only revenues) and we don't know how long they stay in use. The measure of active population implies that the products are bought, used and eventually retired.
The only clue we have, beside quarterly revenues--and even there wearables and home are not separated by product--is that management occasionally mentions that "more than half" of buyers of a specific product are "new to the product". It's not much to go on.
But there are other data sets we can tap. StatCounter provides a share of platforms in use by aggregating browser identifying data for a moderately large set of web sites. That may help with share of base but not with how much the total base is. Various other analysts do try to summarize some of the installed base for particular dates.
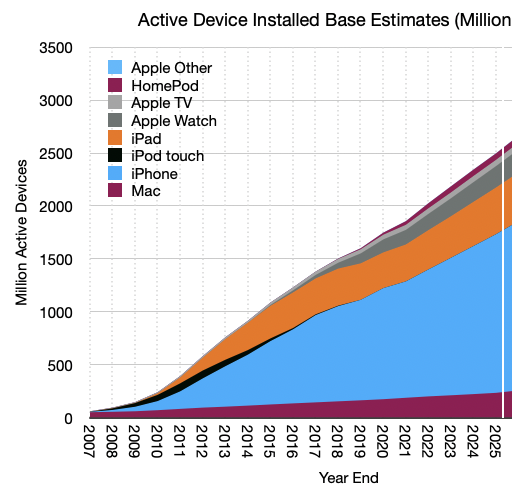
Combining all the available data and some interpolation, I set out to do is to provide a yearly count of the population of Apple devices for each year since 2007. Then to try to forecast this population to 2030. The result is shown below:
The following is a summary for the components for the end of 2025 in millions:
| Year-end | Mac | iPhone | iPad | Watch | Apple TV | HomePod | Other |
| 2025 | 233 | 1500 | 442 | 203 | 58.5 | 61.75 | 0.5 |
This history looks like this:
What about the future? Let's dig in.
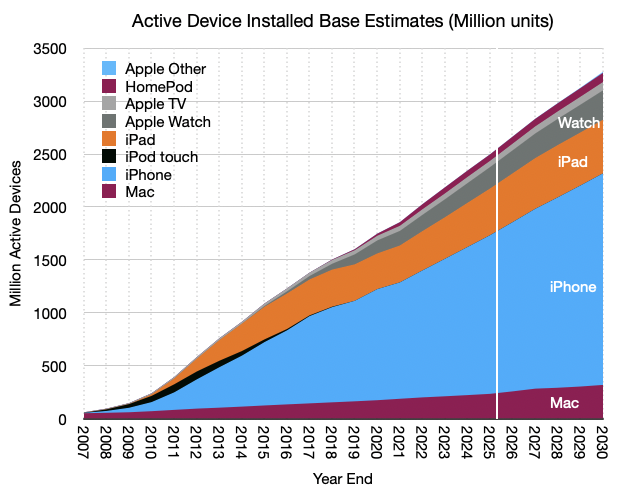
The forecast is shown in the graph and table below. The model predicts about 3.2 billion active devices by 2030.
| Year | Mac | iPhone | iPod touch | iPad | Apple Watch | Apple TV | Home Pod | Apple Other |
| 2007 | 50 | 4 | 5 | |||||
| 2008 | 54 | 17 | 15 | 7 | ||||
| 2009 | 59 | 42 | 35 | 9 | ||||
| 2010 | 69 | 86 | 59 | 15 | 10 | |||
| 2011 | 82 | 166 | 76 | 55 | 13 | |||
| 2012 | 93 | 276 | 75 | 121 | 15 | |||
| 2013 | 102 | 382 | 61 | 195 | 17 | |||
| 2014 | 112 | 482 | 43 | 259 | 18 | |||
| 2015 | 123 | 599 | 26 | 308 | 8 | 22.49 | ||
| 2016 | 133 | 700 | 13 | 336 | 20 | 27.135 | ||
| 2017 | 143 | 825 | 7 | 339 | 33 | 31.36 | ||
| 2018 | 153 | 900 | 5 | 350 | 56 | 35.67 | 4.2 | |
| 2019 | 162 | 950 | 345 | 95 | 38.85 | 10.1 | ||
| 2020 | 173 | 1050 | 338 | 123 | 43.865 | 19.9 | ||
| 2021 | 186 | 1100 | 349 | 138 | 47.84 | 34.7 | ||
| 2022 | 200 | 1200 | 372 | 154 | 52.305 | 48.3 | ||
| 2023 | 210 | 1300 | 393 | 170 | 54.91 | 57.8 | ||
| 2024 | 221 | 1400 | 418 | 187 | 57.75 | 60.6 | 0.2 | |
| 2025 | 233 | 1500 | 442 | 203 | 58.5 | 61.75 | 0.5 | |
| 2026 | 257 | 1600 | 462 | 218 | 62.5 | 66.75 | 0.7 | |
| 2027 | 282 | 1700 | 480 | 233 | 66.5 | 71.75 | 1 | |
| 2028 | 291 | 1800 | 495 | 248 | 70.5 | 76.75 | 2 | |
| 2029 | 302 | 1900 | 502 | 263 | 74.5 | 81.75 | 4 | |
| 2030 | 317 | 2000 | 507 | 278 | 78.5 | 86.75 | 10 |
By 2030 the iPhone will be about 60%, Mac 10%, iPad 15%, Wearables 10% and Home products about 5%. The difference from 2025 will not be great. The iPhone today is about 60%, Mac is 9%, iPad 18%, Wearables 9% and Home 4%.
The revenue impact in the growth of this ecosystem can be computed. Although we have a figure in terms average revenue per device, looking at individual products allows a more precise view. For instance, revenue per Mac per year vs. revenue per Watch per year can be now separated.
That will all be forthcoming.
This is a future five years away. Is this growth rate and consistency in mix a reasonable assumption?
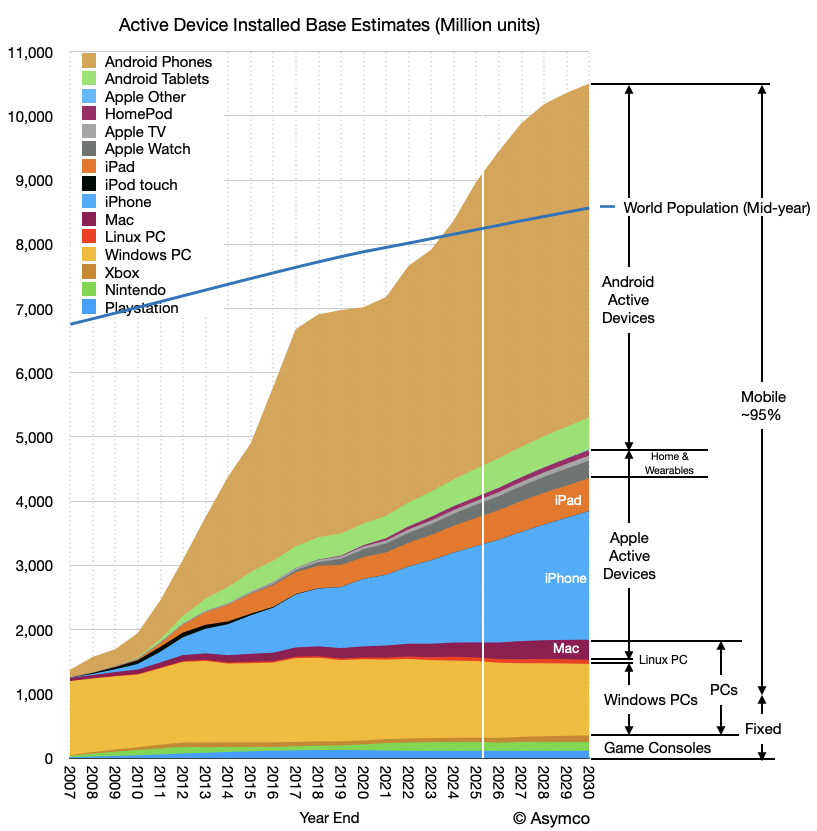
To answer, we should zoom out and look at not just Apple's device base. The following graph shows also Android phones and tablets, Windows, Linux (PC) and Game Consoles.1 It contrasts mobile and "non-mobile" computing and shows the total global population (blue line).
I have several observations:
- The total device population now exceeds the total human population. The total number of phone lines was already higher for some time2 but what are shown here are "computers" insofar as they have CPUs and operating systems that can run third-party apps.
- Given the device count exceeds human count, how much higher can this total go? The forecast shows a slowing of growth within the next five years but this is not a certainty. The attach rate of devices/person could well exceed 1.2 to 1.3 and go to levels seen in wealthy countries (above 2.) If that is the case then the device total may exceed 16 billion at saturation. This has implications for how far current strategies and business models can run.
- The composition of device types is fairly constant and form factor substitution is rare. New categories beyond phones and current wearables are hard to anticipate but even if they emerge, the evidence suggests they are additive. Evidently the phone did not so much displace the PC but build on top of it. The potential for wearables and home devices to explode is there but it's hard to image these stealing "share of pocket" any more than phones stole "share of desk or share of backpack". If they do explode, they will add to the total via higher attach rates. 3x human population (24 billion) is possible with new wearables and home3.
- AI holds many promises but how AI is accessed is not necessarily requiring of or benefiting from new device types. The smartphone is still the best AI device imaginable4. Ambient or passive computing can be provided by existing wearables but, as the graph shows, these are augmentative to phones. If AI introduces a completely new form factor, the impact will take decades to diffuse. As the graph shows, the mobile era is now approaching 20 years with the next five years foreseeable with some confidence. The next 15 years will be discussed in a future post.
- Android typically captures non-consumers who eventually churn into Apple devices. This means that as long as non-consumption exists, Android grows and as long as Android exists Apple grows. If and when Android growth stops then the dynamics will change and Apple might change strategy to accelerate churn.5
- Google and Apple will be the primary distributors for all software and services into the foreseeable future. Try as they might, challengers face over 9 billion in installed base. Note well how entrenched Windows has been on the desktop even as (free) Linux and (better) macOS alternatives have harvested usage. This rigidity has held over the 1.5 billion addressable market for 30 years now. For additional evidence consider the dynamics, or lack thereof, of the game console business.
- It excludes servers and early phone platforms such as Symbian, Blackberry and Linux phones.
- According to ITU Facts and Figures 2024, there were 112 mobile-cellular subscriptions per 100 inhabitants globally in 2024
- Households are 1/3 human population and vehicles are only about 1/7 so Home and Automotive don't move the needle much.
- AI is, if anything, putting the "smart" back in "smartphone".
- This might be what is happening with the Mac Neo, decades after the PC market saturated. Perhaps pieces have finally fallen into place but apart from Chromebooks, it's been very difficult to challenge the Windows PC head-on. (Though the iPad was possibly designed to displace some of the PC usage, it hit mainly with non-consuming very young or very old and PC use was unaffected.)
—
Join me for a live discussion of this research and more at Asymco Office Hours Live Q&A on Friday, May 1, 2026.
8 comments
deemery ·
In the last graph, where are Chromebooks?
AAPL ·
Is there any information on device count for Windows on Arm vs. Windows on x86? I assume it's uptake is slow due to legacy software not being compatible. Makes me think the timing for the introduction of Mac Neo is ideal to make inroads against Windows on x86.
vhs ·
Looking at the very straight line on the graph, I am starting to wonder where the sigmoid curve went? Am I missing something, and if so, what?
Horace Dediu ·
Not included at this resolution. Global shipments of new Chromebooks were approximately 22.11 million units in 2025. Install base is probably 40 million. For scale, the Linux portion is 60 million. You can assume they are included in the total for Windows.
Horace Dediu ·
The Windows on ARM is not tracked separately by the PC market researchers I see cited. I don't see much relevance in the distinction. The Neo was bound to happen once the A series became good enough. At this point the march against Windows is well under way but the time it will take will be measured in decades.
Horace Dediu ·
The adoption curves for individual categories like "smartphones" or "tablets" are logistic (sigmoid) but the combined sum of all "device" categories may not be. Furthermore, as competition transfers users from one competitor to another, individual competitor curves within a technology adoption may exhibit different curve shapes. Early data from market analysis showed that iPhone grew linearly while the smartphone market (in the US) grew logistically. The linear nature of Apple device adoption is also mirrored in subscriptions data that Apple has shared in the past.
deemery ·
So they're "in the noise" :-) Thanks!
deemery ·
Thinking about this a bit more.... I'd be inclined to consider Chromebooks in the "Android Tablets" category. Chrome is much closer to Android than Windows, both technically and managerially. And Android is being used as a host operating system for a lot of devices that are not consumer phones & tablets.