Asymco

Asymmetric Intelligence

Horace Dediu

  1. At $2.9bn/yr apps are challenging songs as the most valuable online medium

    Research · 16 comments

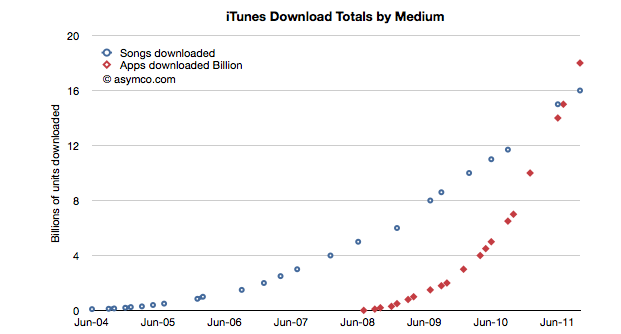
    During the October iPhone event Apple gave an update on the app and song download totals. This is a reliable gauge of the iTunes ecosystem performance and Apple has been supplying these numbers for several years.  Plotting these numbers gives us a good idea of the trend in mobile content consumption. Here is the data to date:

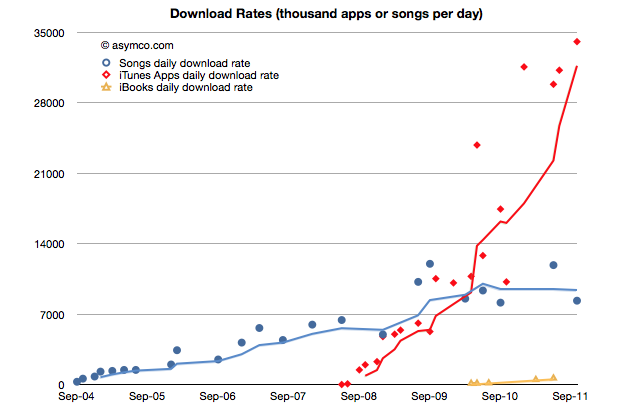
    The total number of apps downloaded (excluding updates) overtook songs in June/July and continues on its trajectory. In fact, the rate of downloads for Apps is now over 1 billion / month. Given the data points above, I calculate it to be about 34 million per day. The corresponding rate for songs is 8.3 million per day.

    You can see the rate of downloads as it's changed over time here:

    I used trailing four periods' moving average for the lines to show the trend more clearly. The gap in download rates is large and increasing.

    Now most observers would note that songs are much more expensive than apps, especially since there are no free songs and many apps are free. This would imply that the music business is probably more valuable than the app business.

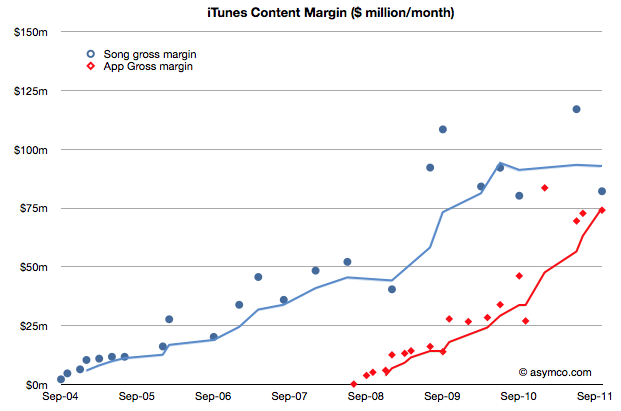
    That's true, but not by much. To determine how much, I used the other data point offered: $3 billion in payments to developers. Since that represents 70% of gross revenues to Apple, we can determine that the average price per app is now 23.8c (down from 28.5c in April 2009)[1]. Knowing the app price we can plot both revenues and the margin that Apple keeps.

    We can compare that with the margin that Apple keeps from songs (assuming a price point of $1.2 per song and a 73% pay-out to labels.)

    The data jumps around quite a bit but the trend is pretty clear. After paying the content owners, iTunes is left with about $75 million per month from apps and $85 million per month from songs.

    Apple then needs to pay other direct costs like credit card processing, bandwidth, storage, curation and testing. Then there are other operating expenses like R&D and marketing. These costs add up such that, according to Apple, they cover revenues, yielding a break-even operation.

    Break-even or not, the way the data is trending it's pretty clear that Apps will be responsible for a the majority of content cash flow at Apple.

    At a billion downloads a month (and rising) the value in terms of revenues is already a run rate of $2.9 billion per year. This has been enough to overtake a business that has been running for more than seven years.

    ---

    Notes:

    1. The payments to developers probably includes in-app purchases.
  2. Why is there no iPhone 5?

    Research · 243 comments

    I've been asked what will be the effect on the market of the iPhone 4S. Actually the question was what would be the effect on the market of there being no iPhone 5.

    I'd answer that the iPhone 4S is a product designed to compete for two markets: (1) half the current iPhone users who bought a phone prior to the iPhone 4 and (2) non-iPhone users, typically non-smartphone users.

    I'll describe each market briefly.

    The current iPhone users

    Tim Cook said that half of all iPhones sold to date have been iPhone 4's. That means that about 70 million iPhone 4's have been sold. Those are not a target market because of three reasons:

    1. The vast majority of those users are still paying for their iPhone 4 through the subsidy model used to sell them and to change phones today would incur a cash penalty.
    2. Customer satisfaction surveys show that they have 90%+ satisfaction rating for their iPhone 4 and we can therefore assume that they are not looking for something better
    3. Their iPhones are practically new and they still work and are upgradeable.

    The other 70 million or so iPhone users have either a 3GS or a 3G iPhone. These are a very different market for three reasons:

    1. They have already paid off their iPhones. They would not face any extra costs in switching to a new iPhone
    2. Earlier customer satisfaction surveys showed that they once had 90%+ satisfaction with their product so they are likely to stay with the brand.
    3. Their iPhones are getting old and beaten up after two years of use.

    The current non-iPhone non-smartphone users

    This market is so vast that it's practically infinite. Over 1.5 billion phones are sold each year and Apple only has about 5% share. Therefore there is a vast pool of users who probably have been interested in getting an iPhone. These potential buyers will find the iPhone 4S an attractive alternative to buying a non-smart phone. They will also notice that there is now a range of price points for various iPhone models starting as low as zero.

    Current non-iPhone smartphone users

    I'll add this market to complete the picture. This market is similar to the current iPhone 4 market because, except for Blackberry, most smartphones have been purchased in the last 12 months. This is especially true for Android phones. These owners of smartphones are unlikely to be interested in switching a phone that is "brand new" unless they have a very poor satisfaction with it. If they are not satisfied, there are many options, and iPhone is one of them. There are too many conditionals in this market and I therefore don't think it's a good target for the iPhone 4S.

    So What are the prospects for the iPhone 4S (and other iPhones)?

    The market for the new iPhones could then be summarized as follows: 70 million early generation iPhone users who are eager to upgrade (with 90% probability) plus a subset of a billion buyers of new phones next year who are looking for their first smartphone. These two markets iPhone 4S is targeting are "easy" because the competition is weak. It's either "don't upgrade my old iPhone" or "buy a dumb phone or another smartphone for almost the same price as an iPhone".

    I don't see the result for units sold being different if there was a hypothetical iPhone 5 vs. the current iPhone 4S (and 4 and 3GS as a portfolio). In fact, a "better" iPhone would not be better at winning this competitive battle because the bar is so low.

    So to answer the question in the headline: because an iPhone 5 is not needed meaning that it would over-serve the market and price itself out of contention.

    The question will be very different a year from now when most early Android buyers will be looking for a new phone and when most iPhone 4 users (all 70 million of them) will be looking for a new iPhone. That would seem like a good time to introduce a new iPhone "5".

  3. Let's talk 'Let's talk iPhone' on 5by5.tv

    Podcast · 58 comments

    Thirty minutes after the end of the 'Let's talk iPhone' event, 5by5.tv will be hosting a set of commentators[1] giving initial impressions of announcements.

    "Tune-in" at http://5by5.tv/live

    I'll update this post with a link for the download once available.

    [UPDATE]

    Dan Benjamin talks about Apple’s “Let’s Talk iPhone” event with Dan Moren, Marco Arment, John Siracusa, John Gruber, Horace Dediu, Arnold Kim, and Christina Warren. Topics include the iPhone 4S hardware and form factor, the iOS update, the “geek letdown”, Siri, iPods, pricing, release dates, AppleCare, carriers, serious stats, iCloud and iTunes Match, the non-geek response, and more.

    Download the episode here.

    ---

    1.  @marcoarment @asymco @arnoldkim @dmoren (@gruber & @jsnell if avail)
  4. Sprint's gamble

    Research · 62 comments

    The Wall Street Journal reported that Sprint Nextel made a "multibillion-dollar" gamble on the iPhone. This is based on information that Sprint committed to buy 30.5 million iPhones over the next four years.

    Wall Street Journal reporters calculated that the deal is worth around $20 billion on the basis of iPhone ASP during the last quarter (about $650). That Sprint would get that price is possible but not necessarily correct as there is likely to be some discount and the ASP Apple receives includes accessories.

    But the "gamble" is more than the deal value. The way it's being reported is that Sprint bet the company on being able to sell this many iPhones. So naturally we have to ask: how hard can it be to sell 31 million iPhones?

    First, note that the order is over a four year period. It's also not likely to be linear, with volumes accelerating over time. If I estimate a ramp where in year one the commitment is for 4 million, year two 6, year three 9 and year four 12 million we get a total of 31 million. Can Sprint sell this volume?

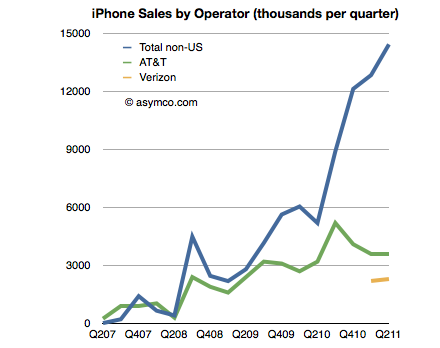
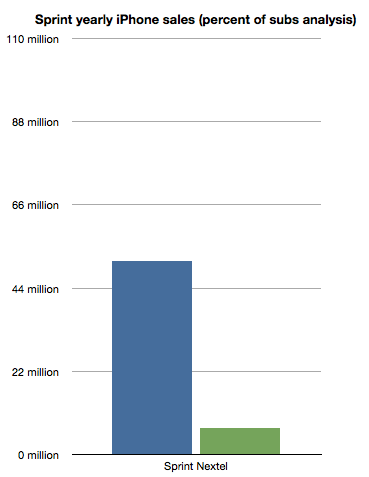
    To get an idea we can look at the sales rates for the other US operators. I built a table of iPhone sales by Operator last July. The data is shown in the following chart:

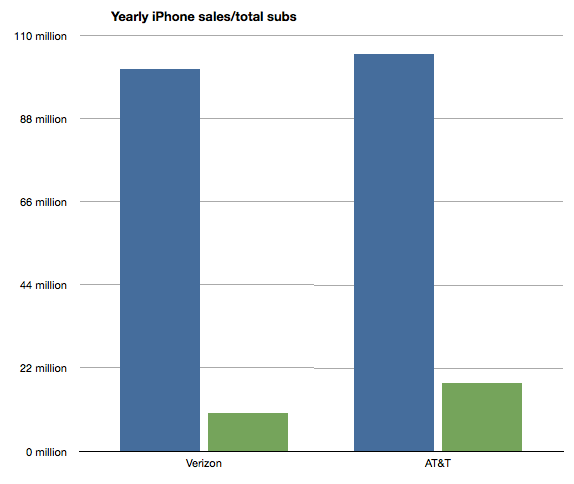
    What is interesting is to see the number of iPhones sold in a given time frame as a percent of subscriber base. I chose to measure a year's worth of iPhones where I extrapolated Verizon's volumes from the six months reported so far.

    The ratios are that Verizon sold iPhones at the rate of about "10% of its subscriber base per year". AT&T has been selling at the rate of about "17% of its subs per year". If we average these two we get about 13.6%.

    So if we assume that Sprint can sell iPhones at about the same rate as Verizon or AT&T (as a percent of their user base which was 51.1 million) we get about 7 million iPhones per year.

    That's right in the middle of the range it needs to get to 31 in four years [4,6,9,12]. I charted the projection on the following chart:

    So the gamble Sprint is taking is that they will be able to sell iPhones at the same rate as Verizon and AT&T.

    How is this risky?

    The deal seems to be inline with what is known about the product's popularity and the pattern of purchasing and upgrades that US consumers have been exhibiting for a few years.

    As with AT&T and Verizon, volumes ramp up over time. As with AT&T, users are loyal and they upgrade regularly. As with Verizon, there is competition from Android and Blackberry. As with both, payment is expected up-front with payback over the duration of contract length. As with the others, there will be incentives to keep churn down.

    If anything the riskiest thing for Sprint would have been not to do the deal at all. Indeed, we'll get to see the effect of that option on T-Mobile.

  5. iOS vs. Microsoft: Comparing the bottom lines

    Research · 60 comments

    I began comparing Microsoft and Apple's financial performance with a review of "top line" or revenues by product lines over a four year period.

    This post is about the "bottom line" for the same companies and products.

    Before I jump in I would like to make sure there is no confusion about the terms. I will be comparing "operating income"[1] as a measure of "bottom line". This is a common way to compare the profitability of companies because it excludes taxes and interest income. These non-operating expenses/income can distort a comparison of performance because they can be the result of investment activity or changes in tax law or where the company is domiciled. One should not make judgements of comparative performance on those non-operational bases.[2]

    Another challenge is that some companies report operating income by division while others don't. We can usually compare overall operating income but usually not on a division or product-level. This is the challenge I will try to overcome in this analysis between two very different operating models.

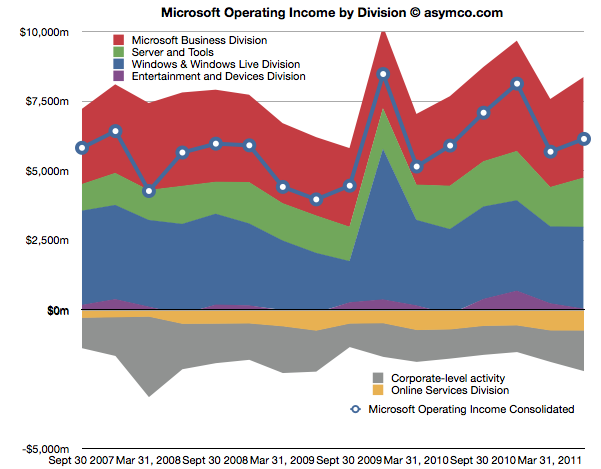
    The first chart shows Microsoft's Operating Income by Division as reported by the company.

    Each area represents a business division. Note some are showing negative income (losses).I've added a line representing consolidated operating income which is the sum of all areas (including the negatives).

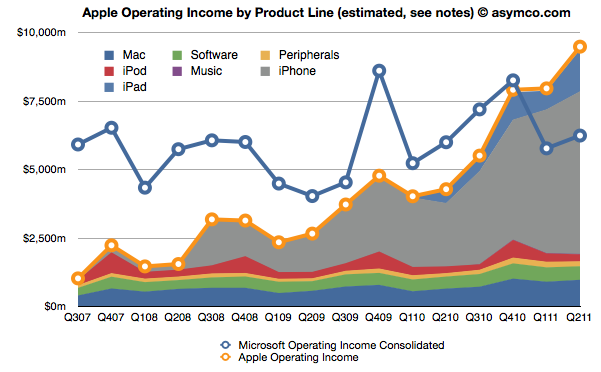
    The same line from the chart above is super-imposed on the chart below and is comparable to the orange line that represents the operating income that Apple was able to obtain over the same time frame. Note that both axes are using the same scale.

    The Blue and Orange lines are indisputable but the allocation of the areas under the orange line may be open to debate.

    As Apple does not report a break-down of each product line or division, getting the areas in the Apple chart is a matter of analysis and estimation. The method I used was to estimate gross margins per product (the overall gross margin is known) and assigning a portion of OPEX (also known) in a ratio equal to the sales level of that product. [3][4]

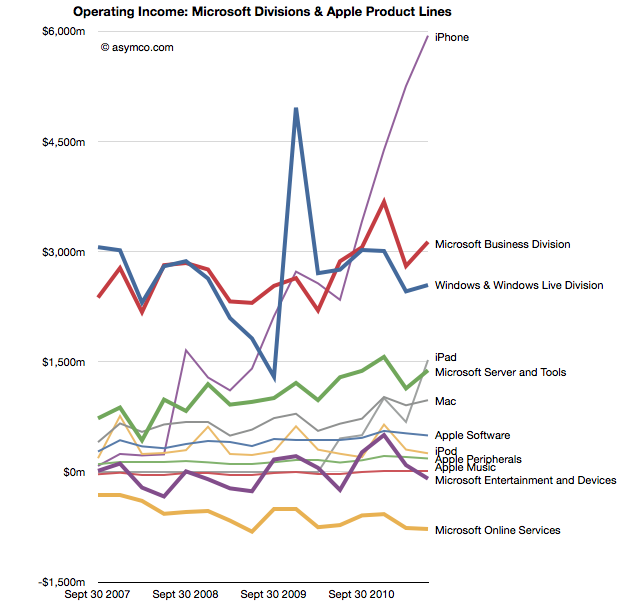
    To make the contrast sharper (though more cluttered), I took all operating incomes from all product lines and divisions of both companies and laid them out as time series line charts in the following chart. I allocated Corporate Level Activity as an expense proportionate to each business unit in a ratio proportional to its sales. This allows comparison of product lines individually.


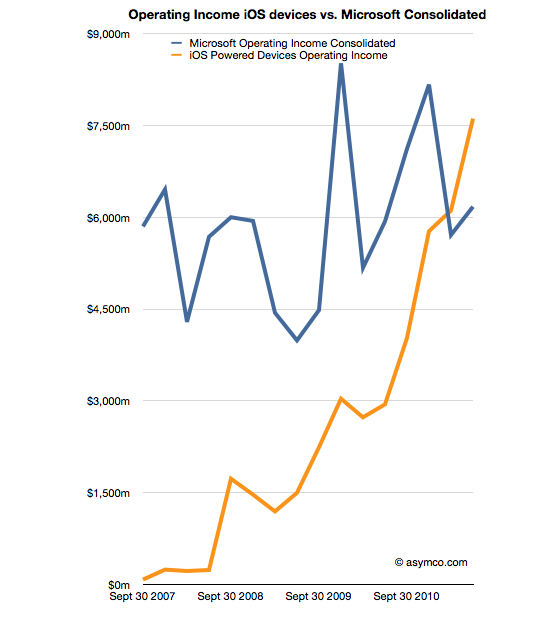
    Finally, I combined all the iOS product lines (iPhone, iPad and iPod touch est.) as one line and laid it alongside overall Microsoft Operating Income (consolidated).

    The second chart in this post showed that Apple has reached higher operational profitability than Microsoft by the end of last year. This fourth chart shows that iOS products combined are more profitable than Microsoft as a whole.

    Microsoft invented the software business and built it to become the world's most valuable business by the year 2000. It's still been growing since and after 35 years it is reaching a profit of $27 billion per year. It did this while maintaining enormous margins and a highly disruptive monopoly business model the likes of which the world had never seen before.

    It is scarcely believable then that a device business has been created to overtake it in four years.

    ---

    Notes:

    1. The operating income is almost the same as EBIT  which is explained here: Earnings before interest and taxes - Wikipedia, the free encyclopedia.
    2. On the other hand, one should not use Gross Margins alone. The crucial difference between Gross Margin (Sales Revenue - Cost of Goods Sold or COGS) and Operating Income is that fixed costs are also accounted for. These fixed costs are typically Selling, General and Administrative Expenses and Research and Development Expenses (commonly summarized as Operational Expenses or OPEX) which can be allocated to a particular business or division. For different business models, gross margins can be widely different. In the case of Microsoft for example, software has negligible direct variable costs. A CD or download is of tiny cost compared to the price of the license to use it. As a result software often has 80% gross margins. Hardware on the other hand can have very thin margins in single digits (e.g. PCs). Conversely, Microsoft will have very high fixed costs to pay for developers, product management and sales forces. A hardware vendor may have few engineers and sales could be handled through resellers. Thus Microsoft will have very high OPEX and a PC company will have very low OPEX.
    3. So, for example, In Q2 '11 the iPad had an estimated gross margin of $2.06 billion (which assumed 34% margin on published revenues of $6.06bn). As it also was 21% of total revenues that quarter, I assigned 21% of OPEX to the iPad. That means 21% of $2.54bn or $540 million was the operational expense allocated to the iPad. This results in operational income estimate of $1.52bn for the iPad in Q2.
    4. To summarize, the assumptions this estimate depends on are gross margin estimates and the allocation of OPEX in proportion to sales. Gross margin analysis has been a matter of iteration and peer review for some time and I'm fairly confident in my estimates. The allocation of OPEX is more arbitrary. Chances are that these expenses vary greatly with each quarter where more work is done nearer to launch of a new product and less in late season. If there are better methods available to allocate expenses by product, I'm open to suggestion.
  6. The case against the Kindle as a low end tablet disruption

    Research · 232 comments

    In an Harvard Business Review post Rob Wheeler makes the case for the Kindle Fire as a disruptive innovation. I believe that it is but crucially I disagree that the Kindle Fire is a low end disruption.

    My assessment of the Kindle Fire is based on the two attributes which Amazon highlights as the key selling points which offer a basis of differentiation and potential for asymmetric competition: a low price and a new browsing model. I believe that these two attributes result in two opportunities: one for low end disruption and another of new market disruption. I reject the first and tentatively support the second.[1]

    The price

    It's immediately obvious that the price point of the Kindle Fire is well below alternatives. That forms the basis of disruptive potential, but before we jump to analyzing the disruption hypothesis we should determine whether and to what extent Amazon profits from the device directly. Profitability gives us a clue to where Amazon will apply resources and thus establish its trajectory of improvement.

    We know the margin on the Fire is low because we can calculate the bill of materials for 7" tablets. Gene Munster of Piper Jaffray estimates that Amazon "loses" $50 for each unit sold. We also know that the design Amazon used is essentially very similar to the RIM PlayBook and was sourced from the same ODM. RIM priced the product at $499 but has struggled to find buyers and is reluctantly dropping the price. We also can estimate that Apple with a product having more than twice the screen size is keeping modest (~30%) gross margins for at a price point approximately double that of the Fire. It does seem that Amazon does not have much or any margin to dip into.[2]

    So the Fire can be classified as a low price product. Does that make it a low end disruption?

    Disruption requires asymmetry but it also requires the ability to go up a trajectory of improvement along the basis of performance that a majority of users demand. The first condition is met, but what of the second? In a combined system where one asset is used to leverage another--the subsidized being sacrificed to benefit the profitable--success is conditional on one element being "good enough" while the other "needing improvement". Investment follows accordingly.

    But investment decisions have consequences. The subsidized device is starved of investment while the profitable service is nurtured. We see evidence of short cuts in investment in the off-the-shelf nature of Kindle products: from a second-hand (unsanctioned) OS to a second-hand (ex-RIM) hardware. Meanwhile, Amazon spends heavily on capex for the infrastructure that delivers the profitable content.

    If the hardware is indeed commoditized and cannot be usefully improved, then this model works. If, on the other hand, the hardware and systems software can benefit from dramatic improvements in technology then the model fails. The very asymmetry of a service vs. a product turns into the latter having all the advantages and the former failing to gain traction.

    I'll give three examples of this how service model creates limitations which lead to a failure to disrupt a product model.

    The Game Consoles

    The first is the game console business. In consoles, the vendors maintain long hardware product life-cycles to recover their hardware investment and subsidy by maximizing the number of games attached to each console. If you plot product cycles you realize that the bigger the subsidy, the longer the hardware lifecycle. The result is a very wide turning circle which prevents innovation in new dimensions.

    Consider that the Playstation or the Xbox could have been a low end computing disruption. The original Xbox was in fact a PC. It was supposed to bring PC dynamism to the console business and create a cottage industry of new developers building games on commoditized hardware. However by the second generation the Xbox was a locked down, custom architecture, pure gaming machine. Gone was Intel, gone was the PC architecture and gone was any dream of cheap development.

    This is entirely due to the economics of subsidized hardware. It compelled Microsoft, the world's greatest software company, built on the open and cheap PC architecture to make closed, expensive hardware. Sony followed in kind as did Nintendo. Each generation of consoles was a sustaining improvement on gaming and had no ambition beyond gaming[3]. The subsidy and the dependence on an integrated content value network led to a distinct lack of disruption and an insular industry which continues to seek out increasingly immersive experiences for increasingly demanding customers while itself being disrupted by casual, mobile gaming.

    The Set-top boxes

    The second example is the TV set-top box business. There again, the vendors maintain long hardware cycles in order to recover subsides. There too, the main value driver is the content and its distribution which stipulates the architecture, and through subsidy, defines its evolution. This offers the vendor no motivation to improve the user experience[4], secondary uses or the absorption of new streams of content (like those the internet can offer.)

    Again, the set-top box could have been a budding disruptive opportunity for Microsoft. They invested billions in the 1990s to acquire placement of software on set-top boxes in an attempt to penetrate the living room. And again Microsoft was not alone. Since then Tivo, Google and Apple and many others tried to attach cheap hardware to video streams. They all failed to get on a disruptive trajectory. And again, the blame can be placed on the stifling effect of subsidies and dependencies on services or content which dictate where the value and hence the investments should go.

    The Blackberry

    The third example is the RIM Blackberry. Although RIM made most of its money on hardware and was by no means subsidizing it, the differentiation of their product was undoubtedly its service value. Both as a corporate device with BES and as a consumer device with BBS, customers "hired" the product as a service. By being committed to this model RIM management became blind to the hardware and client OS software innovations coming down the pike.

    Through their own admission, they could not accept a touch screen because it would make the messaging experience too slow and it is messaging that sells Blackberries. They could not accept apps (and hence platform orchestration) as a differentiation because their customers did not hire Blackberries for "lifestyle apps". Merely being differentiated as a service leads to blindness and enough hesitation that you run off the disruptive rails.

    People ascribe myopia or incredible absence of mind to RIM's management but the opposite is true. They were deeply committed and observant of the things which made the Blackberry successful. It just happened to be something that stopped being relevant.

    The iPhone

    I'll add one more "bonus" example on this. The iPhone is also a subsidized product and it seems very successful. How come it won? The answer is in details. As I mentioned, the other products ended up in poor life cycles or incorrect motivations. The iPhone differs in that the lifecycle of the product is much shorter (2 years ownership with 1 year for product updates). The shorter lifecycle works for the iPhone because it has a very high service revenue base to dip into to offset the subsidy. Something none of the content models above could count on.

    Consider that each game console subsidy needs to paid off by a handful of game titles whose royalties to the console maker are modest. Or that the TV box needs to ride on top a service that also has thin margins from a stable or slightly shrinking user base. In contrast, the iPhone enables vast new consumption worth thousands of dollars to the operator. This is the famous ARPU uplift that smart phones enable. Users are doubling their telecom spending when they move to smartphones.

    The margins for Kindle content are thin. Very thin. Apple runs its content business at break even though it transacts billions of items per month. The amount of content that needs to pass through the Kindle ecosystem (with lower prices than Apple charges) will need to be astronomical to make it profitable on the shortened cycle time the iPhone enjoys. Thus the Kindle is likely to languish in a leisurely update cycle with users encouraged to hang on to their devices for years. This is the case at least with the original e-Ink Kindles. How eagerly awaited are new generations? How many users stampede to update the hardware or even upgrade the software? How many users have owned every version of the Kindle?

    Service Scale

    Finally one last point about services. As Amazon asserts, they see Kindle as a service, which, I concede, is asymmetric to a product business. The problem is that services don't scale as well as products. Consider that none of the content streams that Amazon will depend on are available outside the US. The Kindle has not been a strong seller internationally. This is because book rights are limited to national boundaries as are movie rights and song rights. Apple has only this week finally completed the rollout of iTunes music to all of Europe! A process that took almost a decade. And they are still unable to sell music in most of Asia and forget about movies or TV shows.[5]

    The reality is that there are no global service brands. Not in telecommunications (operators are, at best, regional), not in Media (TV, radio, publishing are a local businesses), not in Banking (not even in commercial banking) and not in Retail (even Wal-Mart was humbled trying to export its disruption). The internet has not broken down any of these boundaries and even Amazon has modest reach outside the US for any of their franchises. Services are local but products can be global.[6]

    To wrap up, this discussion on the asymmetry of device-based services to product models leads me to conclude that the Fire will not have the opportunity to disrupt the iPad or tablets in general. Amazon sees the hardware and software of a device as a commodity and the content and its distribution as valuable. This assumes that the device is "good enough" and will not require deep re-architecting or that new input methods can be easily absorbed. In short, they see the tablet as at the end of its evolutionary path. Apple sees the exact opposite. The iPad is 18 months old, and as they say in the ads, they see it as only the beginning.

    ---

    Notes:

    1. Due to length of discussion, in this post I will make the case against the low end disruptive potential and use a second post to make the case for it being a new market disruption.
    2. Presumably, Amazon will also distribute only through Amazon.com and thus not incur channel mark-ups. This means that comparisons with other tablets should be at a price nearer to 70% of retail.
    3. Gaming networks and video streaming are extensions but neither leveraged open architectures.
    4. See also discussion from June 2010 on the challenges to Apple TV that Steve Jobs enumerated.
    5. Apps are another story. Because it controls the medium, Apple can and does sell apps in every country where the iPhone or iPad or iPod touch is available.
    6. Note also that because of distribution through Amazon.com, the Kindle cannot reach as many buyers as a tablet selling through the tens of thousands of points of purchase that operators and retail shops offer.

     

  7. Comparing top lines: Apple vs. Microsoft

    Research · 97 comments

    I've been providing analysis of Apple's operating and financial performance for some time. Recently we've begun to look at comparisons of financial performance for comparable companies. Now it's time to dig deeper and do comparisons of operating performance as well.

    To start, Microsoft.

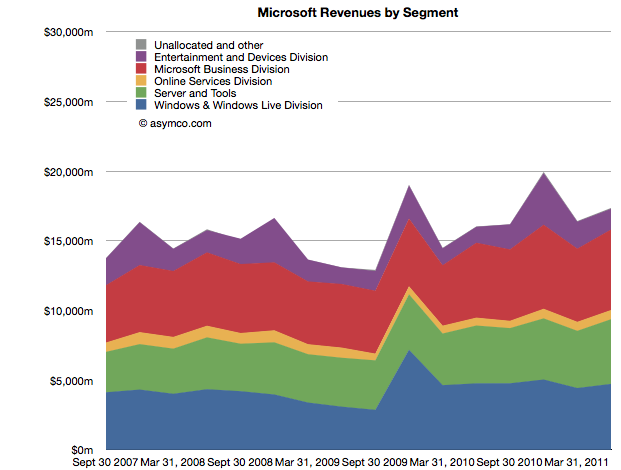
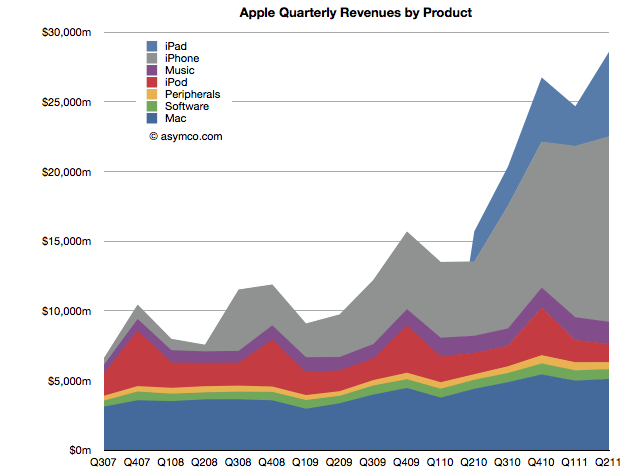
    Whereas Apple has product lines (iPhone, iPad, iPod, Mac, iTunes, Peripherals and Software), Microsoft has business divisions (Windows & Windows Live, Server and Tools, Online Services, Business (Office), Entertainment and Devices). The charts show revenues for both Apple and Microsoft according to these defined segments.


    The second chart should be a familiar one:

    Note that the horizontal and vertical axes are the same. The period of coverage is from mid-2007 to the end of June 2011 which corresponds to the life of the iPhone. The vertical axis ranges up to $30 billion/quarter in both charts.

    When shown this way, the exceptional growth for Apple becomes easier to understand (and perhaps Apple's valuation premium of 15.7 P/E vs. Microsoft's 9.5). Microsoft has been growing these past four years but not nearly at the rate of Apple. Microsoft grew quarterly revenues from the ~$15b range to ~$17b range.

    Additional points of interest:

    • The Mac business generates more Revenue than Windows
    • iOS powered devices generate more revenue than all of Microsoft's products put together
    • Apple's revenues grew 413% since Q2 2007 while Microsoft's grew 26%
    • The release of Windows 7 had a marked effect on revenues in the launch quarter but the sales did not seem to grow above the previous version's run rate ($4.2b/quarter vs. $4.7b/q on average).

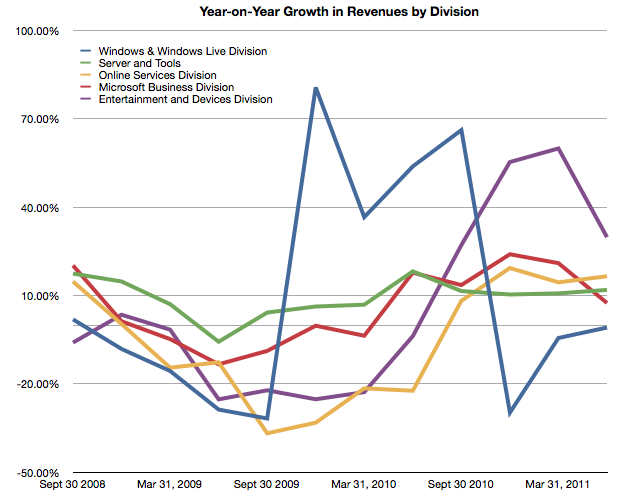
    But most importantly, whereas Apple's growth has come from new businesses (iPhone and iPad), Microsoft has organically grown existing businesses. The condemnation of leadership at Microsoft should hinge on the absence of significant top line growth. Note that neither the Online Services nor the Entertainment and Devices divisions had appreciable net growth.


  8. Visualizing the Steve Jobs era

    Research · 44 comments

    On October 4th, Tim Cook will take the stage at Apple’s fall event. With Steve Jobs’ transition to head the Board of Directors of Apple and after serving as CEO for fourteen years, it is time to take a look at his reign.

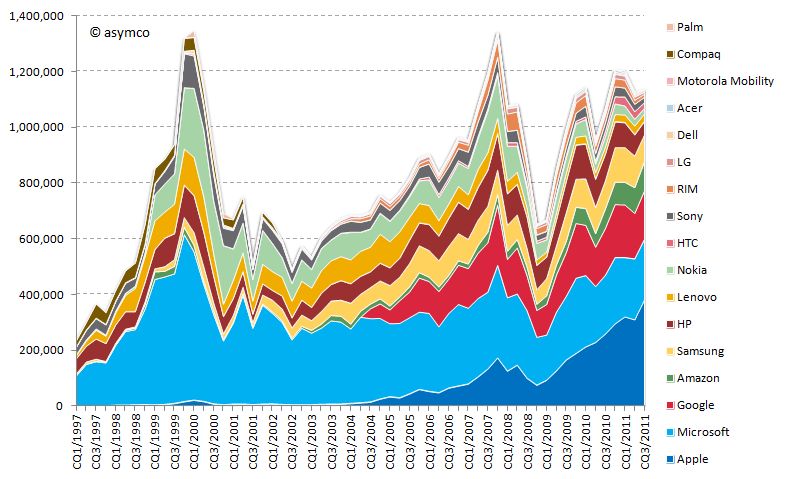
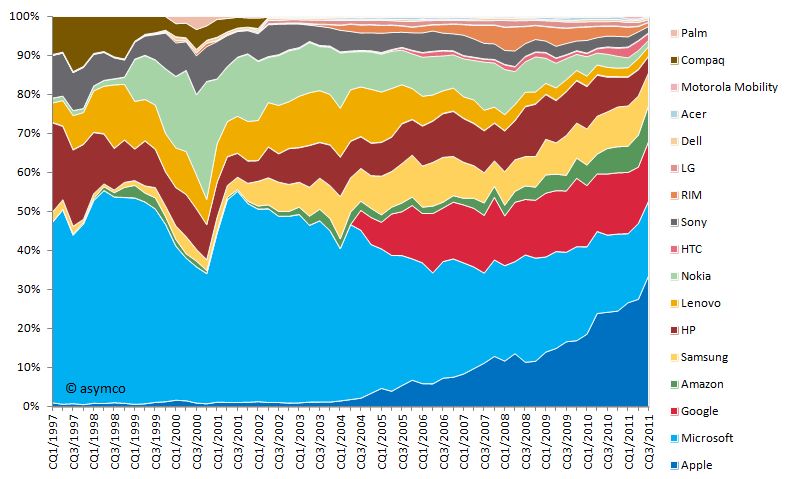
    Looking at his performance vs. peer companies from a capital market performance, I have composed the following two charts:

    Market capitalization of selected peer companies by calendar quarter in USD million sorted by most recent market capitalization (1997-2011)

    Market capitalization of selected peer companies in USD million sorted by recent market capitalization (1997-2010)

    Market capitalization as share of combined market capitalization by calendar quarter sorted by most recent market capitalization (1997-2011)

    Market capitalization as share of combined market capitalization sorted by recent market capitalization (1997-2010)

    You will note that I included more companies than in previous analysis. The new additions are:

    • Compaq (acquired by HP in 2002)
    • Palm (acquired by HP in 2010)
    • Amazon (a popular request by readers)

    I divided this era into three distinct periods:

    Restructuring of Apple 1997-2000

    In the beginning of 1997, Apple’s market capitalization was lower than almost all of its peers. In absolute terms the market capitalization moved only slightly upwards towards 1999 and the dent in 2000 is significantly lower compared to the market capitalization increase of other companies, first and foremost Microsoft's. Especially in the early part of this period restructuring and streamlining efforts took precedence. The introduction of iMac in 1998 and the iBook in 1999 set the tone in terms of design, quality and "thinking different" for many years to come.

    iTunes era 2001-2006

    With a stable core business and healthy profitability, Apple introduced the first iPod in October 2001 complementing the earlier introduced iTunes music player. Two years later, Apple introduced the iTunes Store offering downloadable music for the Mac and Windows operating systems. The venturing into the music and portable music player business and the halo effect for the Mac business is reflected in the market capitalization increasing significantly during the following years surpassing HP and Nokia.

    Mobile iOS devices 2007-2011

    Market capitalization further increased with the entry into the smart-phone market in 2007. Note that market capitalization of all selected companies combined at that time was as high as in the dot.com era of 2000. But this time Apple accounted for more than 10% of it. From 2008 to 2009 market capitalization of all companies declined severely due to the financial crisis. Rapid recovery followed during 2009 and early 2010. Apple introduced the iPad in March 2010 further fueling its rise to the top, surpassing Microsoft’s capitalization and topping Exxon Mobil as the world's most valuable listed company.

    During the time of Steve Jobs as CEO, Apple's market capitalization increased on average by 42% every year--an unprecedented track record. According to his own admission, Steve Jobs became CEO when Apple was 90 days away from bankruptcy. He resigned 14 years later after leading Apple to becoming the most valuable listed company in the world. From a value creation point of view, it's hard to think of a better performance from anyone, ever.

  9. When will Apple's share price reach $500?

    Research · 51 comments

    Apple's share price has recently hit a new all-time high, over $400 per share. As often happens there was no specific new information from the company to justify this increase. On the other hand there is usually no news to justify share price drops in Apple. In fact, the stock is up on what would be considered counter-indicative news: the resignation of a very important CEO.

    But readers may recall that there is a measure of performance for Apple we can turn to that seems to show strong correlation to its stock price. It's not income and it's not growth in income but it's the strength of the balance sheet.

    I demonstrated this relationship last May with a post titled The market values Apple’s balance sheet, not its income statement.

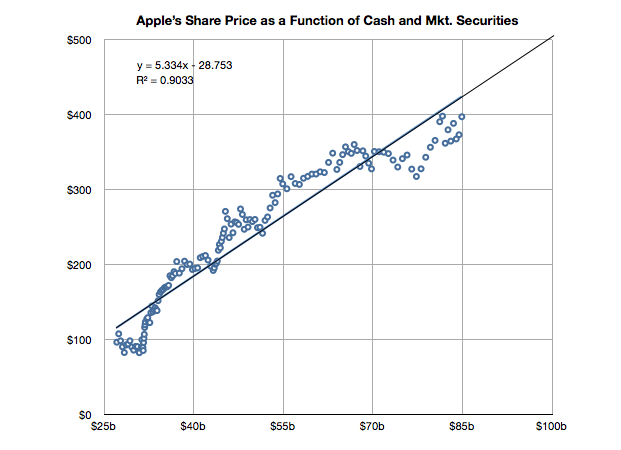
    It's time to look at the data again to see if the relationship still holds. I added the data for Q2 and made some estimate about the cash position since July 25th (we will know this data with more accuracy when Q3 data is reported in a few weeks).

    The slope of the line above has decreased slightly but a strong correlation can still be observed. The old r-squared was 0.94 and it is now 0.90. I included the formula for the y variable (share price) as a function of x (cash).

    If you plug in $100 for x you get about $500 for y. So if this relationship continues[1], the answer to the question in the title would be "When the cash and cash equivalents reach $100 billion."

    ----

    Note:

    1. Note that whether the relationship holds (which it very well may not) depends on a strong correlation and "strong" is not well defined. The correlation has weakened slightly in the last six months.