Asymco

Asymmetric Intelligence

Horace Dediu

  1. The $2 Trillion Economy

    Research

    The App Store ecosystem crossed $1 Trillion in 2022.

    To be precise, in a report published in May 2023 by the Analysis Group the ecosystem is estimated to have exceeded $1.1 trillion. This ecosystem is defined as the total transactional value of the sale or distribution of digital and physical goods and services through apps. It also includes in-app advertising. The analysts relied on a variety of data sources, including data from Apple, app analytics companies, market research firms, and individual companies.

    Note that this includes Apple's own services as well as App Store developers. Unlike Apple's own reporting of payments to developers (and thus partially revealing its own App Store revenues) this data includes payments which are not captured by Apple directly. In the words of the authors, "More than 90% of this figure originated from transactions that did not happen through the App Store, meaning that these amounts accrued solely to developers and other third parties, and that Apple collected no commission on them."

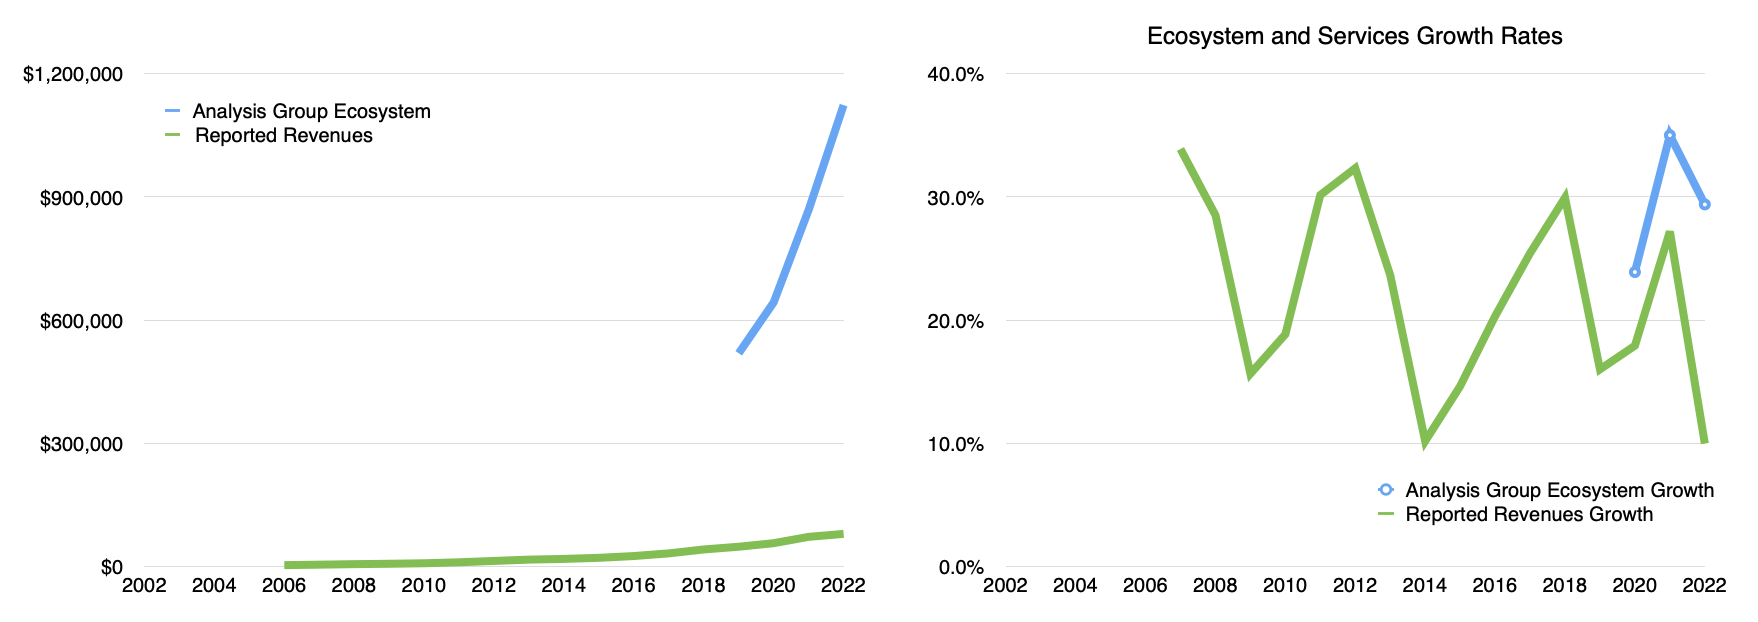
    This $1.1 trillion figure is almost double the value from 2019. Ecosystem estimates were first provided in 2019 at $519 billion, with $643 billion in 2020, $868 billion in 2021 and $1,123 billion in 2023. These correspond to growth rates of 24% in 2020, 35% in 2021 and 29% in 2022. The compound growth rate has been 29.4% since 2019.

    It would be ambitious to expect this CAGR to continue after the Covid boom but at the same time, it's worth noting that this growth out-paces Apple's own services growth rate. Services (reported) revenues grew at 18%, 27% and 10%. The actual figures and growth rates are shown below.
    This Analysis Group report is very much worth reading and adds an important new metric of resilience and scope and scale of the platform and ecosystem that Apple has created.

    However it is also not the complete picture. I strive to see the larger picture of what I call the Apple Economy. This includes the ecosystem as well as the direct revenues Apple obtains from products and services. [Of these revenues, roughly 60% is then passed on to Apple's suppliers, with less than 20% retained as earnings].

    Therefore, the combination of ecosystem and revenues is shown in the following diagram.
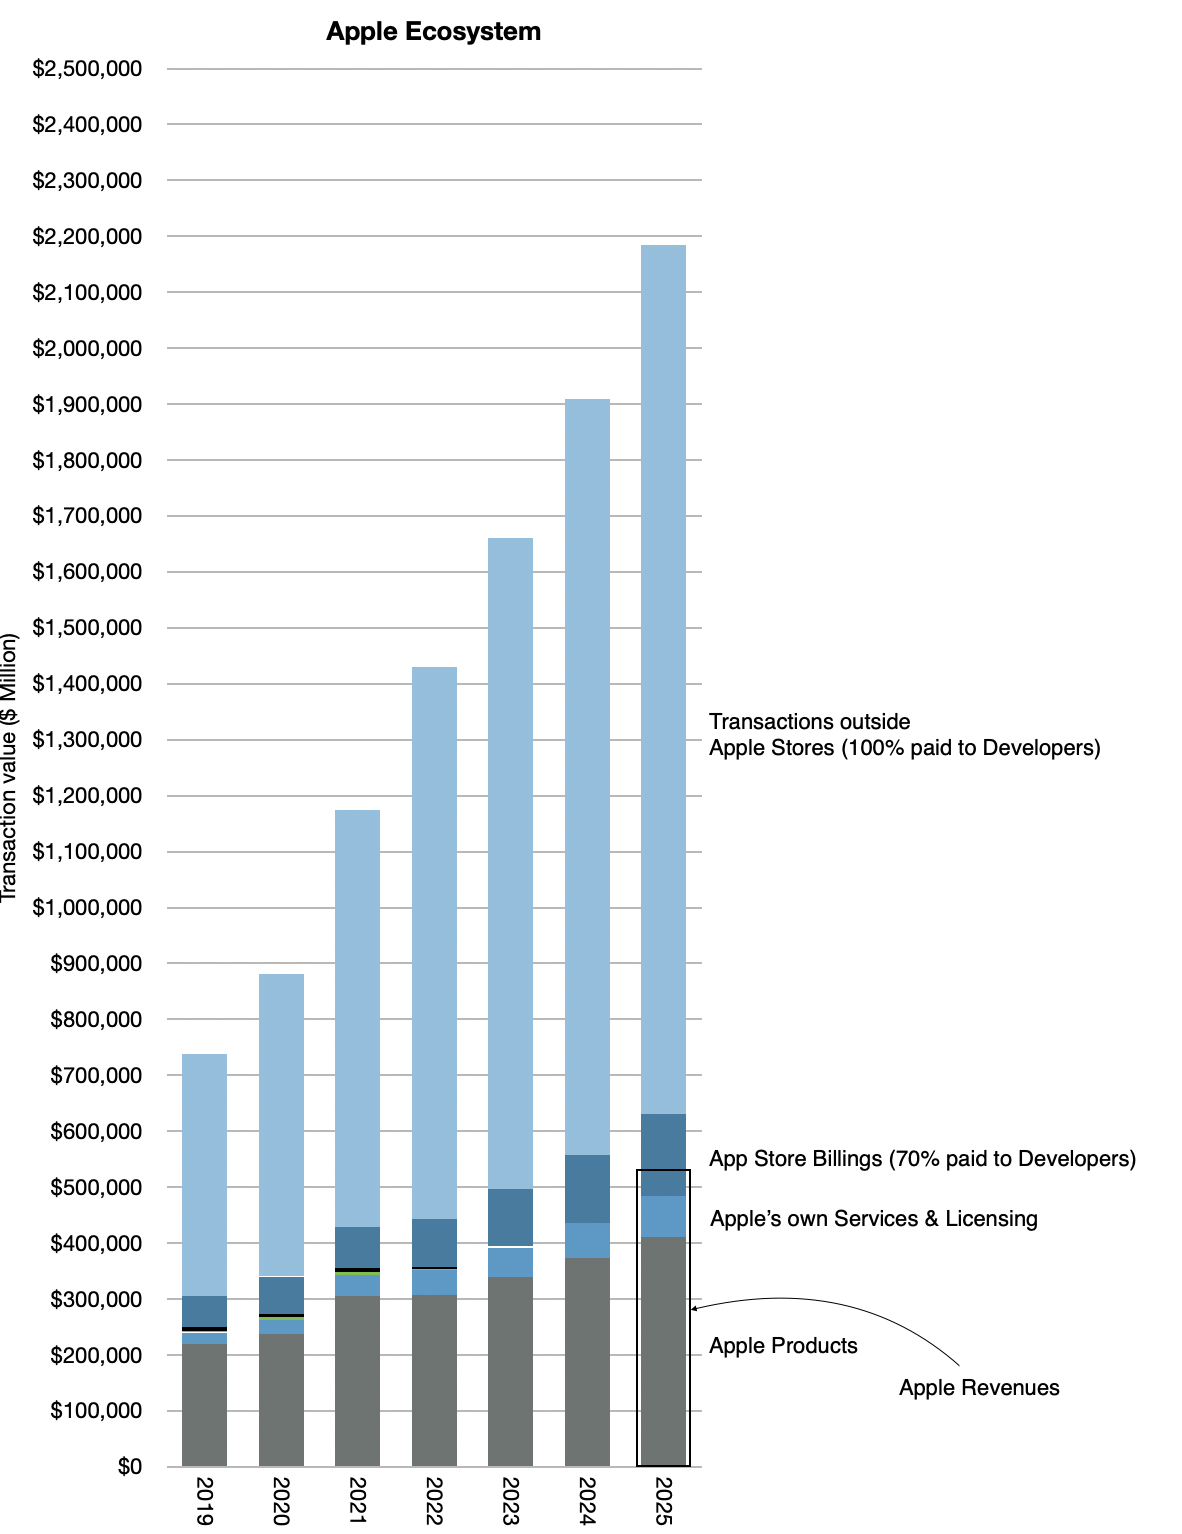
    Note that the "Economy" size was over $1.4 trillion when the ecosystem alone was $1.1 trillion. Note also that I'm also suggesting that it's likely to be $1.6 Trillion this year. This diagram shows the story since 2019 but also makes a forecast to 2025.

    I'm expecting the ecosystem to grow more modestly at 18% in 2023 (down from 29%) and 16% in 2024 and 15% in 2025. Apple's own product and services sales are also subject to estimation error.

    Nevertheless, it's not unreasonable to believe the forecast above where the Apple Economy expands to over $2 Trillion by 2025. This is an acceleration from previous forecasts.

    It's difficult to write about the implications of this. Any value in the trillions is hard to put in context. Certainly, Apple's market capitalization is in the trillions. For fun, we can calculate that Apple is trading at a multiple of 1.74 of its economy.

    But rather than trying to assess valuation directly, Apple's Economy is more like a GDP figure: I think it's helps to understand the overall scale and resilience. You might even ask what would happen if it were to cease to exist. The number of people who are employed in a $2 trillion economy is in the millions; perhaps 10s of millions of people.

    In 2023, global GDP is expected to reach $105 trillion. It's nice to think that Apple could soon be about 2% of the world.
  2. How Vision Services Subscriptions Reach $3000/yr

    Research

    One of the biggest puzzles of my adult life was this question: Why do people pay to attend live events when broadcasts and/or recorded versions are free? Not only do people tend to pay for live events, the costs are extraordinarily high. Earlier this year, 32% of planned concertgoers expected to spend $500 or more attending events, a LendingTree survey found. The survey also revealed 38% of concertgoers were willing to pay more for better seats, up to $328 for their favorite artists. The average price for a Drake concert is $600 and for Taylor Swift it's $2,424(!) Adding travel, accommodations, opportunity costs and transactions costs, the live event costs can easily run in the thousands per event.

    And it does not end there. Live events offer an inferior experience. The seat location can be far from the action, acoustics can be poor and there is usually a lack of multiple angles or replays (in the case of sports) to see the details of the action. Often, spectators have to watch large screens in order to actually see what is going on. In other words, they pay a great deal to watch the event on TV even if they are at the event.

    This puzzle came back to me also when attending the Apple Vision Pro launch at this year's WWDC. Those of us watching it in person basically watched what everyone at home saw, but in a degraded outdoor screen experience complete with sun glare and wind noise. Of course, we also got to see the device up-close and some even got demos. But this was the exception. Most spectators at live events do not obtain access to the talent. They may get to chat with friends or meet new ones but that is entirely haphazard.

    Now I know all the arguments about "presence" and the feeling of being a part of the event itself and the sense of occasion and shared experience that it generates. It's something movie theater operates are trying to also convey even while they are screening recorded content. Clearly there is some value to this. But $3000 of value?

    Let's then assume that, since the market is always right, there is $3000 of value in a premium live event. Consider a season pass to top sports leagues. Consider concerts, night clubs and band gigs. Then there is the line of business that I happen to also offer: live talks and conferences. How does technology affect this particular form of content?

    Well, I believe Apple has an idea. Apple, after all, invented the product-release-as-an-event. That is, Apple created event marketing–and everyone followed. Apple was first to know the value of the technology show business and in particular live show business.

    But delivering such businesses is not reliably profitable. The more reliable business is ticketing–an annoying racket. Putting on the show is touch-and-go. It might be sustainable until costs rise due to the talent asking for a greater share, or other service providers following suit. It's also difficult to stay on top as crowds are fickle and tastes change.

    This is why I think Apple's Vision Pro is at least partly aimed at "performance conveyance," rather than the more crude "recorded media playback" job to be done. If this is so, then the business model that makes sense is to license rights to performances and deliver them. The same way that licensing rights to recorded content and delivery was the business model of screen-based devices.

    So what does Performance Conveyance mean? Well, we have to look at performer quality, brand and the experience itself. If they come together well then Apple can say they deliver on the job of "live". And if so, then they can charge accordingly. Hence, whereas Apple Music is $10/mo. or Apple TV is $10/mo. or a bundle of services is $30/mo., then why wouldn't Apple Live be $300/mo?

    If not subscription then perhaps à la carte payment for events: sports, concerts, et. al. In combination it's not unreasonable that Apple with Spatial Computing and Vision will offer a new tier of service bundle pricing with an average revenue per user of $3000/yr.

    That would certainly solve my puzzle.

    [Edit: I forgot to mention the value of theme parks and (ersatz) tourism in general. Clearly this is such a powerful idea that industries have been created around it.]

  3. Movies and the Internet

    Research

    Almost a year ago, on March 1st, 2021, I tweeted a snapshot of the "FAANG" P/E ratios. They were:

    • Netflix: 88.63
    • Amazon: 73.94
    • Microsoft: 34.65
    • Google: 34.75
    • Apple: 32.89
    • Facebook: 25.53

    Today same companies have the following ratios:

    • Netflix: 19.34
    • Amazon: 46.08
    • Microsoft: 30.17
    • Google: 22.35
    • Apple: 27.79
    • Facebook: 13.67

    What a difference 13 months makes. Microsoft and Apple saw modest falls 13% to 16%. Amazon, Google and Facebook saw large falls in their ratios: 38%, 36% and 48%. Facebook (now renamed pitifully as "Meta") in particular saw its valuation collapse by half! This is largely because in February the company forecasted lower than expected revenue growth in the next quarter, blaming privacy changes in iOS, macroeconomic challenges, and the market finally realizing that it's an evil and despicable company.

    Microsoft and Apple grew their businesses nicely and have been resilient post-Covid. They are now revenue-reliable "blue chip" tech companies with large user bases that encompass high value, loyal customers. Google and Amazon are a bit more precarious given exposure to macro conditions and unclear new market opportunities but Amazon is still sporting a very healthy 46 ratio which is largely due to its investment-heavy approach to cash flow.

    But the star of the show, the real blockbuster, is Netflix. It fell from P/E of 88 to P/E of 19. Even six months ago the P/E was close to 70. What happened?

    Remember that P/E is an indication of growth potential. A P/E of 19 implies that the equity should be priced at 19 times last year's earnings, which are roughly indicative of profit in a year and thus P/E is a time horizon: how many years would I wait before I got my investment capital back (and thus break-even).

    Well, one could say that a P/E of 13 or 19 (FB or NFLX) is pretty reasonable. It's reasonable to pay that many years' profit for a company. The large ratios only make sense if a company is growing rapidly. 20% to 30% growth can justify P/E of above 20. But what would justify a P/E of 88?

    The market has always given Netflix high valuation because it was growing and when the growth stopped the P/E fell to a more reasonable level. Unfortunately that means the share price had to fall over 70% from its peak. More than 40% in two days. Tragic.

    The stock peaked at $700 in October and is $221 now. Why were investors betting on high growth, just a few months ago?

    I think it was because investors like movies. And the Internet. Investors like movies and the Internet.

    Netflix was never a great business. The logic evolved from sending movies as DVDs by email, ordered through an online catalog, to having the same selection available for download (streaming). Everything was subscription-based so bundling gave movies a "binging" consumption option.

    But this depended on the having access to good titles. The access was easy at first since Netflix was a new channel and it was a bonus for the movie publisher. Pure margin. But over time the movie publishers saw the new channel eating into existing distribution and they thought they could deliver it themselves, increasing margins. The catalogs were suddenly cut off.

    Netflix responded bravely: they would make their own movies. Out came the checkbooks and the distributor became the producer.

    Amazing.

    But is that really a good business? You have to make movies which are very expensive. Some will be hits, some won't. You thus have to make a lot of them. And then you have diverse demand. People want to have all kinds of genres. So you have to make them all. And what's more you can't really market them as events because they are so numerous. It sounds really hit-and-miss with a huge risk.

    At this point you have to raise pricing. And then came the competition who, like Disney, said "we have better, more targeted family content". Or Apple TV+ which simply said "we have better quality." Many other streamers offered alternatives like Amazon Prime with a smorgasbord approach. Sure, households could subscribe to all these services, but the bill would start to be painful. Not much savings over the cable bundle. Netflix increasing price sends many for the exits.

    The company then drops a bomb: they feel they can't grow subscribers because they are "near saturation" and the families which are not yet paying are probably using "shared" passwords. It can only grow if it converts the non-payers.

    That all happened rather quickly. The market loves movies and the internet and who doesn't. It's just that movies and the internet don't make a great business.

    Movies look to be more of a feature of an internet service bundle. That's Apple's approach. They don't see video as a business but as hygiene: must-have something to put in a bundle.

    So Netflix, who first unbundled the neighborhood video store, then bundled production and distribution was itself not much more than a substitutable piece of a bigger bundle.

    For this reason I always wondered why there was an "N" in FAANG. Netflix always seemed more a transient idea: yes people like movies, as they like music and books and magazines. And producing and distributing media has undergone dramatic change with computing and internet. But a business that only produces and distributes a single media type may be an ok business but should it be put on the same level as platform companies with billions of users?

    Netflix has 200 million subs but that is not a big number. Apple distributes 785 million subscriptions to over 1 billion customers. Google has at least 2 billion users, Microsoft about 1.5 billion and Meta is over 3 billion. Netflix says it can't get many more and indeed they forecast losing 2 million next quarter.

    It's a bit sad, but reminiscent of the games industry: it has its limits and the limits mean that it can't be seen as a ubiquitous and hence maximally valuable asset.

  4. The Most Important iPhone Ever

    Research

    Just recently, the 2 billionth iPhone was sold. Unlike the 1 billionth, there was no announcement, no celebration. Partly this is because Apple stopped reporting unit shipments, but partly it's because it's not as interesting to talk about 2 billion as it is about 1 billion. There is a desensitizing when numbers get that big. What happens after you achieve the status of the most popular and valuable product of all time? How much more better can the world absorb?

    Before we answer, let's reflect on how it's going. The iPhone is doing better than ever.

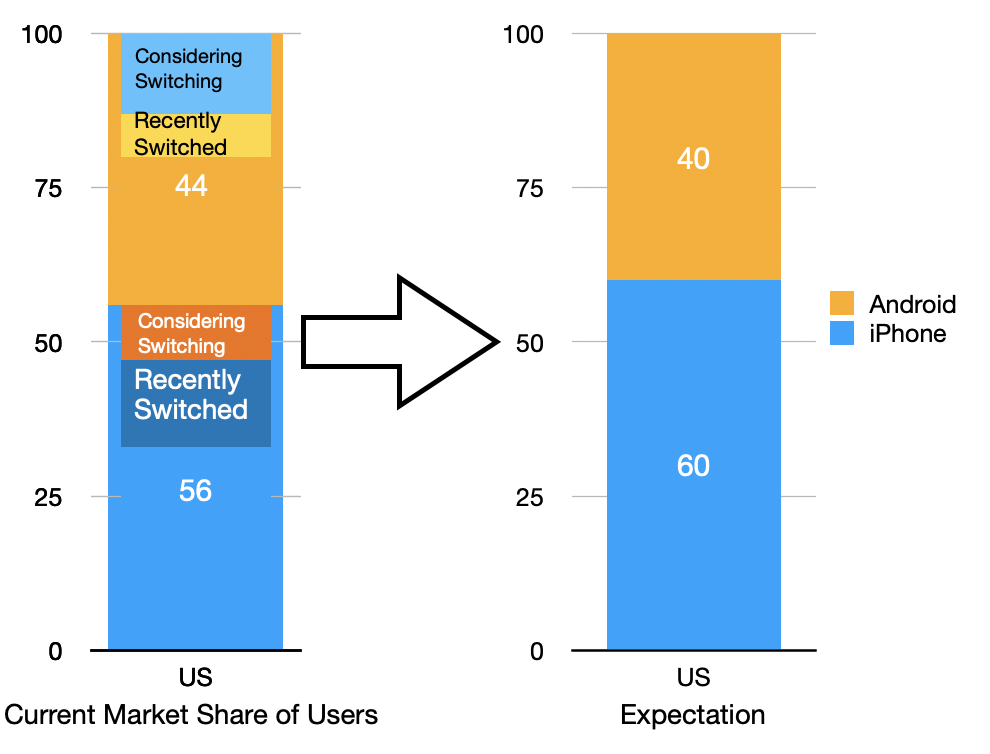
    There are more than 1 billion iPhone users. The total number of users has been rising steadily. iPhone users make up about 26% of all smartphone users (3.8 billion is the current estimate). The share of users in the US is about 60% (or soon will be.) The share in UK is close to 50%. All these share numbers are higher than ever. Over 14% of US and 10% of UK survey respondents have switched to an iPhone in the past two years. The following graph shows how churn is boosting iPhone market share in terms of users.

    Source: Piplsay

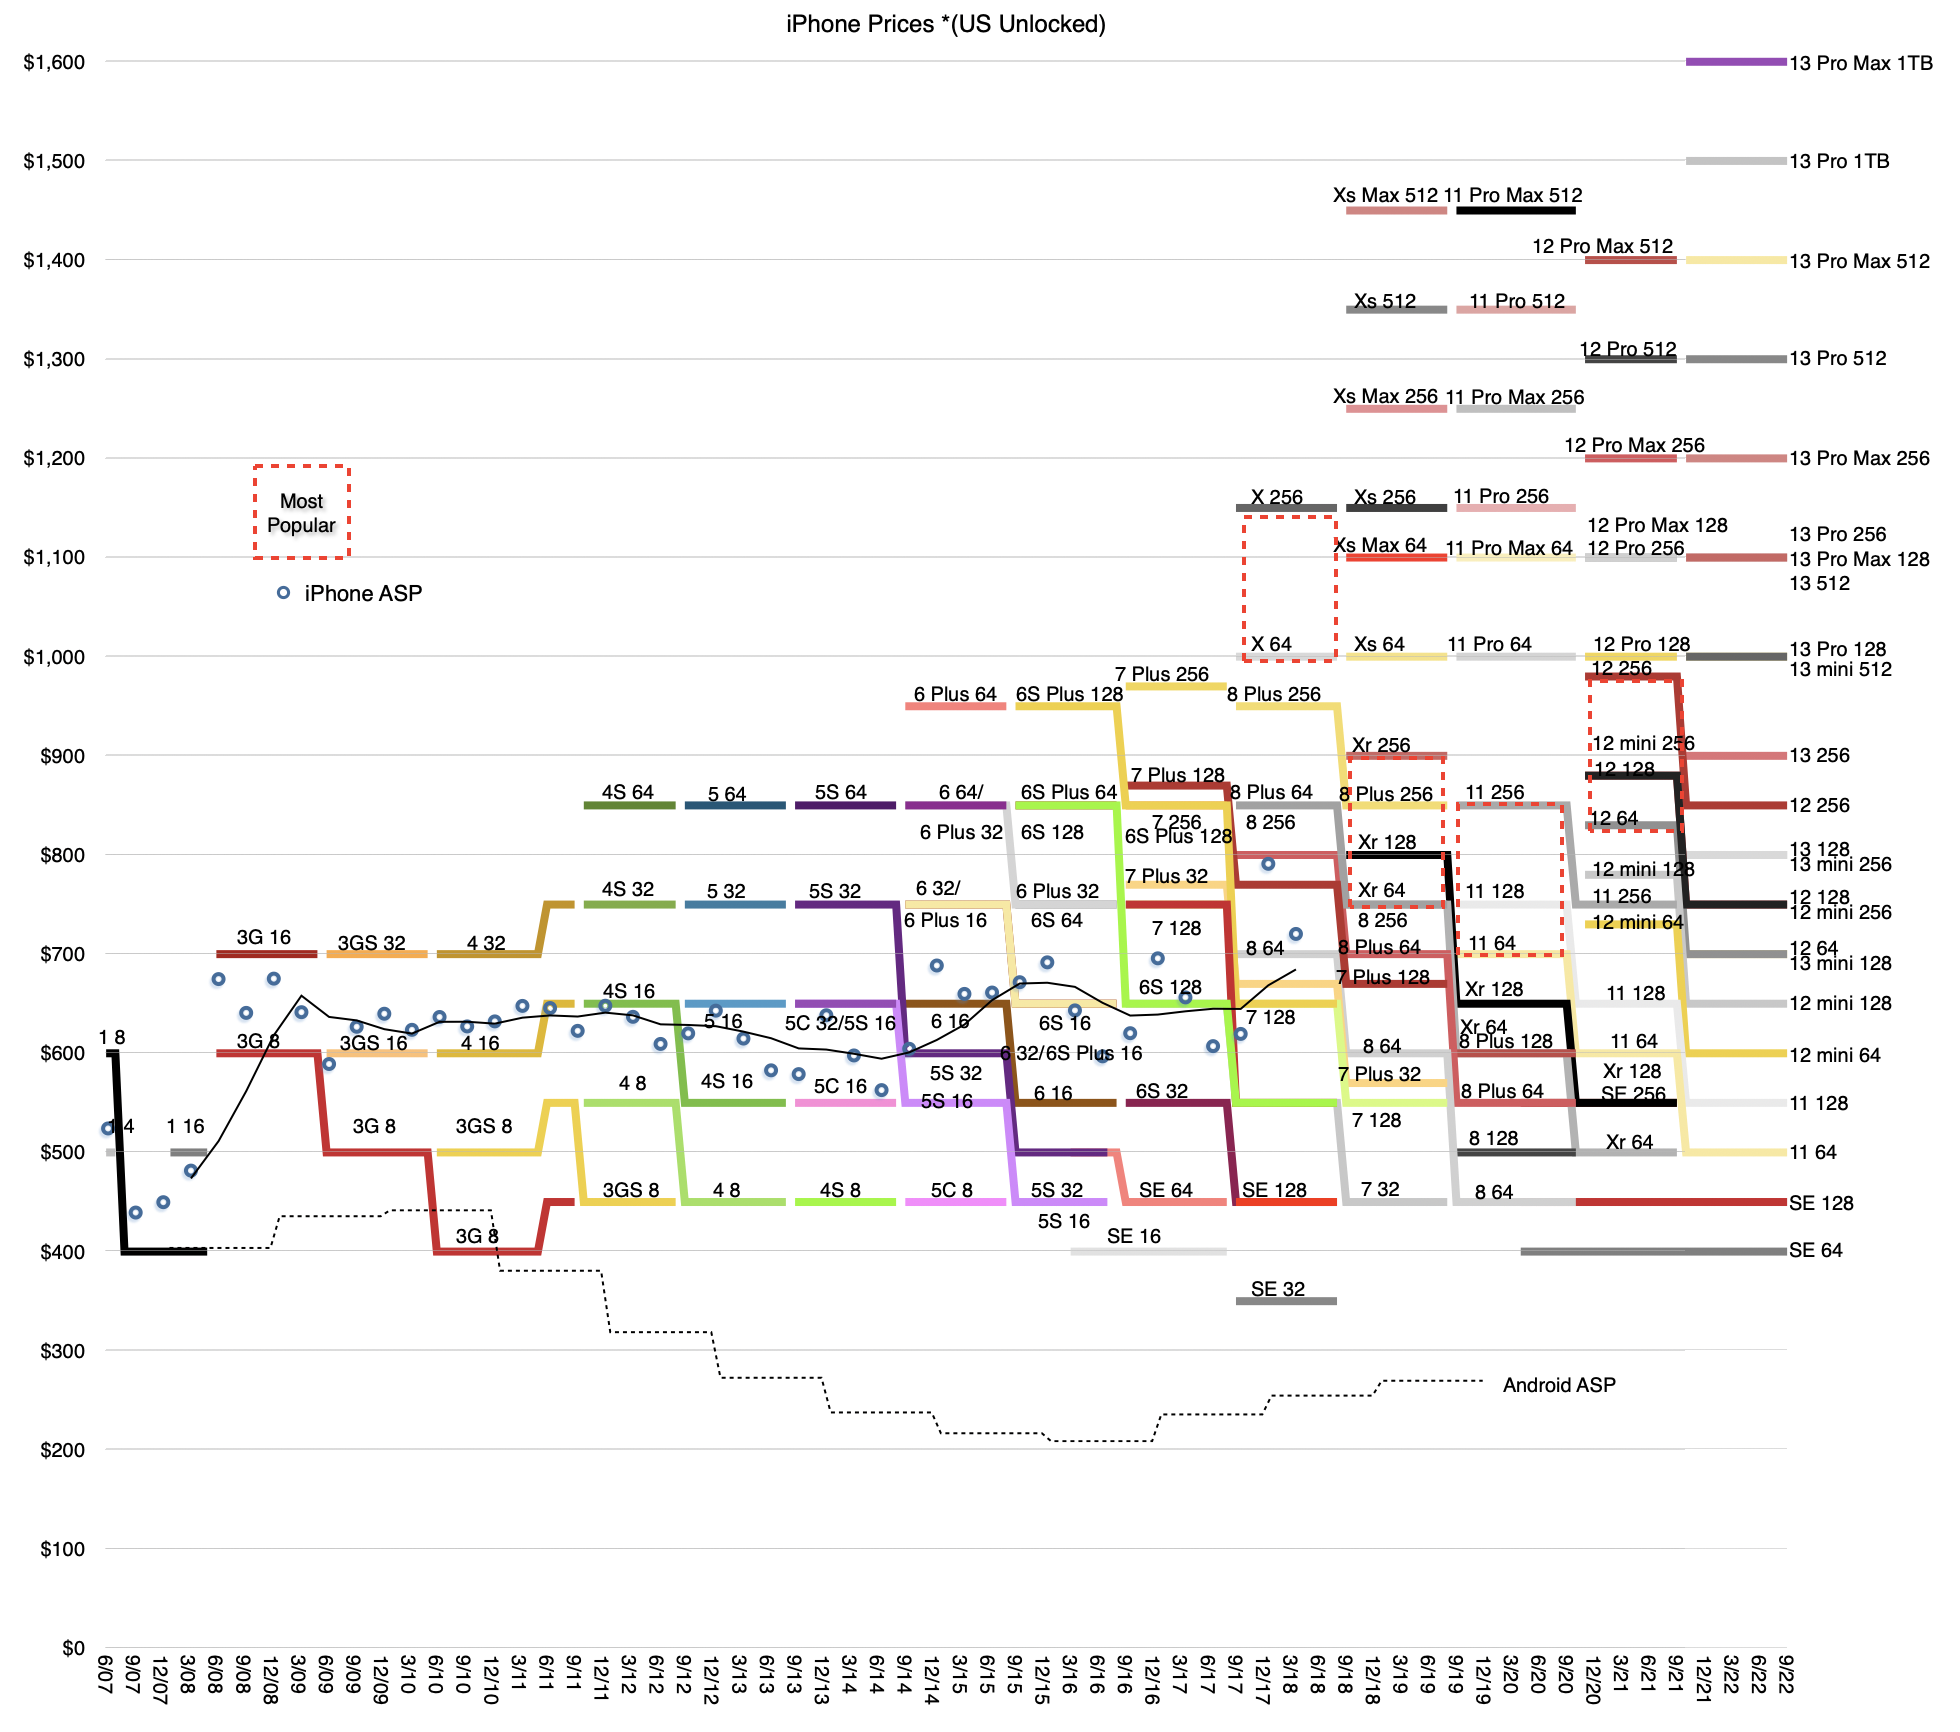
    There are more iPhone configurations. As the following graph shows the spread of phone price points is wider than ever. Reaching $1600, the range still starts at $399 in the US (excluding taxes.) The total range (number of lines in each year) is increasing also, now 24 mainly due to the addition of a 1TB storage option. NB: There are now two iPhone minis (12 and 13) and one SE bringing up the rear.

    Carrier incentives are picking up again. There are tremendous trade-ins and incentives for financing new iPhones which is bound to create retail traffic. Also with the opening of more economies, there is likely to be a surge in shopping. Bear in mind that around 400 million users have iPhones older than 3 years. Trade-in values are as high as $1000. Which leads to...

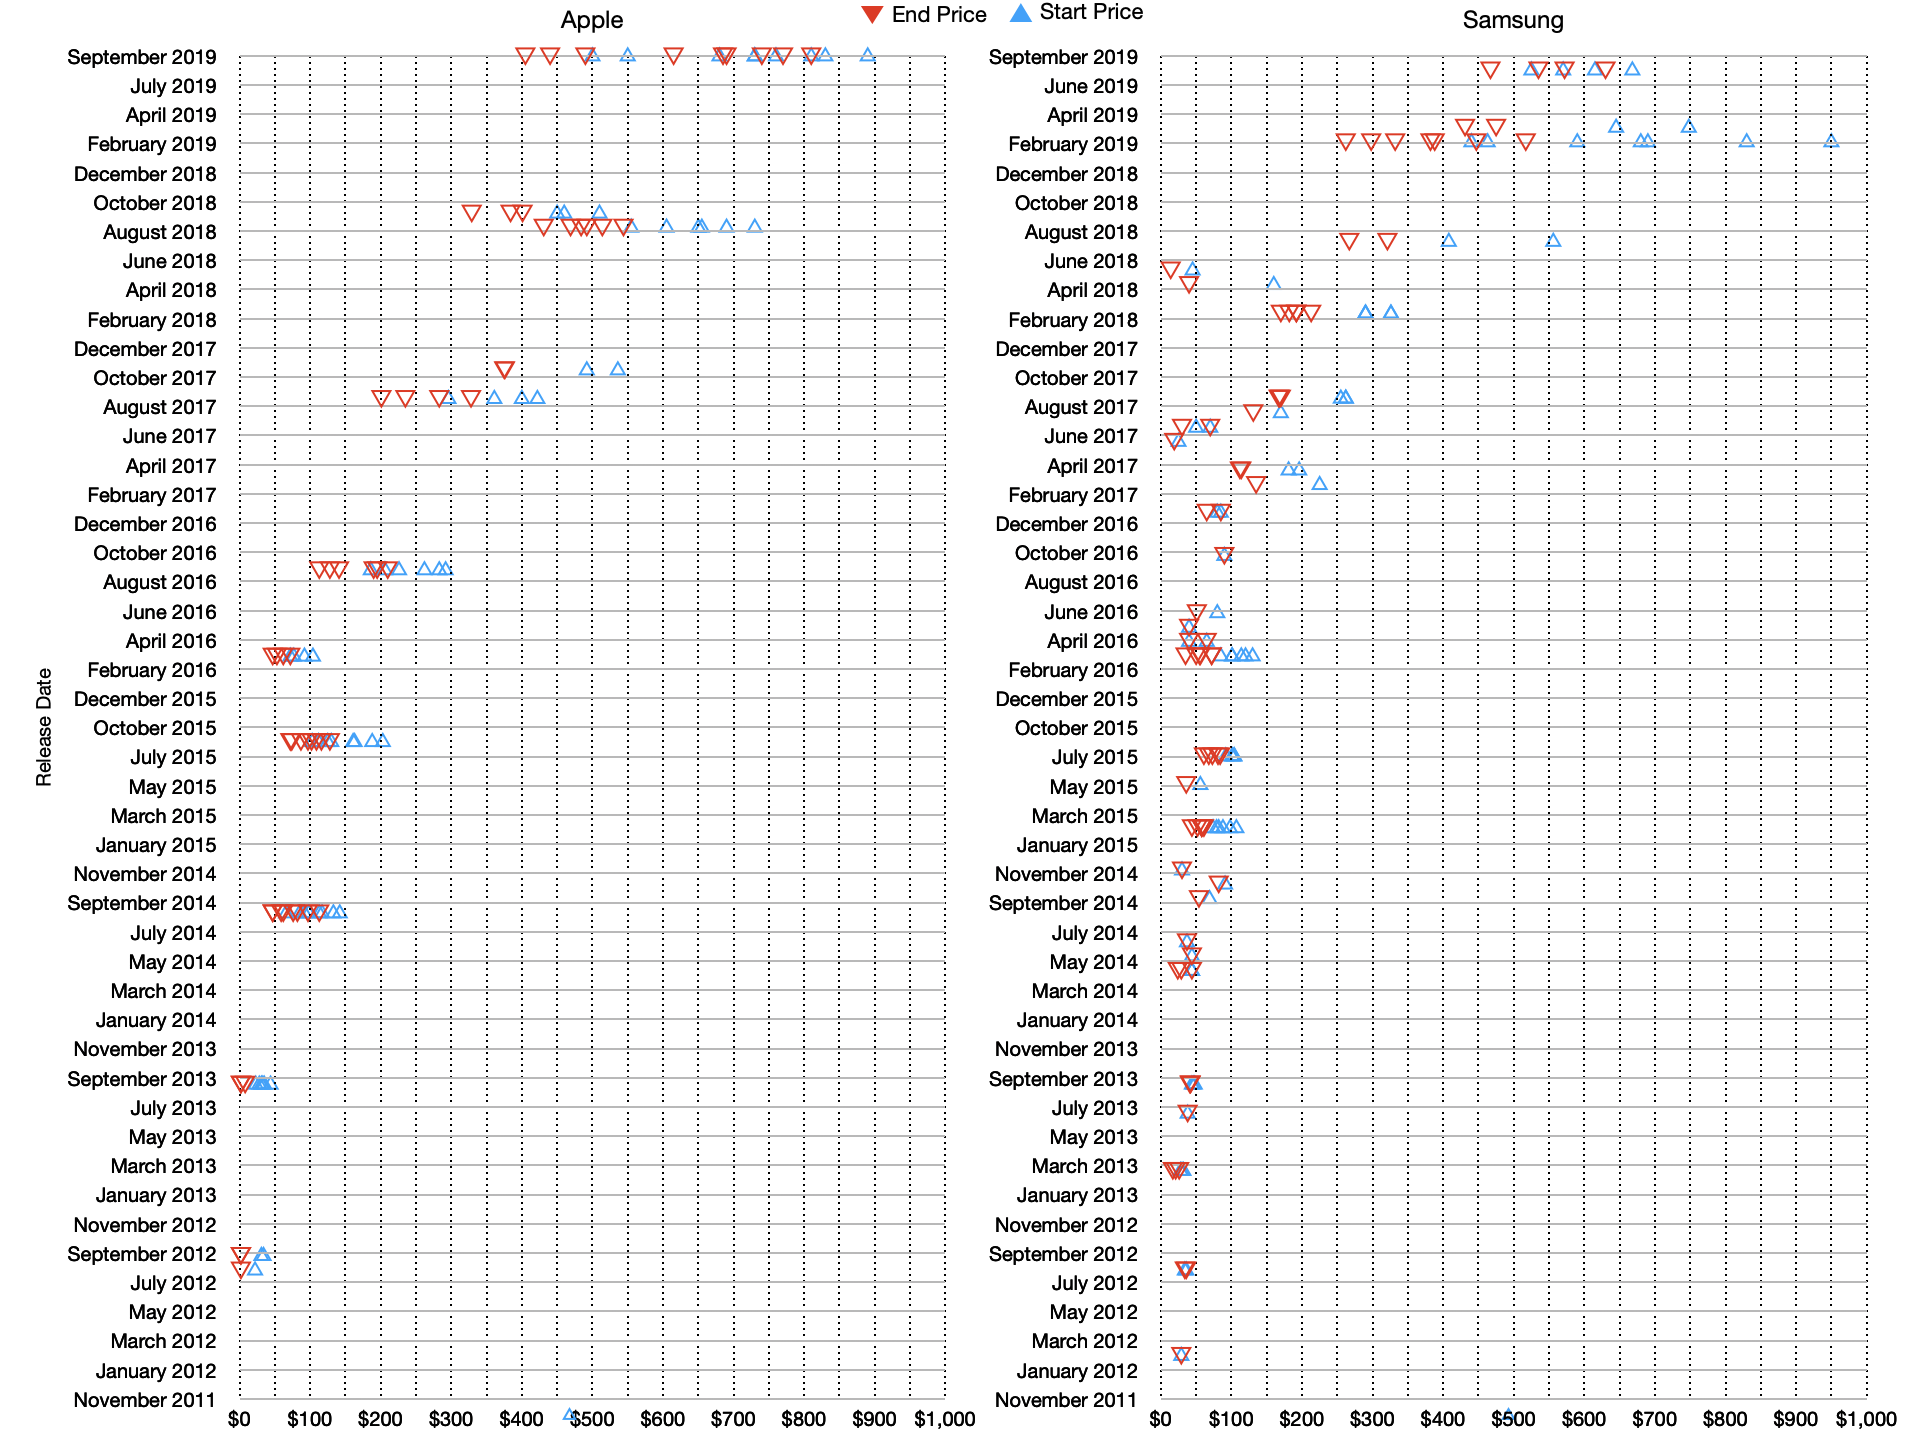
    A thriving secondary market. The used smartphone market is dominated by iPhones and this drops the floor for entry into the iPhone ecosystem to essentially $0. The following graph shows price drops across 2019 for Apple and Samsung smartphones (for various models by date of initial release).

    Most importantly, the specification of the iPhone continues to push the boundaries of what consumers demand from a phone. The camera performance for the latest iPhone 13 enables a set of new behaviors beyond the selfie, the snapshot or 10 second video. Apple is putting cinematographic power in the hands of amateurs. It's not so much about replacing professionals but enabling amateurs to look better to each other. Be sure to listen to the latest Asymetric podcast to hear from John J. Connor, accomplished film industry camera operator and cinematographer on the power of iPhone cameras.

    The new cameras are for the new generation of YouTube, Instagram and TikTok influencers. Ordinary people with extraordinary tools can do extraordinary work.

    The latest iPhone 13 is, in my opinion, the most important iPhone ever. It creates the perception of what a phone should be and it sets up the trajectory for demand that did not yet exist. It's facile to think that the utility of an ok older phone is good enough. That assumes that we are satisfied with ok messaging and ok apps. With ok photos and ok video. With no wide angles, no nightmode and no macro photos. What the iPhone has shown however is that the demand for performance can be nudged up.

    We did not ask for rack focus, post-production focus (!), night mode, macro photography and portrait bokeh. But once we have these features we begin, ever so slowly, to use them and then we start demanding them. Conversely it seems that what people mostly ask for—that is what the critics ask for—are extrapolations of existing features. The "faster horse" dilemma.

    What makes the iPhone and perhaps Apple special is that it seems to deliver things that nobody asks for but then everybody wants while eschewing overshooting a performance dimension that a few demand but most won't use.

    The tragedy of overservice and disruption is that if you don't shift the definition of performance eventually you run out of demand at the top of the performance curve. That opens you up to "good enough" competition from below. Instead you need to re-define the notion of performance: compete on a new basis, reset expectations. That the iPhone can find new dimensions of performance and hence demand is effectively a solution to the innovator's dilemma.

  5. A Jobs to be Done diet for your Software with IGEN

    Sponsor

    Software is eating the world. But are users consuming software?

    Every day, the software industry wastes millions of dollars developing flawed software that's abandoned by users. Yet the industry’s focus continues to be on the supply side: client or server, full-stack or specialized, out-source or in-house.

    The Jobs to be Done method presents a fresh approach. By studying the demand side, developers can focus on how products are used by consumers to overcome their daily struggles. This method has brought success to a range of popular consumer products, from Snickers to Tide Pods. 

    Friend of the blog IGEN has been building software with top Jobs to be Done thought leaders for the past six years. Amplified with 30 years of software development experience, this makes IGEN the ideal partner to realize the ambitions of corporate leaders, nimble startups, and multi-national initiatives, alike. 

    Start 2021 with a Jobs to be Done Consult for your product. IGEN will conduct 21 free, 1-hour sessions before February 21. Sign up today, first come, first serve.

  6. Apple's Fourth Calendar Quarter 2020

    Research

    As a rule, I don't like to make a forecast for Apple's performance during quarters where there is no guidance. There is a good reason why there is no guidance. The management does not feel confident that there is enough information to make a reasonable prediction. Keep in mind that the management has very detailed, very frequent updates on their business metrics.

    Anyone who has run a business knows that signals of performance are abundant and one can only imagine how many signals arrive at Apple HQ from the 1.5 billion active devices, tens of thousands of points of sale, and a vast network of resellers. There are also billions of interactions in services. Then there are search queries, store visitor counts (online and physical), developer payments, app downloads, content downloads, subscriptions. All this information is collected and analyzed on (probably) a daily basis.

    Also when guidance is given, it's usually a month into the next quarter. The company will have already seen about a third of the quarter already pass before they predict the next two thirds.

    This last quarter in particular was even more difficult given the delays in launching the new iPhones and the dynamics related to the broader portfolio.

    And yet, the company feels that they can issue some "insights on our expectations". Here is what was said about three months ago:

    These directional comments assume that COVID-related impacts to our business in November and December are similar to what we've seen in October. […] [W]e expect iPhone revenue to grow during the December quarter despite shipping iPhone 12 and 12 Pro 4 weeks into the quarter and iPhone 12 mini and 12 Pro Max 7 weeks into the quarter.

    We expect all other products in aggregate to grow double digits, and we also expect services to continue to grow double digits. For gross margin, we expect it to be similar to our most recent quarters despite the costs associated with the launch of several new products. For opex, we expect to be between $10.7 billion and $10.8 billion. We expect OI&E to be around $50 million and the tax rate to be around 16%.

    Luca Maestri, Chief Financial Officer

    So, given this information and some hints from IDC, Gartner and CIRP and China I'm willing to offer some estimates:

    • iPhone Revenue: $63.9 billion
    • Mac Revenue: $9.3 billion
    • iPad: $7.4 billion
    • Services: $15.1 billion
    • Wearables & Home: $12 billion
    • Net sales: $107.8 billion
    • Gross margin percent: 37.7%
    • EPS: $1.48 (Growth: 19%)

    Of course, this is very speculative and I don't have a lot of confidence in it. If anything it may be on the high side.

    I don't expect there to be guidance for the next quarter with a resumption of guidance only after the pandemic has largely subsided (probably Q3 of this year.)

  7. The Entrant's Guide to Automotive Industry (updated)

    Research

    I wrote the initial guide almost exactly six years ago. Also known as "The 10 Commandments of Automotive" it's time to re-visit it to see how and if anything has changed.

    The rules listed are empirical observations. The patterns show how things are and have been and hint at what can and cannot change. Capacity utilization and capital allocation are perhaps the most basic root causes for how the system operates.

    Capacity utilization has meant that incumbents needed to produce large quantities even if they were not doing so profitably (1st commandment). The capital invested in plant and equipment had to be amortized. This meant it was difficult to enter with a low volume strategy. Indeed all entrants that succeeded did so with "people's cars" (2nd commandment) which were destined to mobilize entire nations if not continents.

    As production orientation absorbed all attention, innovation in production determined the cycles of dominance. First Ford, then GM, and finally Toyota refined the production system (3rd commandment.) Eventually every producer would adopt the "best practices" but the innovator would have years if not decades of competitive advantage.

    The political implications of the automobile became a dominant question as it effectively terraformed its environment. Cities, ancillary industries and even our climate were affected. This meant infrastructure, tax policy, land use policy and financial systems became dependent on automobiles. In return governments began to regulate, creating a symbiosis between government and automakers. (4th commandment).

    New technologies were plentiful but they all got absorbed by the industry. Mechanical, chemical and material sciences, computation and communications were all sustaining. (5th commandment.) New fuels, microprocessors, wireless technologies; these immense evolutions did not change the structure of the industry.

    As new countries became prosperous they not only adopted cars but they adopted car production. The Europeans were first with the technical invention but the US was first with mass production, followed by Western Europe, Japan, Eastern Europe/USSR, Korea, China and now RoW. (6th) Each new entrant had the advantage of hindsight and would be more efficient, at least for a while.

    Low volumes were left to "luxury" brands which survived by solving a different job than transportation, namely that of status signaling. Eventually the low- and high-end merged into brand holding companies. Capacity was traded and cross-ownership, joint ventures and "badge engineering" was widely practiced. Governments kept competition at bay for national champions, mostly. (7th commandment)

    Cars grew to over 1.2 billion installed base and, including commercial vehicles, reached 100 million units of production/yr. The problem that arose was that the infrastructure could not keep up. Urbanization was growing faster than motorization and land became scarce. Cars need land. Lots of land. For roads but also for parking (3 spots for every car in use, at least.) As global prosperity increased and as prosperity meant a car the struggle to find room for these modes of transport grew intense. Most users now found the car to be a constraint rather than a liberation. (8th commandment.) Parking and congestion were problems highly evident to the motorist but the externalities of exclusion of public space and emissions became highly evident to the governors who, you remember, are in a symbiotic relationship.

    Clearly the pressures were building for drastic improvements in how transportation would be allocated. My response was to promote micromobility, the idea that small is better and smallest is best and that the tendency of the industry to supersize its offering in the face of increasing constraints was classic innovator's dilemma. Incumbents could respond by rapidly changing their portfolio to include a wider variety of form factors and while they broadened the portfolio (e.g. Audi went from 4 models in the 1960s to 40 in the 2000s) they did not go below a certain line (the 500kg line). They also did not modularize their production system. Production (body-in-white, paint, engine and final assembly) remain in-house while parts are outsourced. (9th commandment) This was peculiar to me and indicated a deeper structural issue.

    Instead of a pivot downward, the industry keeps chasing size, mass, volume, power, range. Most trips are short but all the engineering goes toward the long tail of highly improbable distances and loads. (10th) Always the answer to this dilemma is that you build what customers demand. Well, which customers are you asking? Under what circumstances are you framing the question? Well, never mind, let's build electric versions of the same cars.

    These constraints determined the outcomes for the industry for a century and are predicated on decisions allocating limited resources and capital based on we might call classical microeconomics; but all within a bigger political and indeed geo-political context.

    So what has changed?

    This classical model has one potential flaw: The assumption of capital as a limited resource. An odd thing happened in the last decade. Capital has not only become really cheap, in many cases it has reached a negative cost. This is evident in negative interest rates. When I observed this I thought something fundamental was broken. If there is so much capital that people are paying you to keep it for them then a lot of this "classical microeconomics" begins to break down.

    The firms that are husbanding capital can be "disrupted" by those who squander it. Those who observe discipline and pursue efficiency can be defeated by those who are undisciplined and inefficient.

    Holy cow!

    This entrant's guide is a rationalization of what governs one of the largest activities we engage in. And yet it may be undermined by an imbalance. The evidence is in the capitalization (and hence free capital availability) to entrants who have little to offer except a dream. The incumbents who thought they could sustain through technology transitions are being out-spent and having their access to what is still limited (raw materials or components) curtailed.

    Need more proof? Tesla has single-handedly doubled the value of the automobile industry in a year when overall volumes and sales shrank.

    That means that either there will be twice as many cars as we have now or they will be twice as expensive or they will be twice as profitable. And all that will happen really soon. We can't have twice the cars since there will be nowhere to park them. We can't double the price unless we double our wealth. We can't make them twice as profitable unless we disable competitive forces and change the production system.

    Or, it could be that half the assets (all the other automakers) are worthless.

    Something has to give. The paradoxes multiply.

    Into this will, one hopes, step Apple. Things are about to get really interesting. Stay tuned.

  8. App Story

    Research

    App Store spending was $1.8 billion in the last week of 2020, up from $1.42 billion the previous year —an increase of 27% vs. an increase of 16% from the previous year.

    On 1/1/2021 App Store spending reached $540 vs. $386 million for 1/1/2020. This was an increase of 40%. The previous year's increase was 20%.

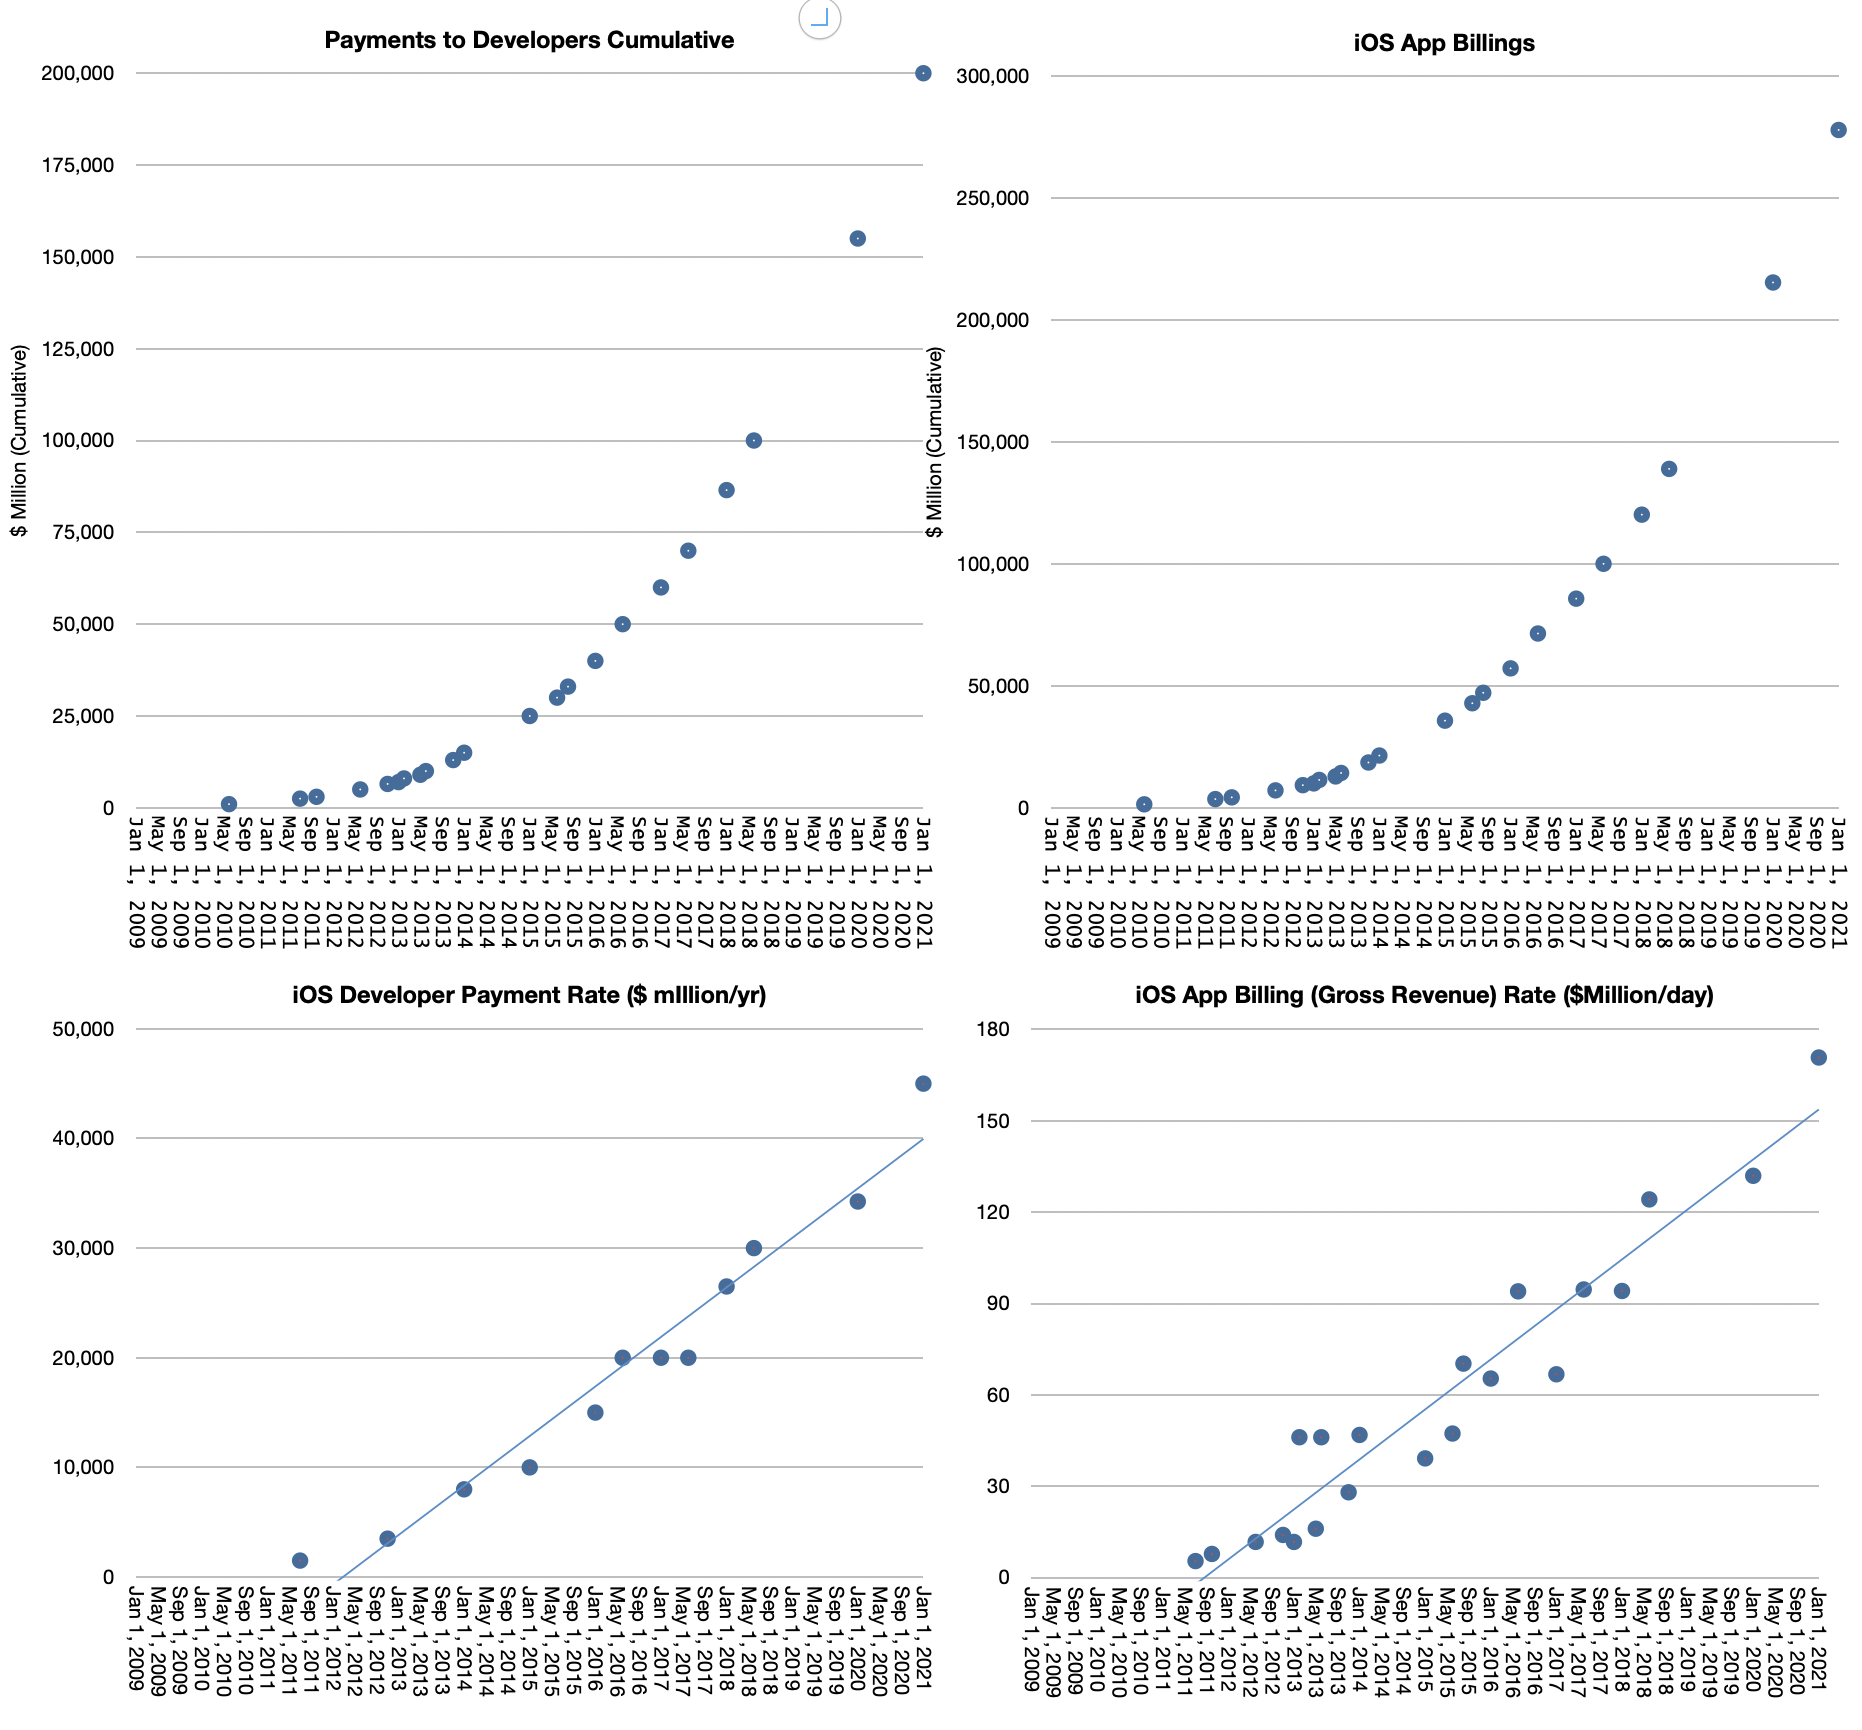
    Developers selling through the App Store have now earned more than $200 billion since the App Store launched in 2008.

    The previous year's figure was $155 billion, making the 2020 total $45 billion, a 30% increase from $34.5 billion average of the previous two years. Assuming a proportional increase, overall ecosystem transactions rose to $675 billion in 2020. This places Apple's valuation at a 3.2 multiple of its yearly ecosystem value and each customer is valued at approximately $1400.

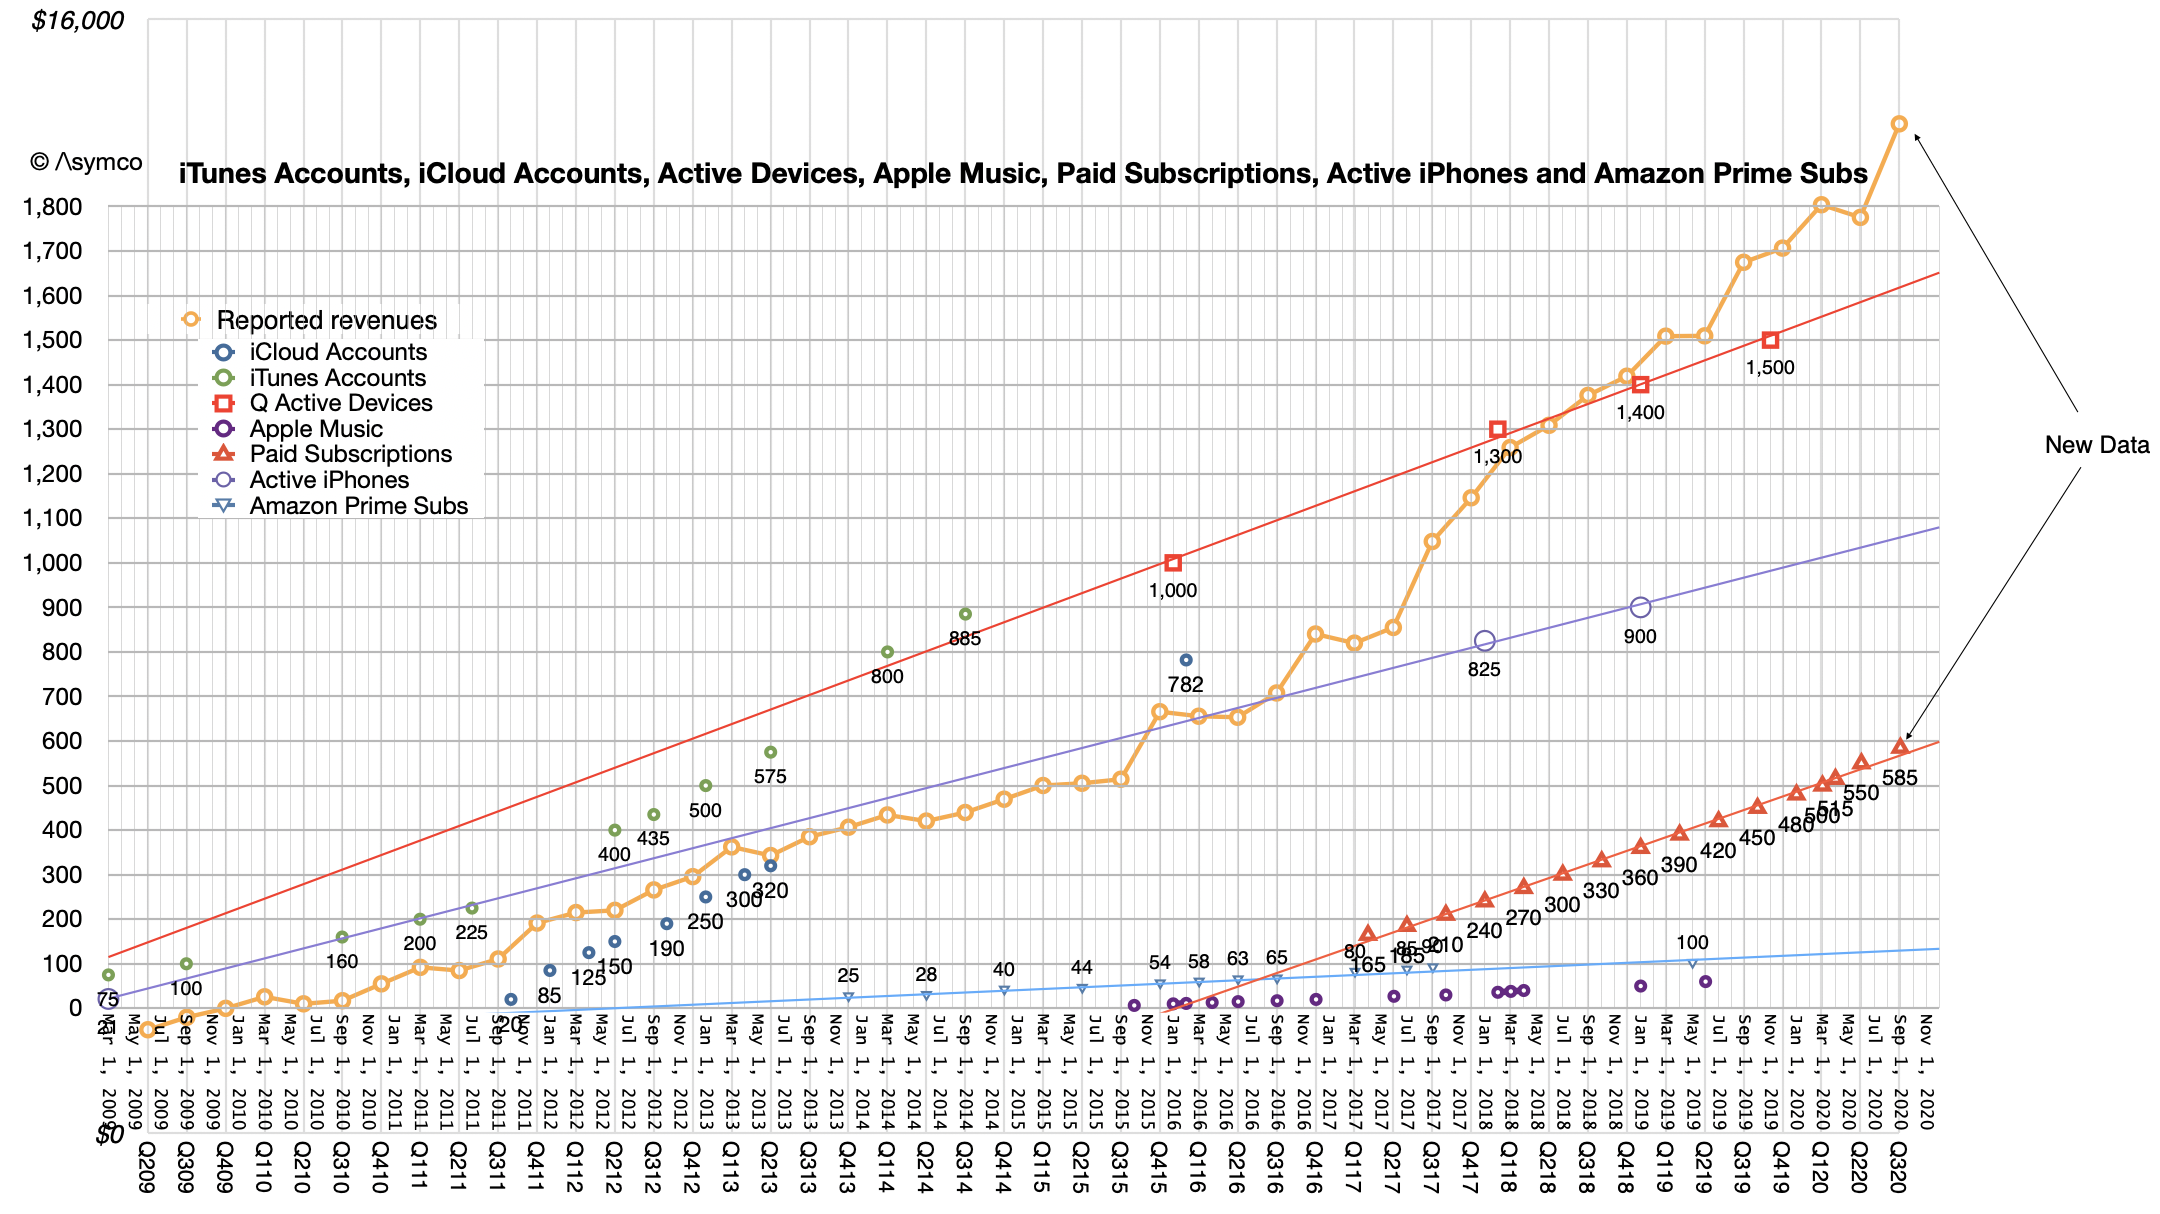
    The history of App Store revenue and the growth rates involved is shown below.

    NB: A substantial amount of App Store revenue is derived through subscriptions which now total about 600 million.

    A simple summary is that the App economy accelerated its growth in 2020. This implies an economic value reaching $1 trillion/yr. within two years. It would behoove the investor to evaluate the value of Apple as a multiple of its ecosystem as well as a multiple of its customer base.

    As I have repeated over time, the strength and resilience of Apple is in its customer base. Strength in terms of willingness to spend for quality and value and resilience in terms of sustained satisfaction. As that base grows to well over 1 billion people and as this billion are exposed to an increasing spectrum of value options (products, services and ecosystem) the company becomes indispensable.

    This is quite the opposite of the perceptions widely held even a few months ago.

    In other news:

    • Apple added 52 new territories to Apple Music.
    • Apple TV is now available on over 1 billion screens in over 100 countries and regions, providing access to buy or rent over 100,000 new release and classic movies and TV shows
    • Apple Pay is accepted at more than 90% of stores in the US, 85% of stores in the UK, and 99% of stores in Australia
    • Apple Books now draws over 90 million monthly active users
    • Podcasts are now available in over 175 countries with programming in more than 100 languages
    • More than 85 percent of iCloud users are protected with two-factor authentication
  9. Apple in mid-2023

    Research

    The Apple product line-up for 2023 is almost completely decided. This is not conjecture but simply an observation of the lead times for developing the types of products that Apple offers. The integration of hardware, software and services, often cited as the key to Apple's sustainable competitive advantage, has a great cost: the time required to develop in an integrated fashion is far longer than the time required to develop in a modular fashion.

    2.5 years is not a long time. The development process on truly new products could take 4 to 5 years. Apple Silicon, new Operating Systems and new services could all take longer than 2.5 years. The products we just saw launch this year were planned and engineered at least 2 years ago. The more integrated, the more time is needed. Wearables, AI/ML and process engineering are additional examples of long arcs of development needed to reach products.

    This does not mean we can predict what these products will be. We don't have visibility to the process but Apple management does and they will make decisions now on adjacent dependencies in the business. For example, visible efforts in planning the use of cash, the carbon offsetting, capital expenditures and R&D are all synchronized to the roadmap and hints may be read into this data.

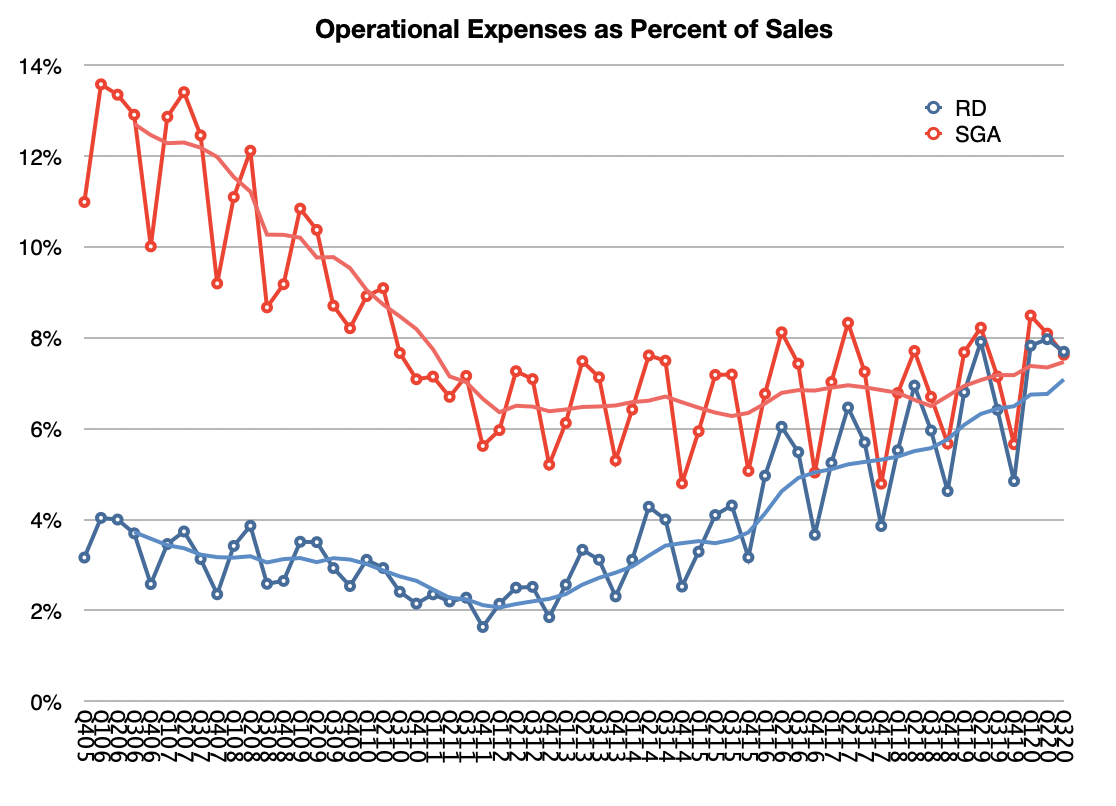
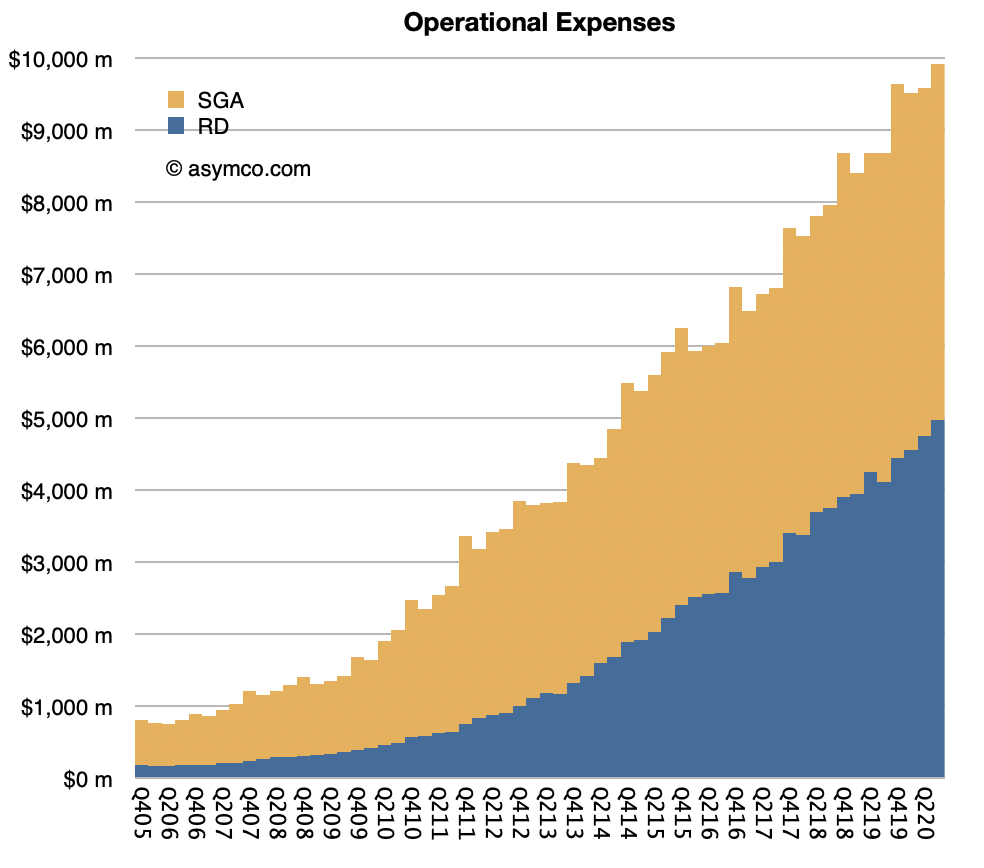
    The biggest hints are the R&D spending and the company's capital return program. Combined they show a confidence in the roadmap that is hard to overestimate. First, R&D is reaching new highs of about 7% of sales (on a trailing 12 months' basis, see graph below). This is almost the same as the spending on SG&A which has declined as a percent of sales from above 12% pre-iPhone.

    Of course sales have increased significantly over the time shown in the graph below and the absolute spending is shown the following graph. R&D spending is over $5 billion/quarter or about $20 billion/yr. Some of the results of this will be seen in 2023 or beyond.

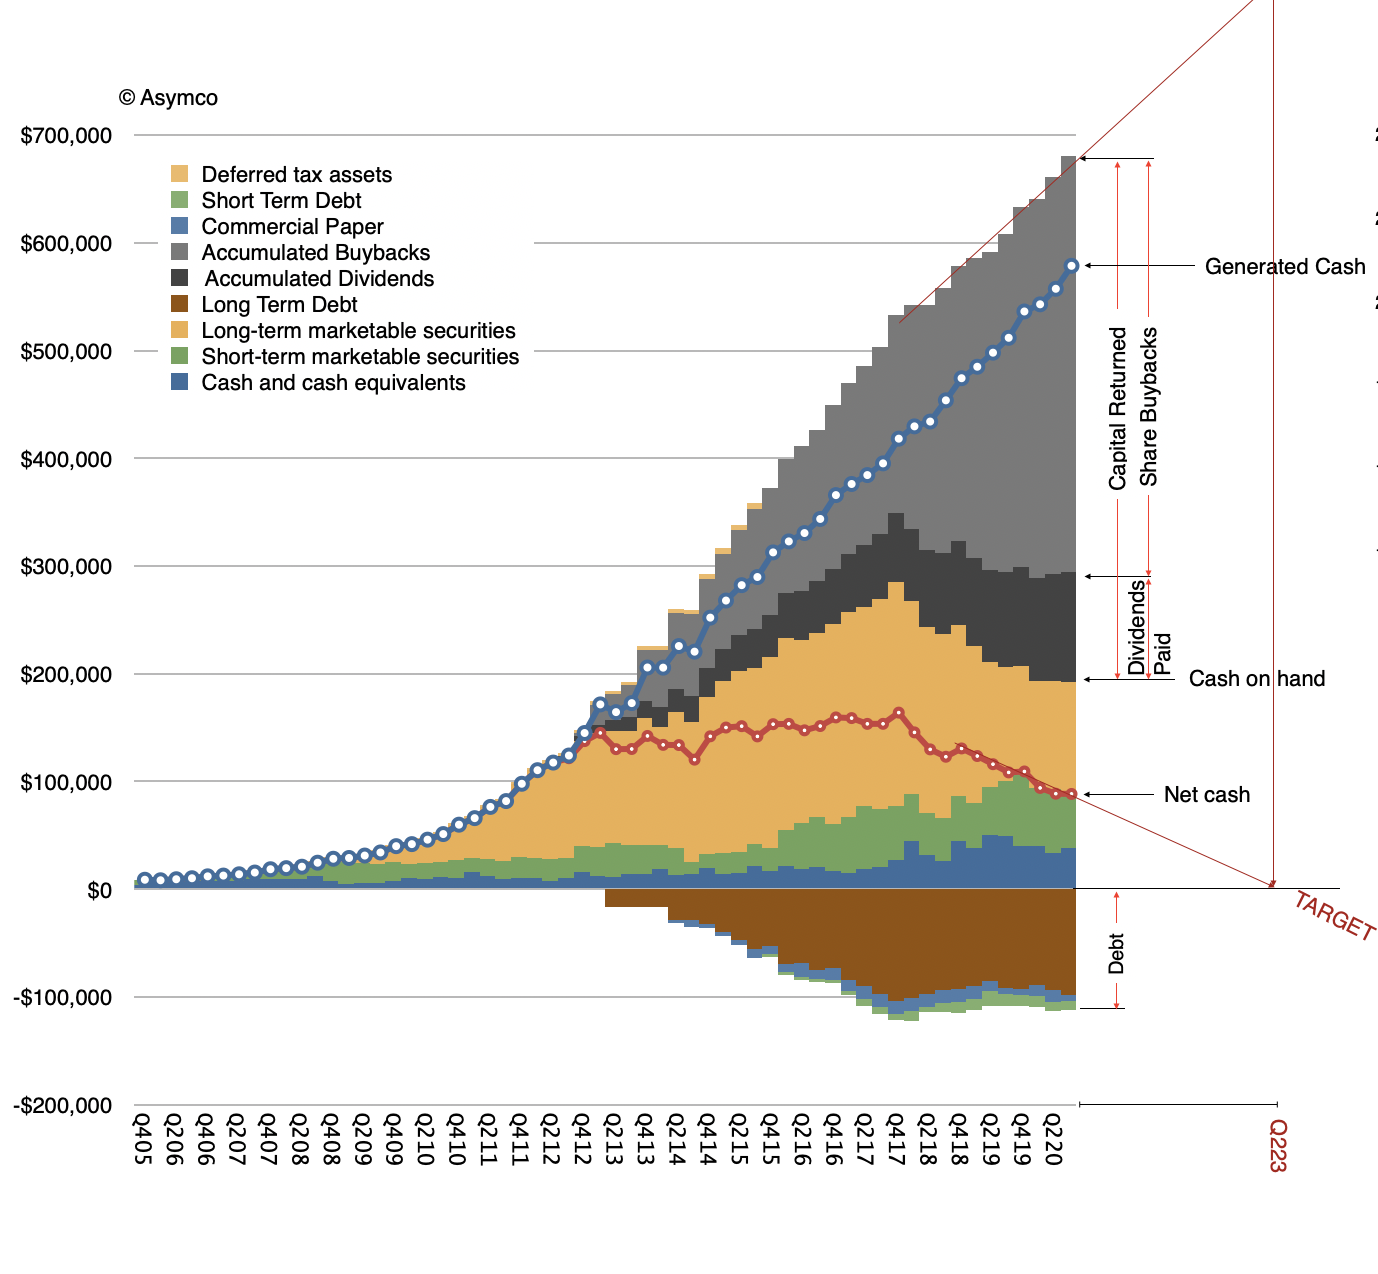
    Next, capital returns. The company is returning almost all the cash it generates and is reducing its cash balance. It has returned about half a trillion dollars to date. Dividends paid has reached $100 billion and share buybacks about $400 billion. This is the largest capital return in US history.

    The company has declared its intention to reduce net cash to zero. This means it will still have substantial cash due to loans in the form of bonds but no "excess" cash will be held by the company. This is in contrast to the strategy under Steve Jobs where he sought to keep as much cash on hand as possible due to the need to weather potential storms, Tim Cook's Apple is being very "casual" about cash.

    Steve Jobs had his reasons for hoarding cash. The company had been through periods of existential crisis. The absence of cash jeopardized its independence and it was something he vowed never to happen again.

    However if that strategy would be maintained to this day, as the graph shows, the company would have cash of nearly $700 billion today. It would make Apple the world's largest hedge fund, by far. Second only to a very few sovereign funds. Given a conservative cash preservation mandate it also means that that capital would largely go unrewarded because the return on it would have been minimal, negligible. Not to mention also the target it would paint on the company's balance sheet.

    So given the trajectory in net cash being so consistent, it's probable that the goal of net zero will be reached mid 2023.

    That leaves the question of what will happen at that time?

    The answer is nothing. Nothing will happen. The capital return programs will probably be ended and additional cash generation will be paid as dividends going forward. That's it.

    Rather than suggesting a change, the capital return program (and the R&D program) suggest a lack of change, consistency. The company management is anticipating a steady capital generation rate, a steady product roadmap (with predictable growth) and a steady customer base (with predictable loyalty).

    This future for Apple in 2023 may seem boring. But that's exactly the plan. This is a plan that the company management has been making for a long time and has been executing for a long time. The plan is to be boring on the business side but exciting on the customer product side.

    Consistency has been the characteristic trait of the Tim Cook era. It is a smoothing of seasonality with services. It is the clockwork delivery of product updates, regardless of macro and externalities. It is a growth in user base consistent for a decade.

    It is perhaps because more people believe that consistency is the future that we have Apple's P/E ratio now in-line with its peers. Paradoxically, being boring is what makes Apple shares so exciting today.

  10. A Long-Lens Look at Apple and Disruption—Part 1: Is Apple Disruptive?

    Research

    Recently, I met Farshad Nayeri and Dave Sundahl—formerly of Christensen Institute, now at Disruptive MBA (dx.MBA)—when the topic of M1 Macs came up. The result was a multifaceted conversation where we took a long-lens look at Apple & Disruption around three core questions:

    1. Is Apple Disruptive?
    2. Is Apple Overserving with M1 Macs?
    3. How does Apple defy Disruption?

    You can read part 1 of our conversation at A Long-Lens Look at Apple and Disruption on the dx.MBA blog.

  11. Organize Your Inbox (and Never Waste Time on Email Again) With SaneBox [Sponsor]

    Sponsor

    We’ve partnered up with Asymco to bring you an exclusive $25 credit for new users. Just sign up through this link.

    SaneBox is like a super-smart assistant who’s been with you for years and knows what’s important to you. It moves unimportant emails from the inbox into a new folder and summarizes them in a digest, where you can quickly bulk-process them. An average SaneBox customer saves 12+ hours/month.

    Additional features:

    • SaneBlackHole – Instantly unsubscribe from annoying marketers, mailing lists and newsletters
    • SaneReminders – Get a reminder if someone doesn’t respond to you
    • SaneSnooze – Snooze non-urgent emails
    • …and more features to enhance your existing email setup

    With glowing reviews from TechCrunch, Forbes, The New York Times and emailers everywhere, you can rest assured that you will fall in love with email again. And it’s risk free—cancel and your email returns to the way it was.