Asymco

Asymmetric Intelligence

Horace Dediu

  1. Margin Call

    Research · 95 comments

    During the fourth quarter 2012 Apple's margin fell to about 38%, a level not seen since two years earlier and down from a peak of 47% in Q1 2012. Does this lower margin foretell lower prices or a loss of competitiveness?

    Obviously not.

    Gross margin is a function of Sales (aka revenues) and Cost of Sales. Gross margin as a percent is calculated with the following formula: (Sales-Cost of Sales)/Sales. If dealing with a single product, Sales itself is the product of shipments and price/unit but since cost of sales is also a product of shipments and cost per unit, the shipments numbers cancel each other out and the gross margin reduces to the ratio of (Price-Cost)/Price.

    So a margin drop can only be caused if one of three things happened:

    1. Prices dropped
    2. Costs increased
    3. Both prices dropped and costs increased.

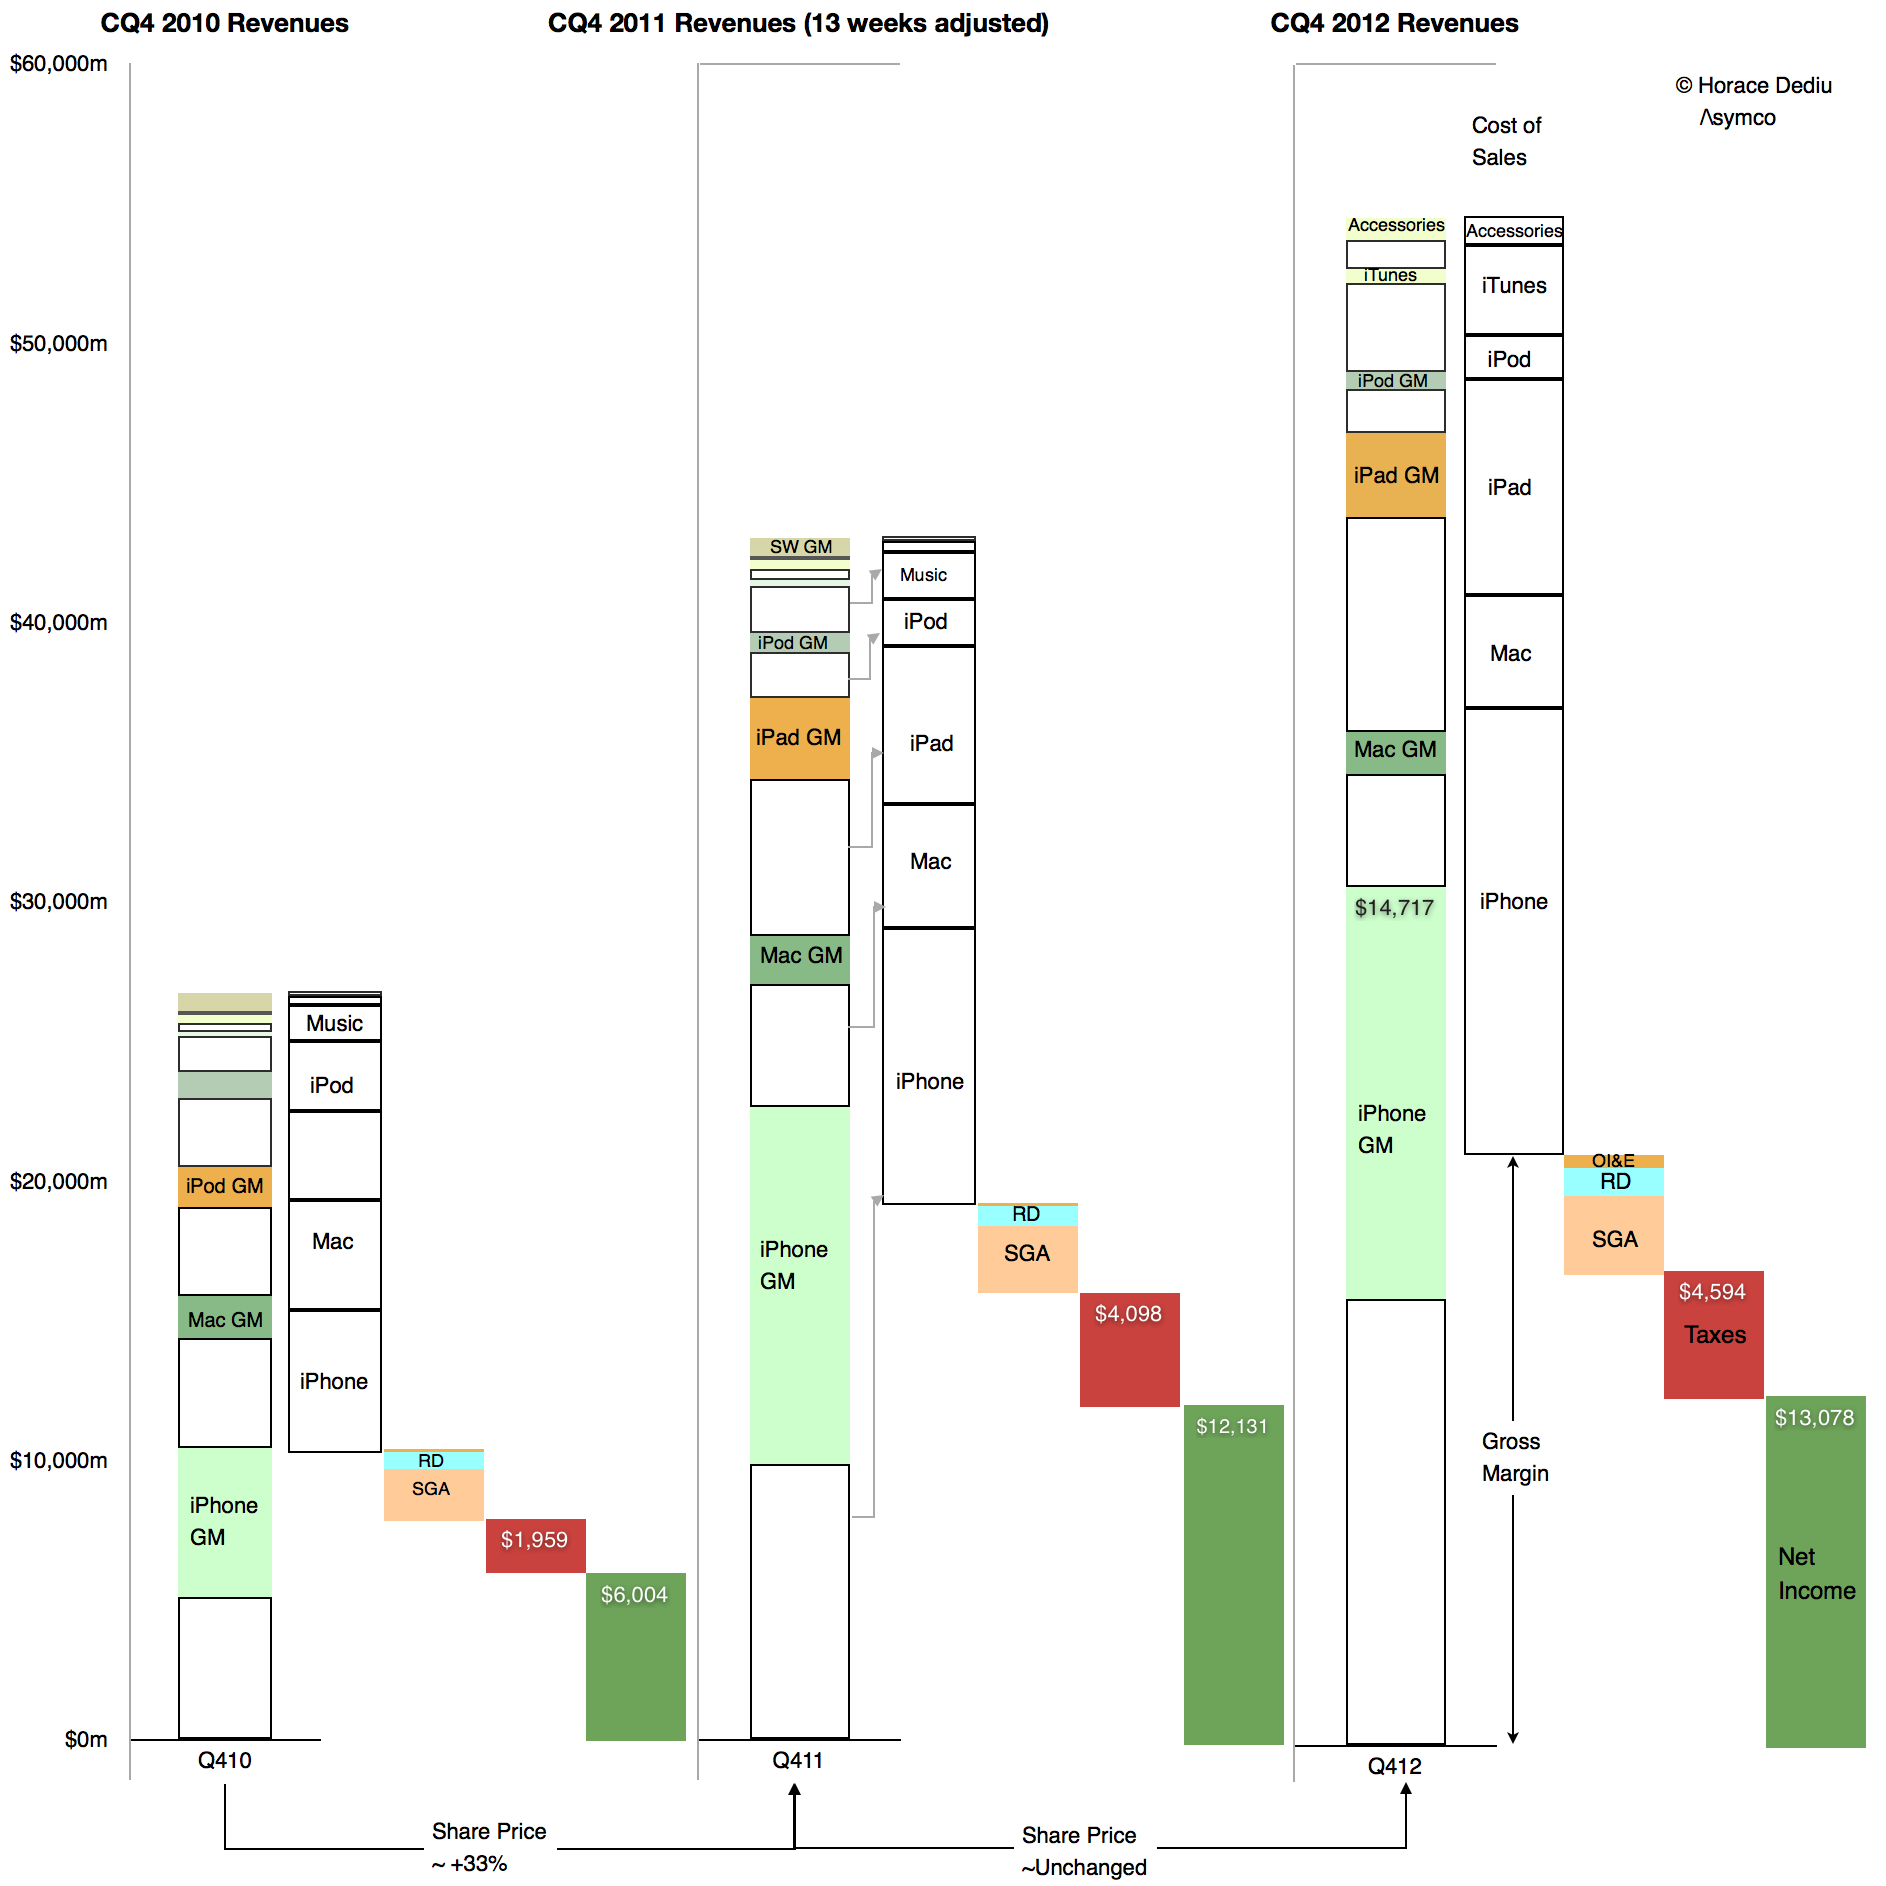
    We can easily find out which of these was the cause in the fourth quarter because we have volumes and prices for all of Apple's products. We can also derive total costs based a total gross margin. These are illustrated in the following retina-friendly diagram.
    Screen Shot 2013-02-05 at 2-5-11.25.16 AM

    The diagram shows Revenues, cost of Sales, Operating expenses, Taxes and Net Income relative to each other for the fourth quarters of 2010, 2011 and 2012. Of interest is the difference between 2011 and 2012. Note how the 2012 Gross Margin (absolute, not as a percent, identified with the arrow) did not change much from the year before. As Taxes and Operating Expenses did not change much either, the earnings were quite flat y/y.

    However note also that total sales increased quite a bit. As the gross margin (absolute) remained steady and sales increased the margin as a percent fell. But the cause is that cost of sales also increased. They increased faster than sales increased.

    Relative to adjusted 4th quarter 2011 Sales increased by 27% while Cost of Sales increased by 30.5%. Margins shrank in late 2012 because the products were more expensive to make.

    It's simple arithmetic.

    We can at a glance see that the cost of sales increased as a proportion of sales. Therefore the margin decreased as a percent of sales. The cause is higher costs, not lower pricing.

    In fact, pricing analysis was already performed and showed that they largely held steady (iPad being the only decline). If pricing is unchanged then competitive issues are not to blame. The supposed link between lower margins and some mythical loss of competitiveness can be easily disproved.

    But there's more.

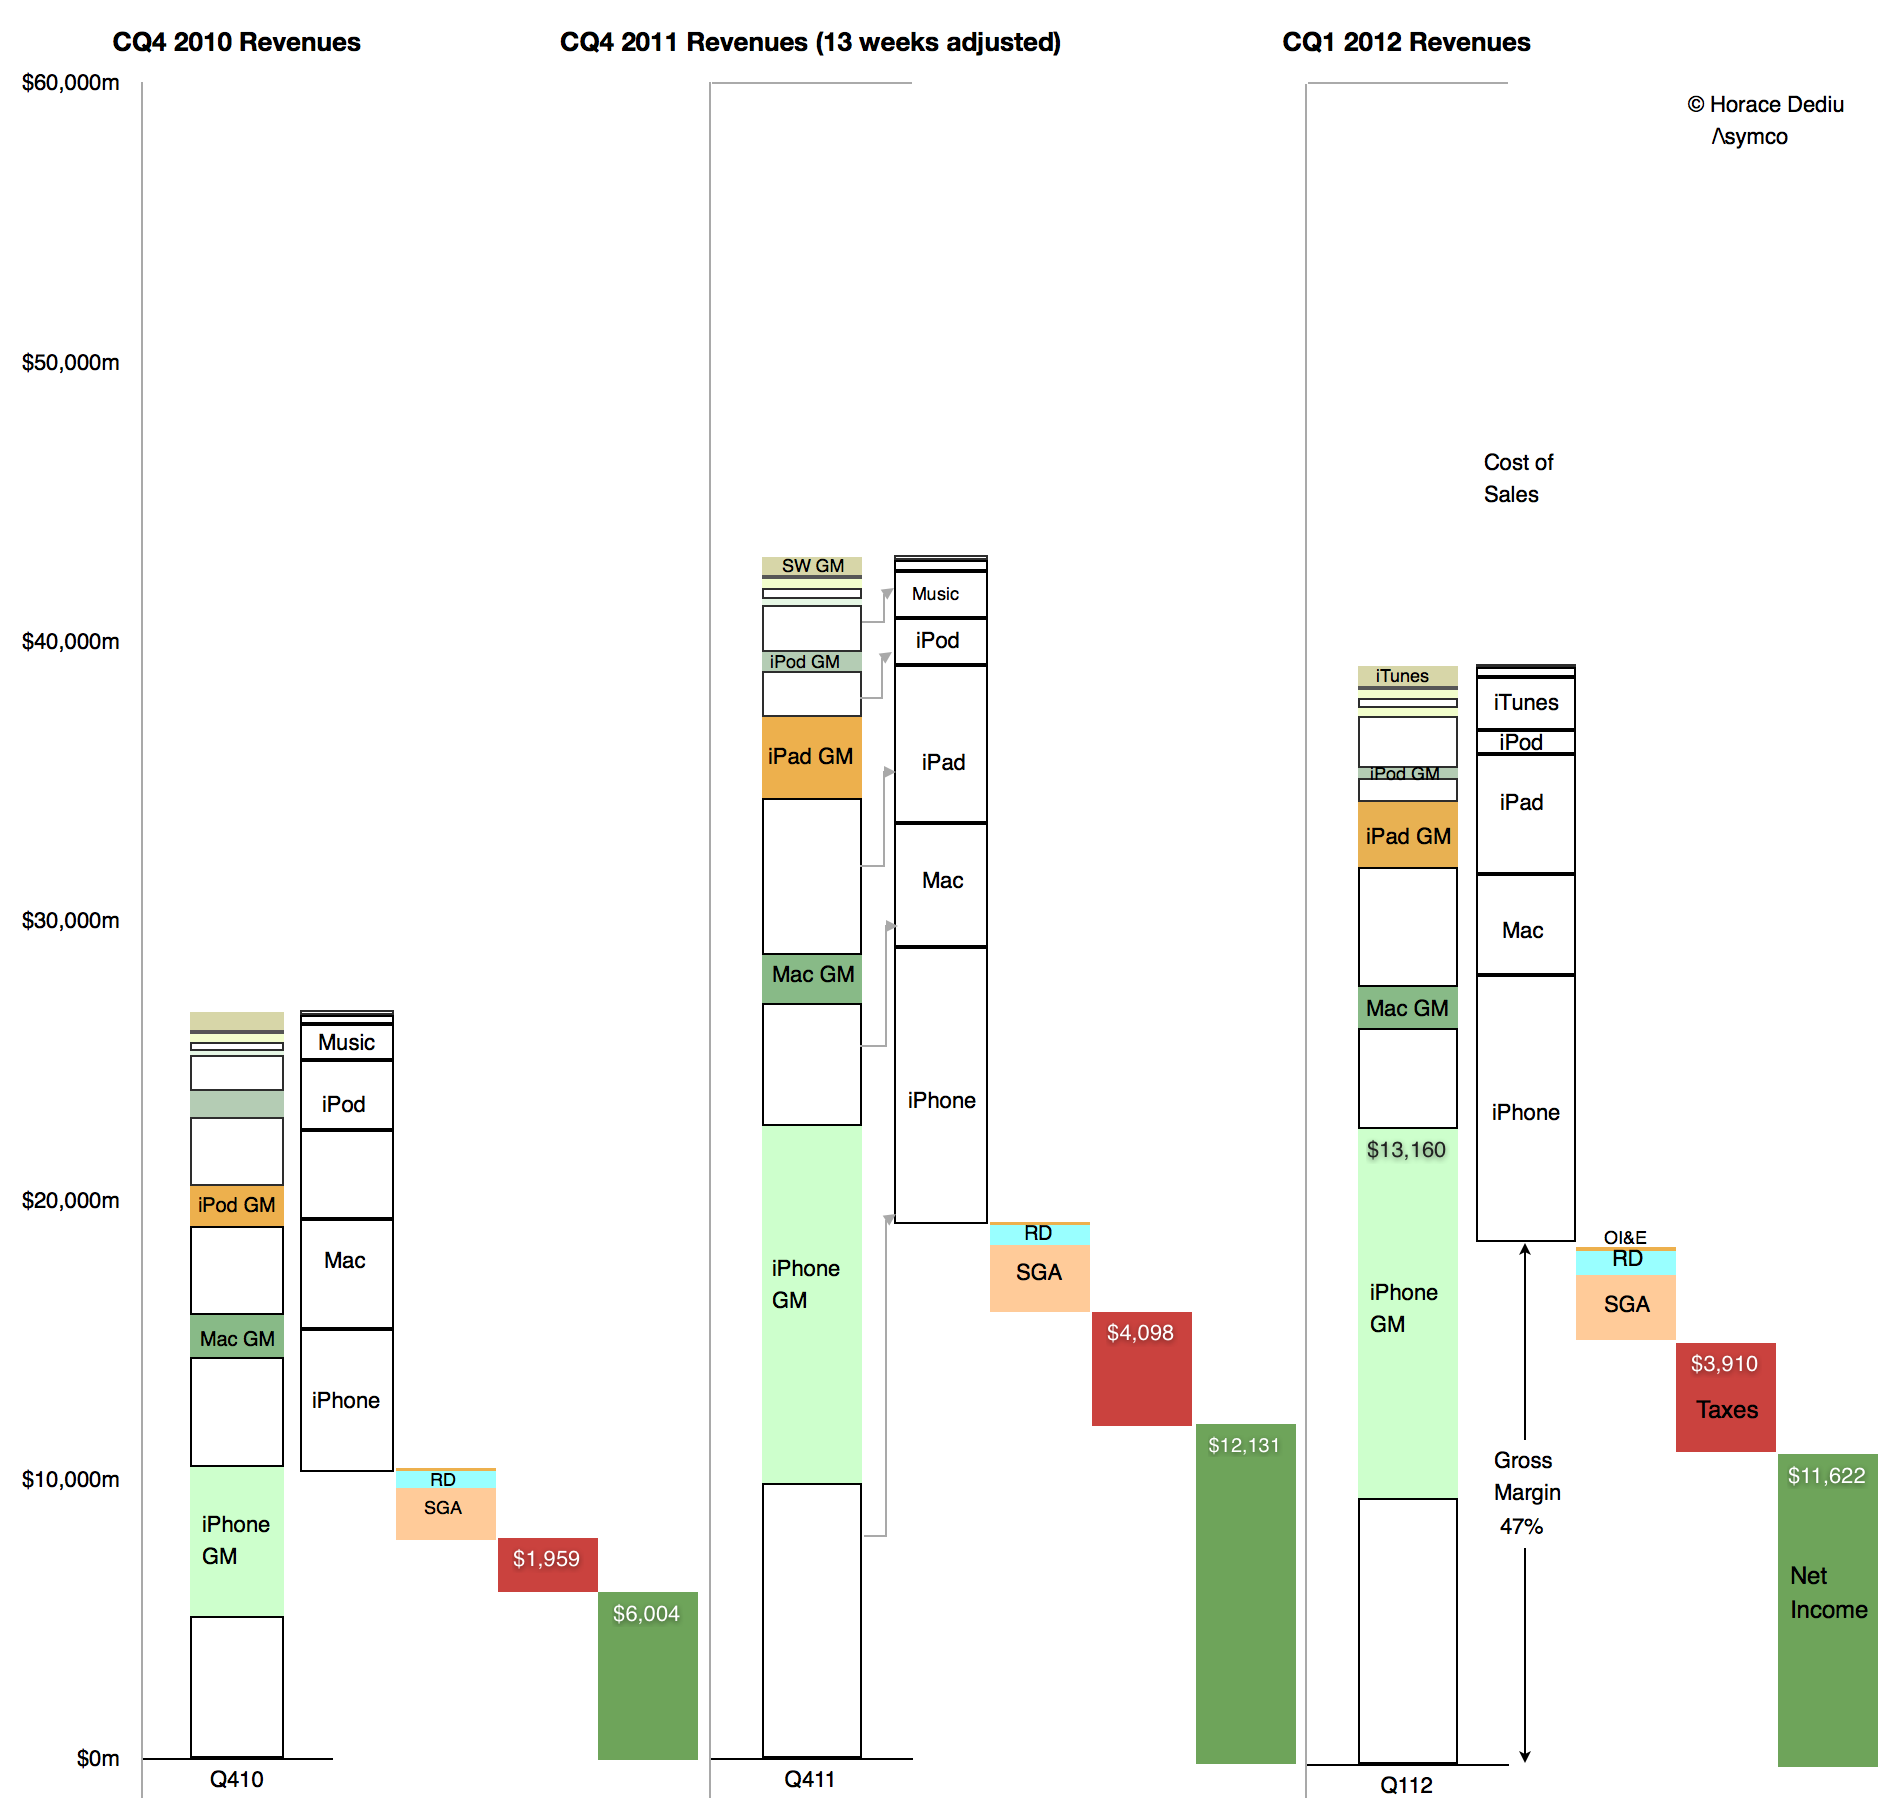
    There is an easily observed cause to changes in production costs. Consider  the opposite effect in the sequential change from the fourth quarter of 2011 to the first quarter of 2012:
    Screen Shot 2013-02-05 at 2-5-11.36.46 AM

    Here we can see how sequentially sales fell but gross margins rose. Again, the change in absolute Gross Margin was slight but the reduction in cost of sales was out of proportion of the reduction in sales. Cost of sales fell by 13% while sales fell by 9%. The result was an increase in gross margin from 45% to 47%. The cause was that the cost of production fell.

    Obviously. Because, as everyone knows, costs of production fall as output increases. It's due to something called the learning curve. It's something that has happened for all of Apple's (or anyone else's) product launches forever.

    What is not obvious is the effect this has on the share price whose changes are shown at the bottom of the first diagram. It's a case where one margin's fall has caused quite a few margin calls.
  2. Apple's Calendar Fourth Quarter 2012 Growth Scorecard

    Research · 19 comments

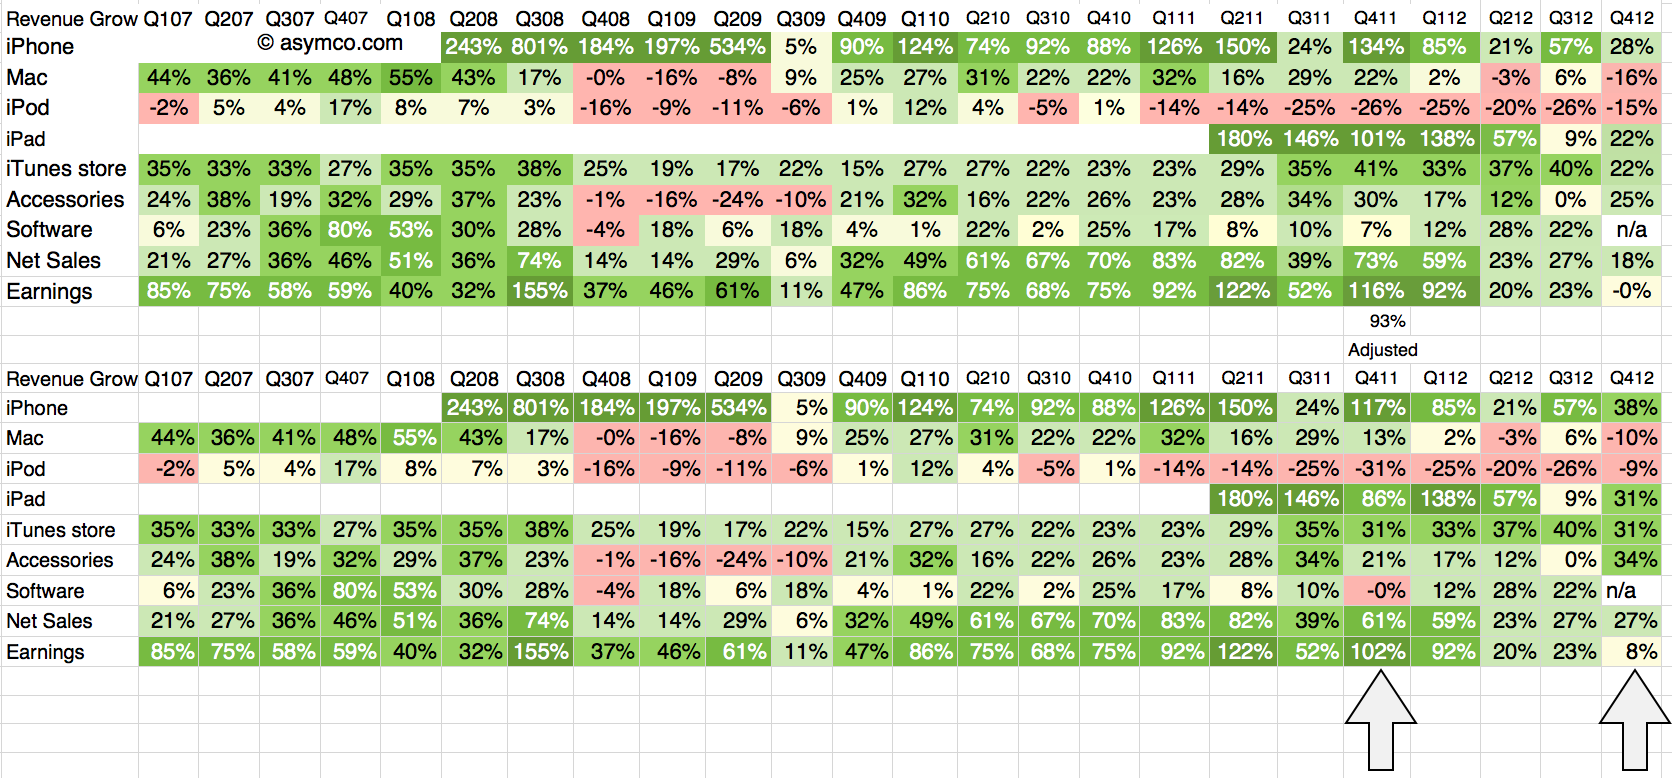
    The fourth quarter of 2012 was 13 weeks in duration while the fourth quarter of 2011 was 14 weeks. The difference implies that a comparison of revenues should be done with an adjusted 93% of the 2011 values. The growth for 4Q 2011 relative to 4Q 2010 should also be adjusted on this basis.

    The following tables show the unadjusted and adjusted growth rates. The adjustments apply to the bottom table and the columns highlighted.

    Screen Shot 2013-02-04 at 2-4-7.19.18 PM

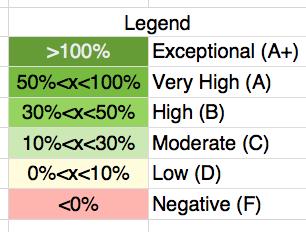
    As in previous scorecards, I used the following color scheme to "grade" the performance.

    Screen Shot 2013-02-04 at 2-4-12.14.53 PM

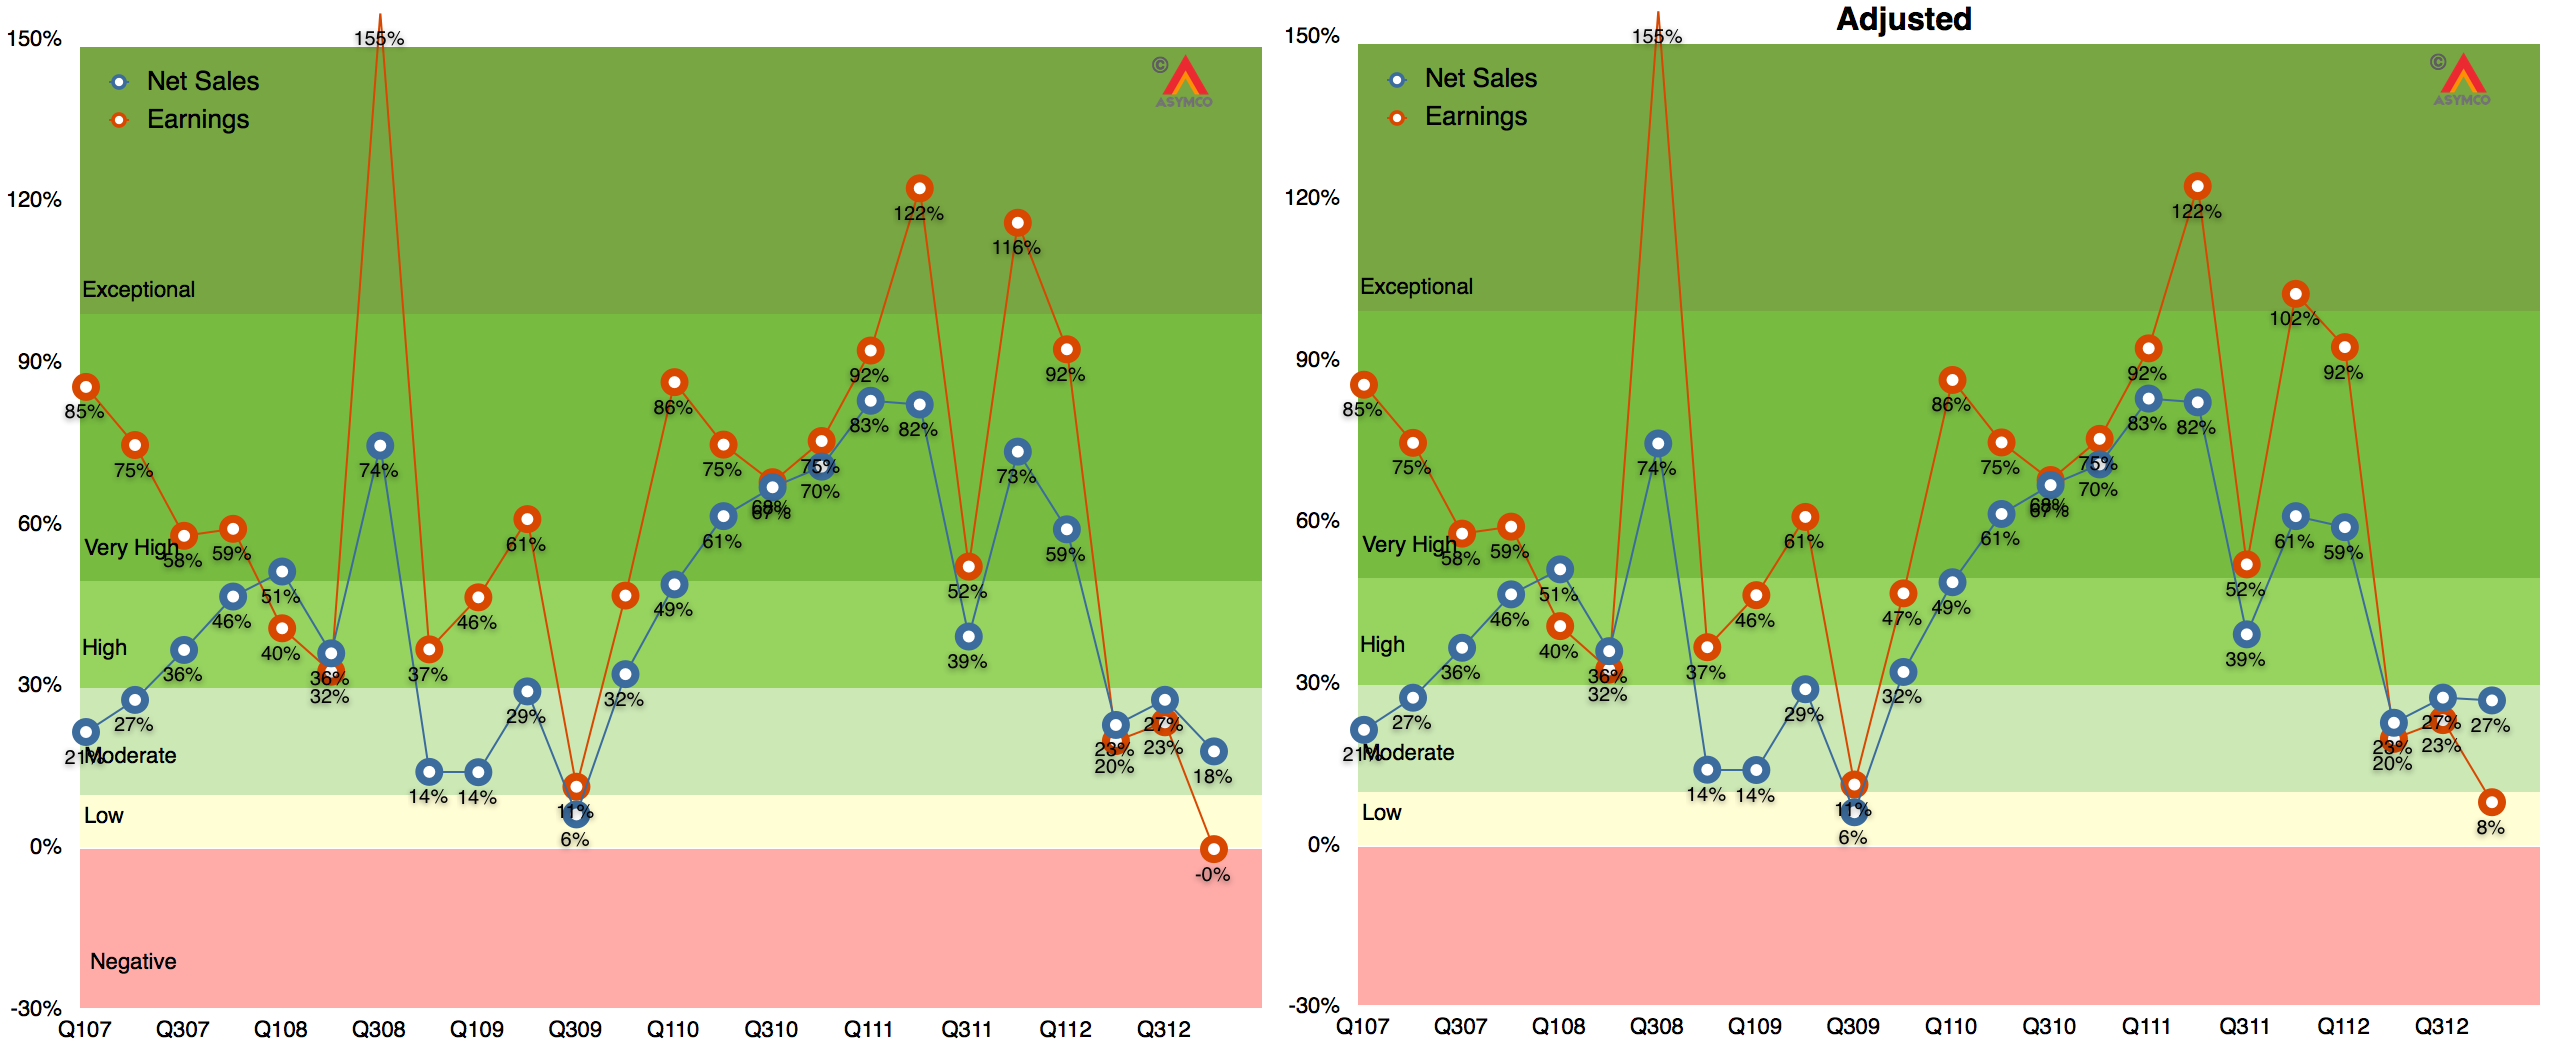
    The adjustment brings growth in sales to a respectable 27%, well above the 18% unadjusted level. In fact, using the color map grading system four lines increase their rating from "Moderate" to "High" growth: iPhone, iPad, iTunes, Accessories all move from the 20's to 30's  percent growth.

    The bottom line moves from 0% to 8% growth but it's still low relative to historic performance. That had to do with margins; more about that later.

    The graphs showing Revenue and Earnings growth with and without adjustments are shown below:

    Screen Shot 2013-02-04 at 2-4-7.21.34 PM

    Note that iPad, iPhone, Accessories and iTunes/Software are based on re-stated figures.

    Note also that the adjusted 2011 growth rates do not change dramatically with only iPad changing from Exceptional to Very High.

  3. It's a wrap. Asymconf California

    Research · 29 comments

    My thanks to all those who made Asymconf California the best Asymconf ever. We had over 200 attendees and, for the first time ever, 50 workshop participants and a panel session. The venue was spectacular: IBM's historic Almaden Research Center and special thanks to Paul Brody of IBM for making it available.

    Engagement was stronger than ever and I believe we moved the ball forward on a range of topics: The workshops helped solve some of the mysteries related to Amazon valuation and the main event looked at the limits of growth. The State of the Union took a look at the post-PC world and Apple's inflection point. The panel session took on the future of TV and, including the audience, we had input from some of the most influential companies in the space.

    We will scramble to make the proceedings (in the form of an iPad download) available as soon as possible.

    Normal blogging and tweeting will now be resumed.

  4. The job the iPhone is hired to do

    Research · 94 comments

    In the latest quarterly report Apple changed how it reports product revenues. In previous quarters the iPhone and iPad were reported including accessory revenues while iPod accessories were reported under "Music" revenues.

    "Under this new format revenue from iPhone, iPad, Mac and iPod sales is presented exclusive of related service and accessory revenue […] revenue from all Apple and third party accessory sales is presented as a single line item [Accessories.]"

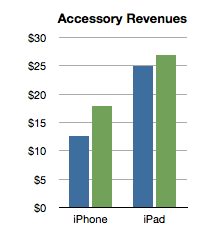
    Apple provided a document showing re-classified product summary data.  By measuring the difference between original revenue and re-stated revenue per product we can determine how much service and accessory revenue was being attached to each product.

    I did this for two quarters as a sample:

    Screen Shot 2013-01-24 at 1-24-2.16.14 PM


    The analysis shows that the iPhone has been receiving about $15 of accessory attached value and the iPad about $25. Interesting trivia, but how is this insightful?

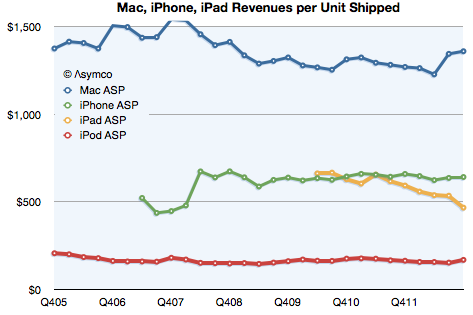
    Consider the impact on this analysis of revenues/unit shipped:

    Screen Shot 2013-01-24 at 1-24-2.31.52 PM

    The iPhone obtained about $642 revenue/unit (shown above as the last datum in the green line). That compares slightly lower with last year's $659/unit. However, the latest quarter is on the new basis and the data in the chart above shows old basis.

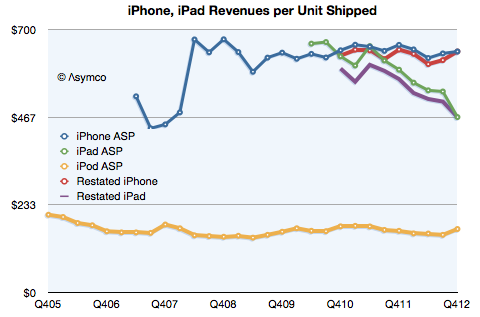
    Here is the data with re-stated iPad and iPhone ASP:

    Screen Shot 2013-01-24 at 1-24-4.29.37 PM

    On a re-stated basis, without the extra revenue from accessories, the iPhone "ASP" (Average Selling Price) from a year ago becomes $646 (which, again, is not what is reflected in the graph). This is almost exactly the same as the current quarter. The iPhone "ASP erosion" therefore goes from 2.6% to only 0.7%.

    Similarly, the iPad shown at $467 in the latest quarter does not drop from $593 last year but from $568. Its ASP erosion becomes 18% rather than 21%.

    Interesting resilience with the iPhone and slightly better support for the iPad price. What does it mean?

    Pricing power is the most important indicator of differentiation and it implies an ability to create value in excess of cost. Not only that but it also indicates whether a product is being "commoditized" by over-serving the market and being substituted by lower priced alternatives.

    In the case of the iPhone the tenacious retention of its ASP indicates that the point of over-service has not been reached. Buyers are not yet switching in significant numbers to the older, cheaper variants available from Apple. If they were we would see evidence in the price first due to the change in mix.

    Contrast that with the iPad where there is a far more marked erosion. That's due to the introduction of the mini which is good enough to substitute for the larger version for many of the jobs it's hired to do. We can safely argue that the iPad is good enough in smaller form factors and addressing larger markets.

    But why isn't this happening to the iPhone? Why isn't the iPhone n-1 "good enough"? Surely consumers can do almost the same tasks with an iPhone 4S as they can with the 5. Why are they still buying the new phone?

    The clue comes from the fact that the consumer is not the only buyer. It's  operators who buy and re-price the product. They are hiring the product to sell broadband and the newest variant is still the best hire to do that job. This observation is crucial to understanding the growth dynamics of the iPhone and consequently, of Apple itself.

    I repeat what I've mentioned before: The iPhone is primarily hired as a premium network service salesman. It receives a "commission" for selling a premium service in the form of a premium price. Because it's so good at it, the premium is quite high. Also because it's so good, it gets bought in large batches which allow Apple to schedule production efficiently.

    This understanding gives us a solid basis from which to evaluate its growth potential.

  5. What's up with text messaging?

    Research · 21 comments

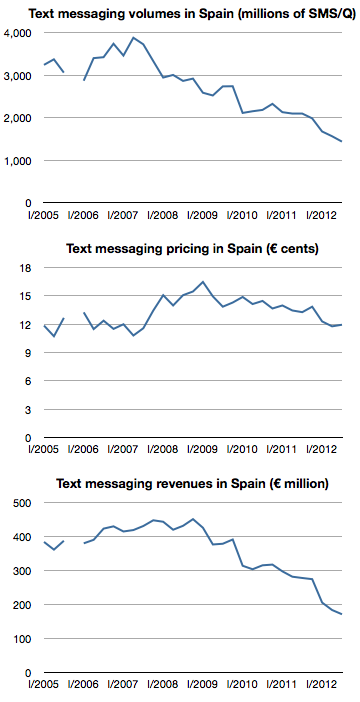
    The following graphs show text messaging volumes, pricing and revenues for SMS in Spain.

    Screen Shot 2013-01-18 at 1-18-2.40.39 PM

    After peaking at the end of 2008 at about €450/quarter, revenues have fallen by 60% to about €171 million in the third quarter of 2012. These figures represent almost 100% operating profit for operators so the impact is felt directly in the bottom line.

    The culprit is IP-based messaging. Services like Whatsapp, iMessage and even Facebook offer "free" messaging to users who have a smartphone and a data plan. I've been told that 97% of Spanish smartphone users have Whatsapp installed. In some markets this "free" messaging is offered via BlackBerry Messaging.

    The decline in SMS is coupled with a vast increase in IP-based mobile messaging. Whatsapp reported that it set a record of 18 billion messages processed over New Year's Eve. In October Apple announced that iMessage had delivered 300 billion messages during the preceding 12 months.

    Globally SMS traffic is still rising. It's expected to reach 9.6 trillion in 2012, but at least one analyst forecasts  that SMS’s share of global mobile messaging traffic will fall from 64% in 2011, to 42% in 2016.

    The data from Spain suggests that the drop may happen more quickly than anticipated.

  6. The iPhone MOQ

    Research · 21 comments

    [Kaoru] Kato, president of NTT DoCoMo Inc., said that the firm would want to add the iPhone to its lineup of serviced smartphones if it could form a mutually beneficial contract with Apple, Inc.

    Apple requires that carriers servicing its devices sell a fixed amount per year. Katō said that his company could handle such quotas if iPhones accounted for approximately 20%-30% of its overall smartphone sales.

    via NTT DoCoMo President Interested in Servicing iPhone — BrightWire

    When thinking about an iPhone launch, especially with a new operator, the crucial question is what is the minimum order quantity (MOQ). Some of the iPhone production is sold direct (as in the case of orders coming from Apple's online store) but the majority of units are sold via operator who order in batches.

    This issue came to light when Sprint's order was leaked in late 2011.  I discussed the order size at the time and put it in context. I concluded that Sprint MOQ was on average 7 million/yr., ramping with 4, 6, 9 and 12 million over a four year period.  I concluded that this was not a particularly aggressive gamble.

    Data published since then shows that Sprint actually sold 6.3 million during the first year, well ahead of my expected minimum order of 4 million and above even the expectations for the second year of sales. So far then Sprint and Apple gauged minimum demand quite accurately.

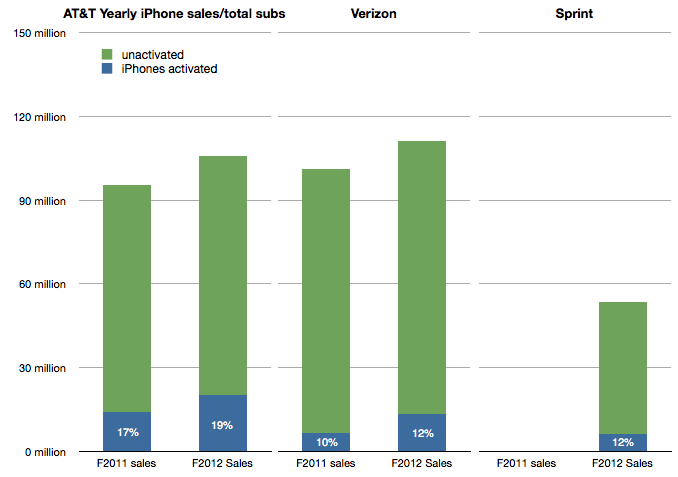
    I also showed that the Sprint MOQ was probably indexed off their sub base. I suggested that, based on subs data at the time, Sprint was committing to roughly 13% of its subs buying an iPhone every year. This was indexed off the data showing that 17% of AT&T subs were buying iPhones every year and 10% for Verizon. (I also assumed that this run level would be ramped over time).

    The updated totals for the 12 months ended October 2012 are 19% of AT&T subs purchased an iPhone, 12% for Verizon and 12% of Sprint. The performance is shown in the following graph:

    Screen Shot 2013-01-17 at 1-17-3.33.10 PM

    Which leads us to think about how the MOQ for the iPhone is calculated. If we assume Sprint and Verizon performance is typical it would imply that an operator like DoCoMo would be required to purchase iPhones at the rate of about 10% to 12% of its sub base each year, modulated to some degree by a ramp.

    NTT DoCoMo had 60.7 million subs in September 2012. 10% is about 6 million. Is Mr. Kato's quote above of 20%-30% of smartphone sales consistent with this?

    In an earlier interview (in July) Mr. Katō also stated that the target for smartphone sales in the year to March 2013 was 13 million. 30% of that would be 4 million units.

    This suggests that the iPhone MOQ for DoCoMo is only about 6% of subs. (4 million) Perhaps this is the basis of negotiation for an iPhone deal. Apple may have held out for 10% subs/yr. with Sprint on the basis of performance of the iPhone in the US but might be willing to settle for 6% subs/yr with DoCoMo, at least for the first year.

    The MOQ figure as percent of subs for China Mobile would also be an interesting point of debate.


  7. The race to a billion—2012 Update

    Research · 63 comments

    I last looked at the race to a billion in March 2011. Since then, I've been updating and adding data to the set giving a broader selection of platforms to compare.

    Before we dive in, an explanation: the initial review excluded Windows (PC) and Facebook mainly because (a)  the ramp scale I'm using is about a decade in duration and (b) I was reluctant to compare platforms that require payment to join to those that don't. The (DOS/Windows) PC ramped over several decades (starting in 1981) and Facebook is a service that costs nothing to join. There was much gnashing of teeth and shaking of fists as a result.

    Therefore, in the interest of inclusion, I added both to the data set and let the chips fall where they may.

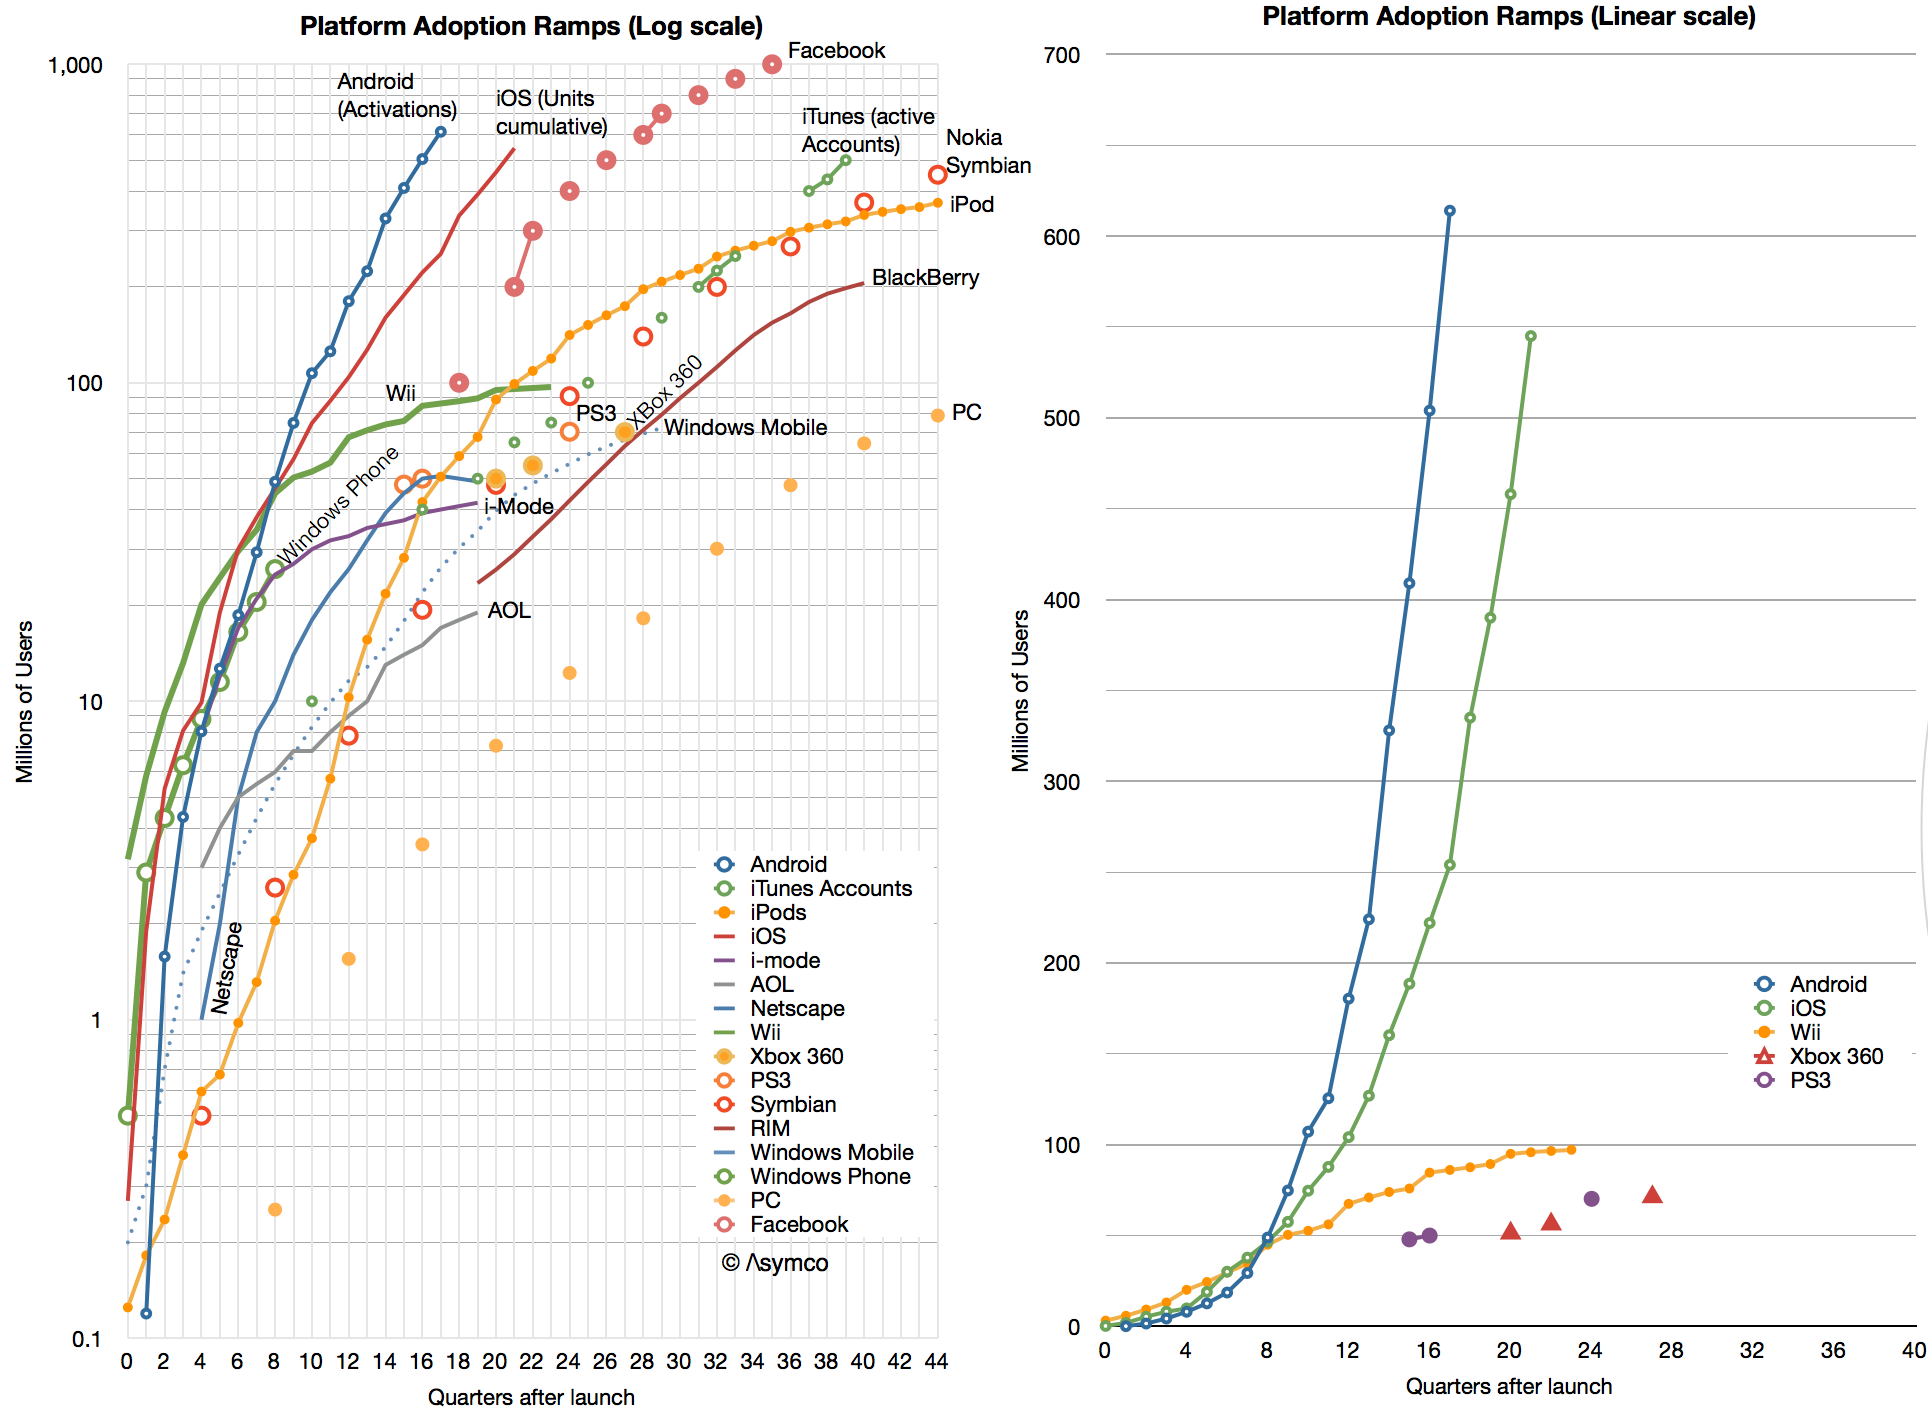
    The data is shown below.

    Screen Shot 2013-01-16 at 1-16-2.11.50 PM

    I kept the scale to about a decade so that individual lines can be resolved. As a result, you'll note that although Windows reached one billion first it did so slowly enough to be off the scale shown. Indeed, the "race to a billion" should be titled  "The race to one billion users in less than a decade".

    In such a competition, the winner would be Facebook which, in October 2012, 35 quarters after launch, reached the finish line. The second looks to be Android (probably this year) and the third iOS (sometime next year.)

    That may sound like the end of it, but what the graph also shows are the more subtle trends:

    • Game consoles seem to saturate at below 100 million total. One can see the difference in ramps between recent mobile platforms and consoles in the second chart. There might be implications for which platforms will end up dominating the entertainment industry. There should also be some explanations of why consoles are so limited.
    • iTunes accelerated with iOS and left the iPod behind. This is unsurprising but it shows that a content platform can be more flexible than one attached to any particular device or architecture. An important lesson perhaps for those in the content businesses.
    • Early mobile platforms like Nokia's Symbian, RIM BlackBerry and Windows Mobile have faded indicating that there was no early-mover advantage in platforms. The same can be said for early PC platforms.
    • Windows Phone began by tracking the Android/iOS ramps but seems not to be accelerating into its second year in a way that implies potential parity.
    • Although Facebook did reach 1 billion rather quickly the slopes of Android and iOS indicate that they may overtake it in overall ecosystem size.

    One billion is significant in several ways: First, because it is the "high-water mark" set by Windows and signifies what a global platform needs to become to be essentially "universal". Second, because it implies sustainability. A threshold perhaps from which network effects are sufficient to sustain (assuming some switching costs and an ability and willingness to adapt e.g. software, content or time investments from users.) Third, because it implies sufficient value to the ecosystem (assuming a monetization mechanism exists e.g. Windows software developers and IT managers.)

    Looking beyond this milestone however, there is no reason why it should be thought of as a barrier. Mobile connections number over 5 billion and computing is likely to reach most of them. Therefore one billion may turn out to be only 20% penetration. In fact, I expect this series of posts will need to be updated in 2013 as "The race to two billion."

  8. Measuring iPhone 5 vs. iPhone 4S availability

    Research · 54 comments

    In 2011 Apple increased the availability of the iPhone by adding operators. In 2012 Apple increased availability by bringing the phone to operators more quickly. The question is: how much did iPhone 5 availability increase, exactly?

    There is a way to find out. As an approximation, Apple periodically reports the availability of new iPhones by country. For example, Apple stated that they reached 100 countries for the iPhone 5 before 2012 ended. They also gave similar launch data for the iPhone 4S. Graham Spencer did a good job showing how country roll-outs changed over time.

    However, country-level availability is not ideal because countries vary greatly in their ability to absorb iPhones. Announcing availability in Mauritius is not nearly as important as announcing Madagascar. A better measure would be to track the countries' populations being added, or, better still, the populations which subscribe to operators who have a distribution contract with Apple.

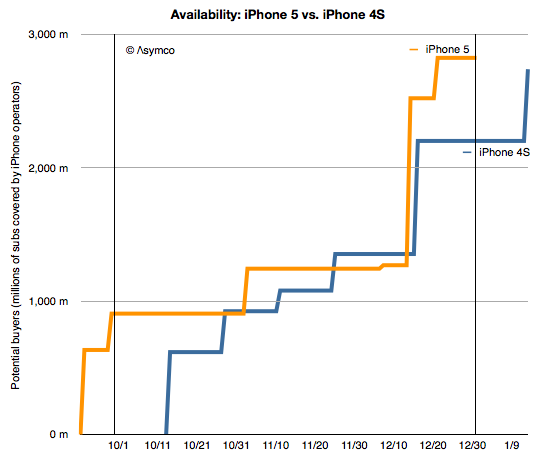
    Which is what is shown in the following graph:

    Screen Shot 2013-01-15 at 1-15-2.29.36 PM

    I plotted the "potential buyers" as the number of subs addressed by iPhone-carrying operators in the launch countries according to the time when the launches happened. I did so for the iPhone 4S in 2011 and the iPhone 5 in 2012[1].

    Now we can address availability as the area under each of these lines.[2] The figure for the iPhone 4S adds up to be 100 billion "subscriber-days"[3] and for the iPhone 5 it's 130 billion subscriber-days during Q4 2011 and Q4 2012, respectively.

    That's a handy measure: the iPhone 5 was 30% more available than the iPhone 4S. The big contribution was having China and Indonesia available during the fourth quarter rather than in January 2011.

    There are a few observations which follow:

    First, note that the increase in availability (area between the orange and blue lines) occurred both early and late in the quarter. The early period was mostly due to early launch in the US and the later period was due to earlier launch into China.  China buying patterns are different than those in the US due to differing festive seasons so the bulk of Chinese buying may not happen during the fourth quarter.

    However, delivery of product to China started earlier and there was a burst of buying (two million units in three days.)

    Production should follow the availability schedule so it would be sensible to reduce production once the pipeline is full. Note that supplier cuts rumors surfaced right around the increased availability date of mid-December. Last year the rumors surfaced in November.

    Increased availability does not always lead to increased sales but the iPhone 5 was constrained for longer than the iPhone 4S so it's possible that demand was therefore higher.

    Increased distribution does not always mean increased production. However, Apple's investment in production tooling doubled year/year so there is a possibility that production did increase.

    --

    Notes:

    1. Subscriber data is approximate. See addressable market discussion here.
    2. The measurements are for the calendar quarter only, as bounded by the vertical lines.
    3. A subscriber-day is a measure of availability where one subscriber has access to buy the product for one day.