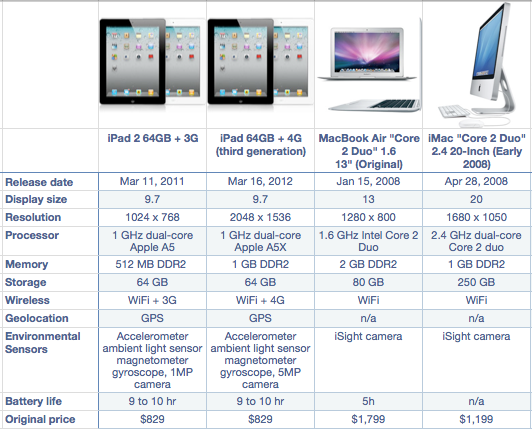
At last year's iPad 2 launch, I compared the specs of the newly announced iPad with those of a laptop and desktop from five years earlier. This year I am comparing the new iPad with Apple's computers from four years earlier:
The new iPad now exceeds the total display resolution, has similar speed and storage capacity while having twice the battery life of the thinnest laptop of four years ago. It also has very high quality cameras and GPS and cellular network connectivity which have yet to appear on mainstream PCs. It's still a lot smaller and half the price and has a larger selection of available software titles at prices a fraction of its elder cousin.
The only value that a desktop of 2008 has over a new iPad is the size of the screen and a larger hard drive.
The point is not so much that the usurper is a "better" computer but that it has come from non-existence to being a contender in two years. It is also narrowing the gap to its comparable ancestors by one year, every year. Arguably that gap now stands at four years.
Horace interviews writer/producer Dan Abrams. Dan talks us through the budgets and cost structures of independent movies as well as the obstacles to innovation presented by the current industry structure. We talk about some of the new concepts that are emerging as means to overcome these obstacles. We also talk about new forms of distribution and financing that enable long-tail film and TV content. Dan also talks about his upcoming mockumentary about the Global Financial Crisis (www.falseprofitthemovie.com).
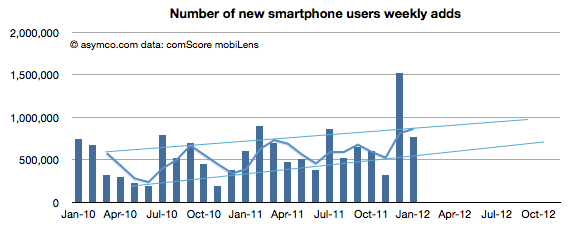
January saw a return to trend line growth in US smartphone add rates. The 767k/week rate is within the band after November's below- and December's above-the-line outliers. The weekly add rates are shown (with projection of trend) below:
The pattern shows a likely 1 million new smartphone users per week being added consistently by the fourth quarter of this year.
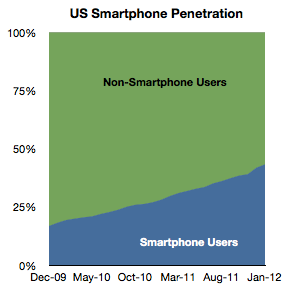
Overall, penetration of the sampled population (above age of 13, primary phone and excluding business purchases in the US) reached 43.3% in January. The increase was 1.45 points from December.
A significant 35 million US users switched to smartphones in the last 12 months, equivalent to 15% of the user population. My current forecast is that 50% of the user base would be smartphone users by June 28th.
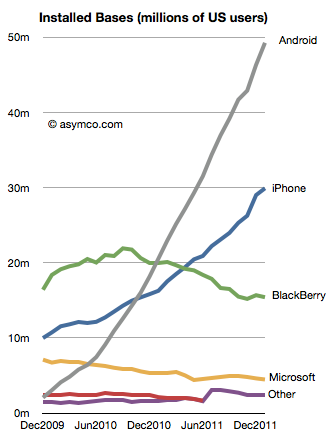
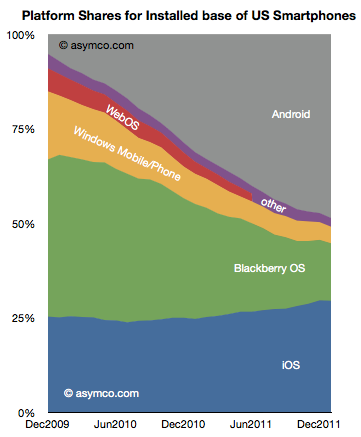
The platform data shows a continuing pattern. In terms of absolute users Android has reached nearly 50 million users, iPhone 30 million, BlackBerry 15 million and Microsoft (Windows Phone and Windows Mobile combined) 4.5 million.
In terms of market share of the smartphone population, the various platforms stack up as follows:
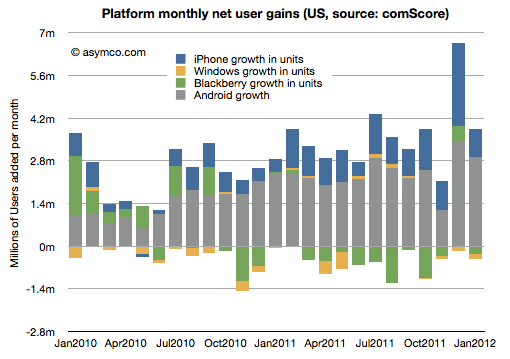
The net gains for each platform by month are shown in the following diagram:
RIM and Microsoft have continued to lose users while Google and Apple have continued to gain.
The two trends that continue are that overall penetration is nearing saturation and that two platforms seem to be increasing their share of that base. The "comeback story" for any of the hopefuls will depend either on switching users away from their current platforms of trying to engage with late adopters. The first option is daunting due to latent network effects related to platforms and the second sounds to be symmetric to existing incumbent strategies.
Without an asymmetric approach, the challengers are unlikely to succeed.
This is a reminder that I will be speaking at the Apple Investor Summit on March 15th at the Los Angeles Convention Center. My topic will be Apple's capital expenditure structure and how that foretells strategy. I will present previously unpublished data and review the likely scenarios for 2012 iOS device production. As I prepared it I realized that with only 45 minutes there is a limited amount of detail I can provide.
To remedy that and to offer an opportunity to have a detailed question and answer session on related topics, I decided to offer a workshop-like reception at the end of the day. The time would be around 6:30 PM on the 15th and last at most two hours. The location will be in the vicinity of the LA Convention Center.
If you are interested in participating, please let me know so I can decide the type of venue to rent. Please also note that there will be a cost involved and pricing will depend on the number of participants. My current estimate is that the price will be $150 per person.
We've been very, very focused on China. China, we've had incredible success with iPhone. Over the past few years, we've gone from a few hundred million dollars of revenue in greater China, to last year $13 billion. So we really've been focused on trying to understand the market there and then taking those learnings to other markets. As it turns out--and not very many people agree with me on this, probably--but what I see is that there's a lot of commonality in what people around the world want.
People do want the same things globally, but due to various constraints they typically don't get the same things at the same time.
One of the most important constraints on the purchase of iPhones is the state of 3G (or, more broadly, mobile broadband) networks. An iPhone is a mobile computer whose primary value is derived from high bandwidth data communication. Because this bandwidth is not universally available, the iPhone faces a restricted addressable market.
The good news is that 3G networks are being adopted very quickly. The International Telecommunications Union reports that 20% of mobile users have "active subscriptions to mobile broadband" (1.2 billion out of 6 billion). That's encouraging but the subscription rate varies widely by country. Ideally we should look at the data on a country-by-country basis.
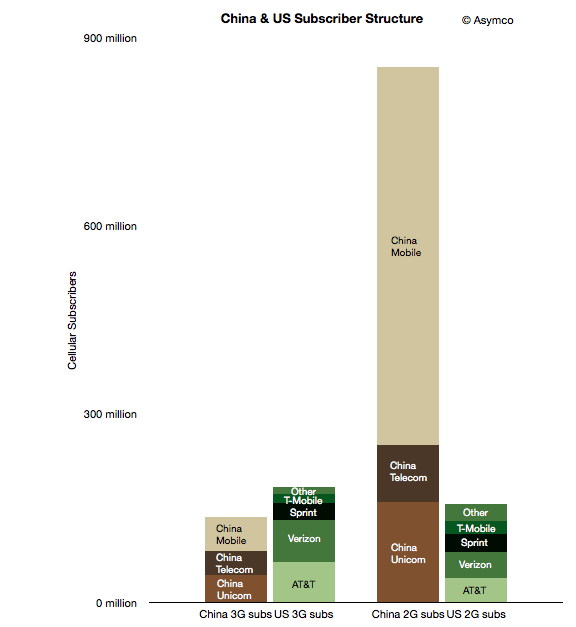
To start, I took a look at two countries which may form an interesting sample: the US and China. The following chart shows the subscriber structure in the two countries grouped by 2G/3G subscription and by operator.
The two left-most columns represent nominally addressable iPhone markets. The two right-most columns represent currently unaddressable markets. Note that
although China is a far bigger market, the lower 3G penetration means that the theoretically "addressable" market for the iPhone is smaller in China than in the US (136 million vs. 183 million respectively).
However, there are further restrictions. Apple does not have distribution agreements with many (most?) of the world's operators. In these particular countries, China Mobile, T-Mobile and "Other" US operators do not distribute the iPhone. We should subtract those operator customer bases out of the addressable market. But those conditions are variable: operators may sign up for future versions of the phone and 3G subscription rates are increasing. That means we can segment the market as follows:
Currently addressable operators and 3G subscribers
Potentially near term addressable users if all operators agree to distribute the iPhone in these countries
Potentially longer term addressable users if all users switch to 3G and all operators distribute the iPhone.
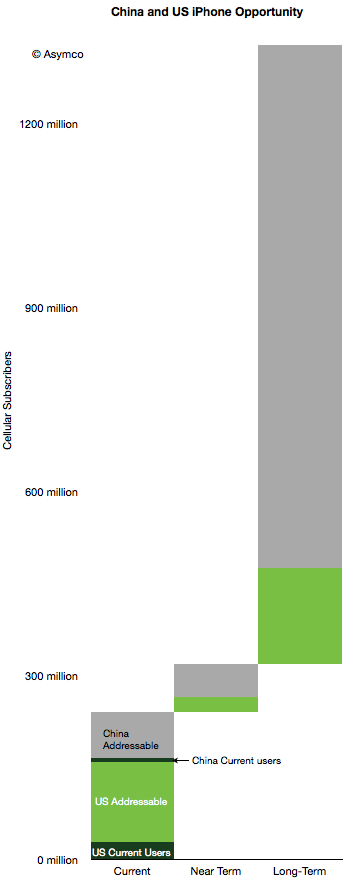
This segmentation leads to the following diagram.
I also added the current users given comScore data for the US (29 million) and an estimate of 8 million Chinese users. Here are some observations:
10% of China's currently addressable market is penetrated while the US penetration is 18%.
If all operators would agree to distribute the iPhone (i.e. including "Near Term" in the addressable total), the Chinese penetration would be 6% and the US 16%.
If we include all users as addressable, China is about 0.8% and the US is at 8.5%.
The penetration of the iPhone in the US and China combined therefore stands at about 3% today.
The question that comes next is what is a reasonable limit to total penetration? What can we reasonably expect or what could Apple reasonably target?
I've been using a global share of 20% as a reasonable target to test growth assumptions. Assuming no significant growth in user bases, 20% share in the long term (>5 years) yields a total of about 258 million users. That's equivalent to a 7x increase. Put another way, a 5x increase yields a market share of 14%.
Note that these are "penetration" figures or share of available users. This is in contrast to share of units sold in a given quarter. Apple has maintained 20% share of smartphones fairly consistently. If share of units sold in any given time period remains at or above 20% and if smartphones and 3G networks become ubiquitous then reasonable men might consider these targets obtainable.
We talk about how measurements of the market show an unprecedented growth in mobile computing and how that leads to a new context for computing along axes of non-consumption. That could result in devices becoming powerful enough to allow most people to be creative and reach self-realization.
I began by projecting growth rates of various market participants including the leading Windows PC makers (HP, Acer, Dell, Lenovo and Asus), the combined "others" and the Mac. I also added the iPad, Samsung's tablets, other Google sanctioned Android tablets and Amazon. I also projected a split between traditional and tablet Windows shipments.
The underlying assumptions are:
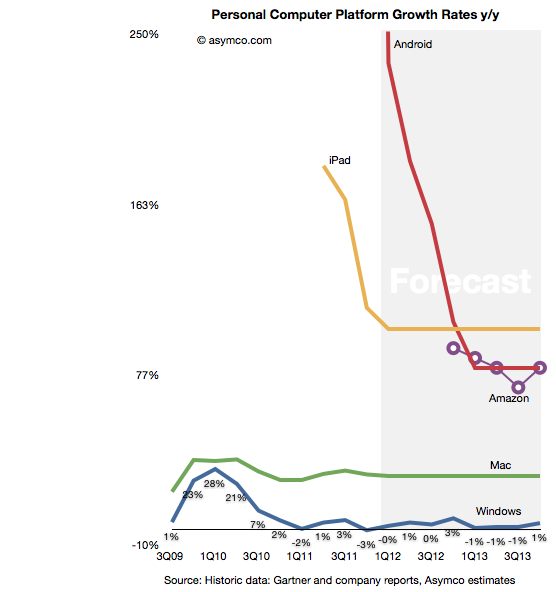
Mac growth continues at 25% as it has on average for a few years
Windows grows slightly in 2012 with the introduction of Windows 8 late in the year. However I anticipate Windows 8, including tablet versions, to mostly be upgrades with slow enterprise take-up within this time frame.
The tablet versions of Windows begin shipping in Q4 2012 with 7% of total Windows shipped. The ratio reaches 20% by end of 2013.
iPad growth will flatten for '12 and '13 at 100%, similar to iPhone's historic performance.
Android tablet growth will be significant in the current year and follow iPad growth pattern though settling at 80% during '13.
Amazon growth will be approximately 80%.
Building the platforms combined growth bottom-up gives the following forecast for the next two years (and historic growth shown for perspective.)
[FF = form factor]
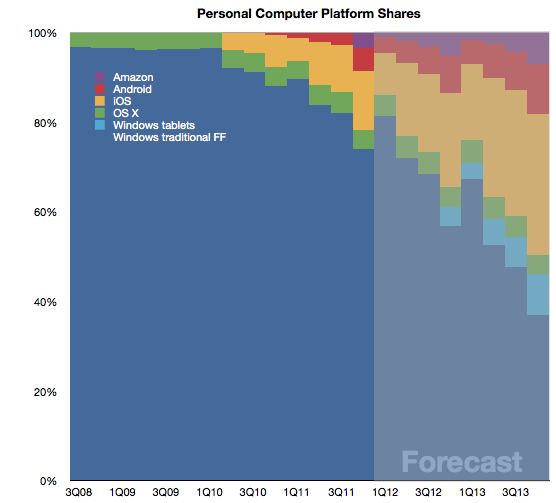
Given these assumptions, the day when the tablet market (by units) will exceed that of traditional PCs will come sometime in the fall of 2013.
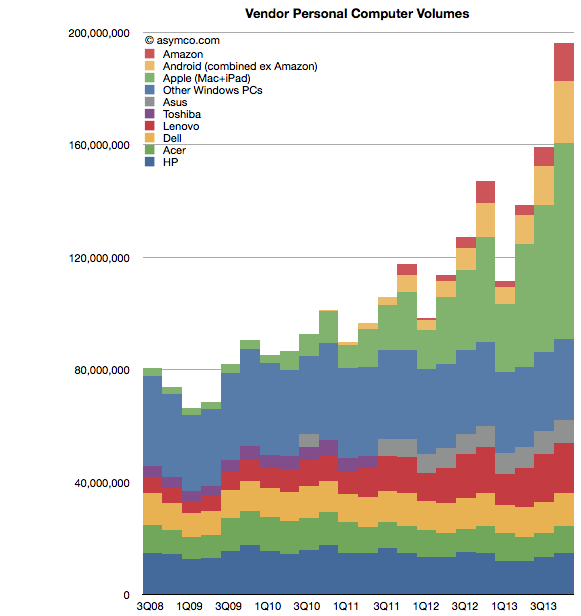
As yesterday's post noted, the tablet market will be additive. This can be seen in the vendor shipments forecast that accompanies the model:
When cellular phones emerged in the 1980’s wireline phone service was excellent. Penetration was at 99 percent in the United States and prices had never been cheaper. The industry was deregulated and phone companies were competing fiercely over long distance calling plans. In contrast, the new cellular phones were not “good enough” on the basis of what was considered necessary for making critically important phone calls.
Sound quality was poor, coverage was spotty and battery life measured in minutes. But they allowed a whole new consumption model of communication to emerge. They allowed a caller to call a person not just a place. Over time, this simple value proposition caused a powerful profit formula to emerge. That formula led to extremely rapid improvement in the quality of the network and devices that connected to it.
It caused such a cataclysmic change that twenty years hence it became possible (even natural) for consumers to “cut the cord” and abandon wireline communications altogether. The “excellent quality” wireline industry was dead to be replaced by the "good enough" wireless industry.
One consequence of mobile telephony was increased consumption. Voice call minutes increased dramatically because calling could happen anytime from any place. While overall consumption increased, landline use decreased. Then came messaging of various types. Forms of communication enabled by cellular networks that simply did not exist before with landlines.
As a result there were vast pools of profits available to telcos that seemed to appear out of nowhere. SMS and data plan income was beyond anyone's ability to forecast in the 1980s.
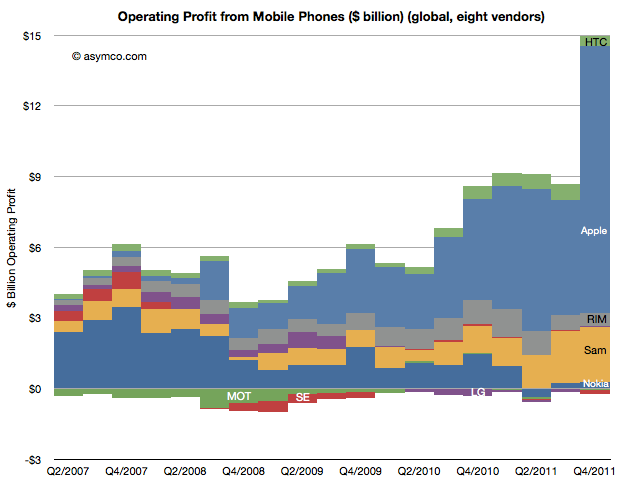
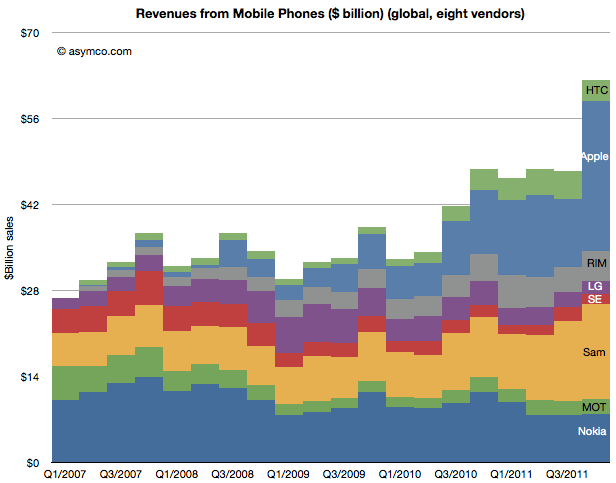
The same phenomenon is happening with smartphones. Consider a proxy measure: operating profits from mobile phones since the iPhone launched, illustrated below.
Although Apple went on to capture 75% of the profits, it did so from a vastly expanded profit pool. A similar picture emerges from an illustration of revenues:
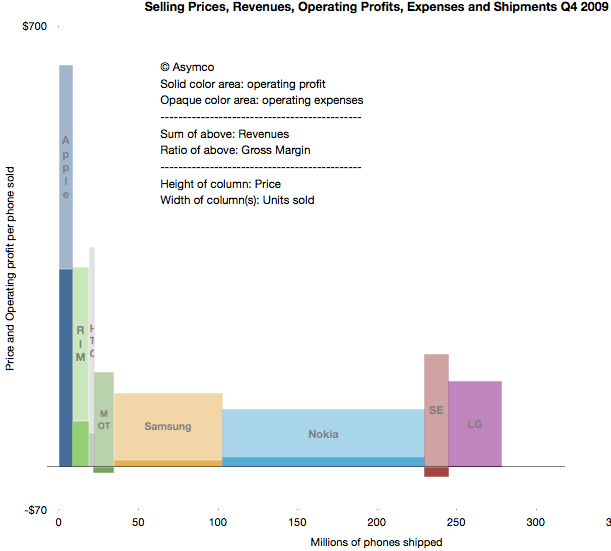
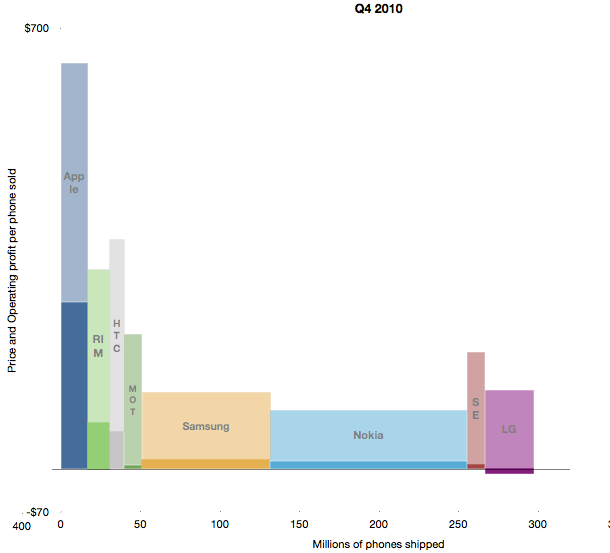
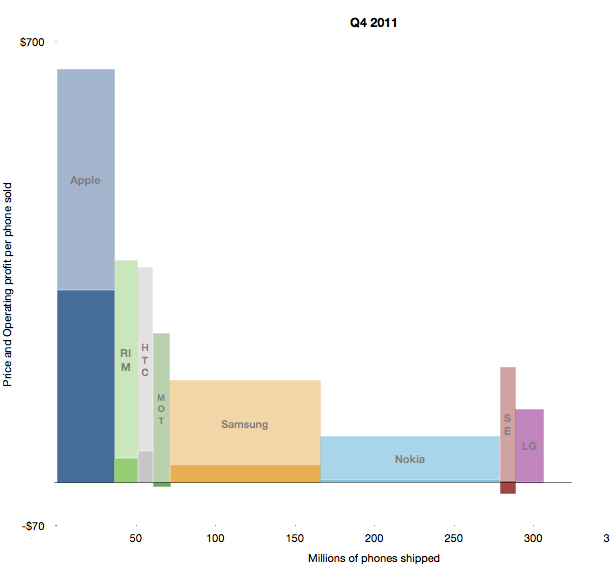
Another way to visualize the evolution of the market is to look at the combined price, profit margin and volume areas for the fourth quarters of 2009, 2010 and 2011.
Scanning from top to bottom, you can see how volumes grew, revenues grew and profits both grew and were re-allocated among participants (each colored pixel in the charts above is equal to about $1 million.)
These charts illustrate that there is no "law of conservation of profits" in any market as long as there is sufficient innovation. This is because the there is no "law of conservation of value created". If value is presented, buyers will gladly trade cash for it. Conversely, if there is no value-generating innovation, growth stops and competition reduces to a zero-sum game.
One of the most exciting aspects of disruptive growth is that although it tends to transfer profits from incumbents to entrants, it also grows the size of the overall market. Sometimes the growth is significant.
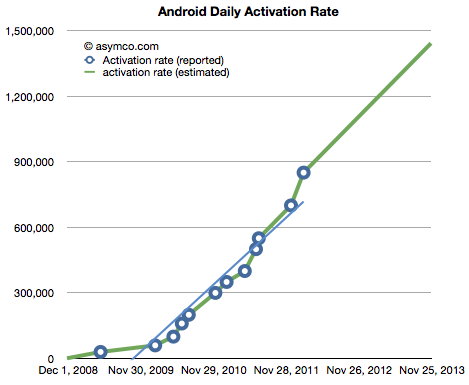
The latest data from Google shows that the Android activation rate is increasing at a relatively steady rate (i.e. acceleration is constant). The data provided so far is in the blue circles below. The green line is the interpolation and extrapolation of that data.
As the graph is projected forward we get an activation rate of one million per day by mid August of this year. If it continues then we could see 1.5 million per day by end of 2013.
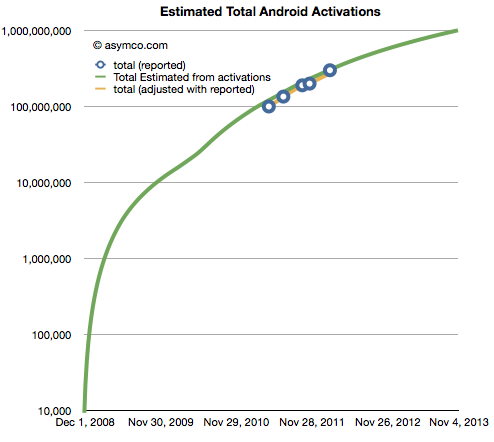
The corresponding number of cumulative activations is shown on the following log chart (with blue circles showing the actual data and the green estimates.)
The forecast is therefore that Android activations will cross one billion by November 2013.
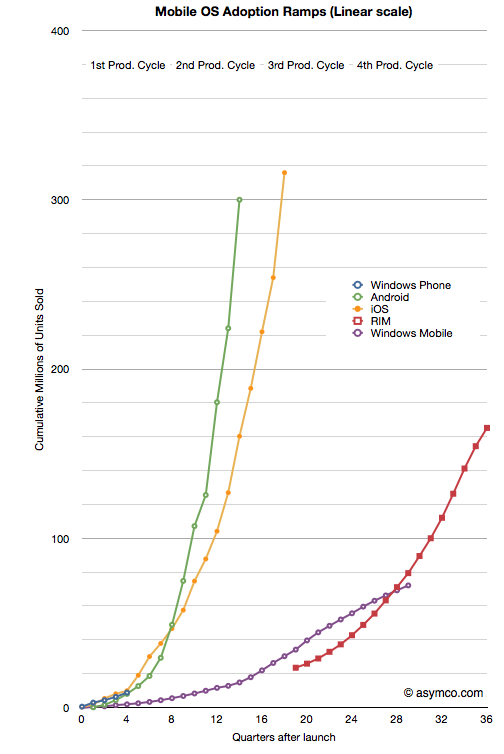
The following chart compares the growth ramps of the various mobile operating systems indexed from the same starting points (measured in quarters after launch).
If Android does keep accelerating at the same rate then it will reach a billion users in five years. Of course, this total will not be a unified ecosystem in that many versions of Android will be co-existing. There will also be additional variants of Android which will not include Google services (these are not included in the totals above) which will compete to some degree with this platform.
However, it's still an amazing story. The crucial question is whether the billion Android phones will have an effect on the opportunity for new entrants like Windows Phone and future BlackBerry variants as well as Bada and other Linux-based platforms.
The answer is that there will be well over 6 billion mobile "connections" by the end of 2013. ITU reports that "By the end of 2010, there will be an estimated 5.3 billion mobile cellular subscriptions worldwide, including 940 million subscriptions to 3G services." It follows then that if this forecast is correct then by the end of 2013, Android will have about 17% penetration of the connections market.