Asymco

Asymmetric Intelligence

Research

  1. Announcing Asymco Data Downloads

    Research · 10 comments

    Much of what is published here relies on data, lots of data. It's important that data be published along with conclusions, but data in spreadsheets is often difficult to read. Spreadsheets are not "productized" so they are hard to explain and therefore impossible to share.

    However, I am considering sharing the data I have in a format that is easier to read than a spreadsheet but richer than a screen shot of a chart.

    To that end I've begun experimenting with a solution based on a service called Roambi. Interested readers can download Asymco authored "roambi" files which I call ADDs (Asymco Data Downloads) will display rich data sets on iOS devices. These representations are interactive and easy on the eyes.

    Rather than bore with details, the following images should be sufficiently descriptive.

    So, to start, I am making available the market data from the article Android's Pursuit of the Biggest Losers for your viewing pleasure.

    Here is a quick FAQ about this new way of enjoying analysis:

    • Q: What is an ADD?
    • A: An ADD is an Asymco Data Download, a new way to look at the data behind the analysis with far more detail and a visually appealing representation.
    • Q: How do I get ADDs?
    • A: You will see the latest ADD featured in most pages in this blog and new ADDs will appear from time to time in blog articles. Here is an example:
    • Q: What do I need to get and use ADDs?
    • A: Any iOS device (iPod touch, iPad or iPhone) and download the Roambi visualizer app which is free.
    • Q: Is the iPad version different than the iPhone?
    • A: Yes, much better.
    • Q: Where can I get help on using the app?
    • A: Hopefully you won't need help, but there is help in the app and at Roambi's site.
    • Q: Will ADDs work with Android?
    • A: No.
    • Q: Will ADDs work with <insert non-iOS device here>?
    • A: No.
    • Q: Can I see ADDs on a Windows PC or with a Mac?
    • A: No.
    • Q: Can I download the actual spreadsheets?
    • A: No.
    • Q: How much does it cost?
    • A: ADDs are free.
    • Q: What if I see an error?
    • A: Send me a message.
    • Q: Will you publish more of this data, like the Apple financials?
    • A: Yes. I hope to publish all my data. Stay tuned.
    • Q: I don't have time to read your blog every day, can I just get the data?
    • A: I'm considering ways of creating a "premium" service. If you are interested send me a message that you would like to receive email-based links. Send request to: horace.dediu -at- asymco.com.
    Tap Here To Download

    Tap Here To Install Roambi

  2. The End of Management - WSJ.com

    Research · 6 comments

    When I asked members of The Wall Street Journal's CEO Council, a group of chief executives who meet each year to deliberate on issues of public interest, to name the most influential business book they had read, many cited Clayton Christensen's "The Innovator's Dilemma." That book documents how market-leading companies have missed game-changing transformations in industry after industry—computers (mainframes to PCs), telephony (landline to mobile), photography (film to digital), stock markets (floor to online)—not because of "bad" management, but because they followed the dictates of "good" management. They listened closely to their customers. They carefully studied market trends. They allocated capital to the innovations that promised the largest returns. And in the process, they missed disruptive innovations that opened up new customers and markets for lower-margin, blockbuster products.

    via The End of Management - WSJ.com.

    Here is the book: http://amzn.to/9jycyp

  3. Subscribe to Asymco One for full access to our research.

  4. The Android SKU paradox

    Research · 23 comments

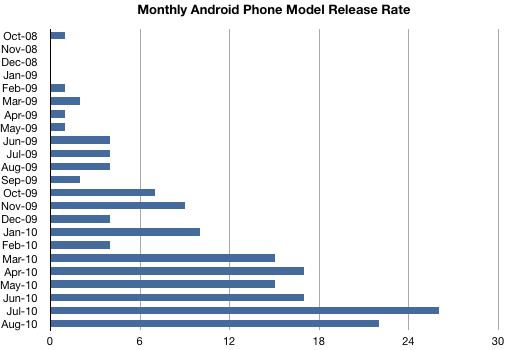
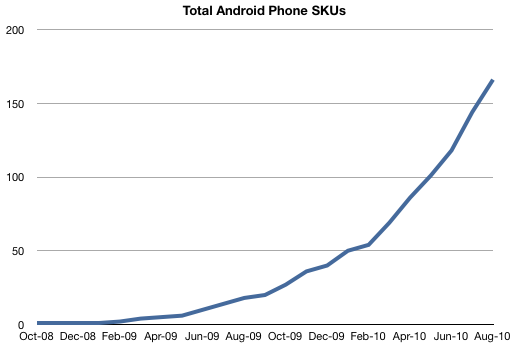
    Next month will be the 24th since the first Android device launched in October 2008. The G1 was followed by another HTC device in February of 2010 and a few others in the spring. The summer of '09 showed a steady release of up to four new phones every month. Since then the number of Android phone stock keeping units (SKUs, uniquely identifiable stockable products) increased dramatically, with the release rate increasing to 26 per month during July of this year (source: pdadb.net).

    Altogether, there are have been 166 Android phone SKUs in the market with another probable 25 or so ready to launch in the next few months.

    Now this may seem like a large number of different phone models in a short time, and it is, but Windows Mobile was even more proliferated as a licensed OS. At its peak over 50 new devices were released every month. The total now is over 1700 and it's still growing.

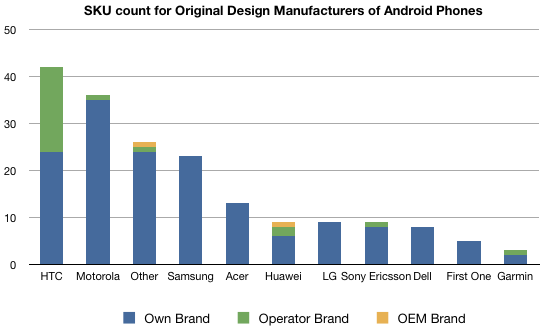
    The 183 known Android devices are distributed among 10 principal vendors with another 18 minor vendors. The 18 "other" vendors (see footnote 1) have either one or two devices in the market.

    The vendors or original design manufacturers list ranked by most devices follows:

    I broke out the devices also by the number of operator branded devices designed by the same manufacturer (green) and any devices designed and built by one vendor but sold under a different vendor's brand (orange). It shows how, excluding "other", HTC is the most prolific Android builder (and seller) but also how it still depends a lot on Operator branding.

    The proliferation of Android devices is indeed striking, but as I've pointed out before, the licensing model for Android is symmetric with that for Windows Mobile with the exception that Android is both open source and cost-free to license. This should make it highly disruptive to the paid-license model that Microsoft worked so hard to implement. It should be no surprise then that the adoption dynamics for the platform are very similar, with the same licensees that took Windows Mobile a few years ago embracing Android today.

    The proliferation still has a while to go. There is production capacity for over 2000 SKUs among all the vendors in the market (especially the "other" category) and it's only been two years since a stable version of the OS has been available. So it would not be surprising if the total number of licensed Android products will overtake the 1700 or so Windows Mobile SKUs.

    So what's the paradox?

    The question that should jump out from this data is what's the value to the participants in this, or any mobile OS licensing model? When I analyzed the Windows Mobile field in 2007 or so, it was pretty evident that very few vendors other than HTC shipped enough volumes to make a product profitable. In fact, I coined the phrase Pocket PC Paradox to describe the situation where hundreds of vendors would line up to make undifferentiated products competing for a shrinking pie. This went on first with Pocket PC PDAs, then repeated with Windows Mobile and is now repeating with Android. Nobody ever made money except for HTC, not even Microsoft.

    It's still a mystery to me why any manager would decide to make the (n+1)th Android/WinMo phone. It must be difficult to make market projections that justify the cost of developing and marketing this new product.

    But here's some help: The total number of Android phones sold through the end of last quarter was about 23 million units. The total number of SKUs launched to date then was about 118. That means that the average Android phone SKU sold 200k units (2).

    Now this may seem comically low, but I will again bring up history and point out that while the WinMo bubble was in its zenith, the average Windows Mobile SKU had 50k units sold. With the SKU count increasing more rapidly than the sales rate (40% more SKUs since June) it's very likely that the average units per SKU is dropping. So by my reckoning there's plenty more in the Android bubble to go.

    -----

    (1) The "other" category includes the following vendors:

    • Lenovo
    • Gigabyte
    • Highscreen
    • Notion Ink
    • WayteQ
    • Forsa Posh
    • Inventec
    • Kyocera
    • Pantech
    • TechFaith
    • Saygus
    • Sharp
    • Ziss
    • Alcatel
    • General Mobile

    (2) I'm fully aware that the distribution of sales over the products is not even and very likely exponential, but there is no way to predict whether a given new product will be a "hero" or DOA. The dream for every manager must be that his product will be a star, but the odds get worse and worse over time and the average units sold has to be considered as including these odds.

  5. Mobile devices overtaking PCs

    Research · 3 comments

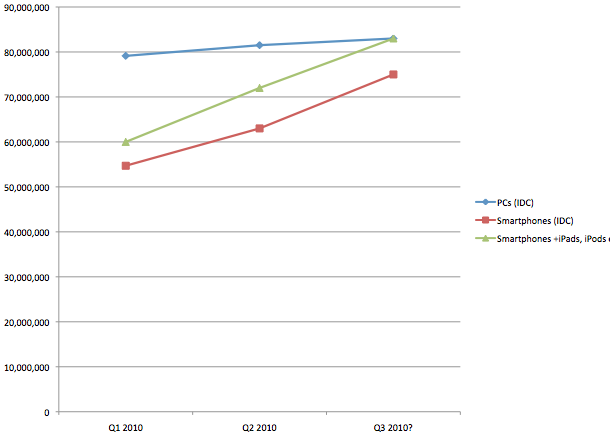
    Smartphones, or Mobile devices, will soon become the dominant computing platform for humanity and supplant the PC which has reigned since Apple ignited the Personal Computer revolution in the late 1970's.

    via The numbers don't lie: Mobile devices overtaking PCs - Google 24/7 - Fortune Tech.

    I guess Gartner didn't get the memo. By keeping the two categories separate, it implies no overlap in consumption and hence no need to worry if you're in the PC business.

  6. Motorola's Android 2.2 Rollout: What a Mess - PCWorld

    Research · 1 comment

    From a comment in the article below:

    I installed HTC's leaked version of 2.2 on my incredible last month. It has been noticeably faster, has better battery life, and the extra features are nice. As expected, Verizon put a lock down on the wifi tethering feature, and if I want to use it I have to pay an ADDITIONAL $25/month, which is completely ridiculous. Luckily, my phone has been rooted (it was the only way to get froyo on there) and I can use a number of FREE wifi tethering applications that don't cost anything extra per month either.

    It's pretty sad that the only way to enjoy an android phone is to hack the crap out of it, and doing so requires relative technical expertise.

    via Motorola's Android 2.2 Rollout: What a Mess - PCWorld.

    Reminds me of Windows Mobile in another way: the only real fans were those who could play with cooked ROMs. Conversely, imagine if the only iPhone fans were those who jailbroke/unlocked iPhones.

    See also: The Android abdication

  7. Microsoft CIO on Android vs. iPhone: Windows Phone will dominate

    Research · 10 comments

    The OS market in the mobile space is dominated by other players. Is that a cause of worry?

    I think it’s a temporary issue. I don’t put a lot of face and snapshot and time into what is going on. On a global basis, I see what is growing and what is shrinking. Text messaging is the fastest-growing on simple phones part of the mobile market. That’s where growth is. The smart phone part of the market, or the premium market, is in the downward part of the market. It will not be there for a long time in the future.

    People want something that’s simple. The design goal for the Windows Phone 7 is that with rich experience you get simple stuff easily. Great keyboard or touch or both – so you can have that. It is too early to talk about dominating, but I’m excited about it. Android coming into the market says there is room for more innovation and we see ourselves playing a role in that space. People talked about the iPhone and thought that was the end of the world for OS. Windows Phone 7 will prove there is more room for innovation.

    via Q&A: Tony Scott, Chief Information Officer, Microsoft.

    In other words, Android's entry in the market and remarkable growth, there is room for Windows Phone. And because Windows Phone is easy to use and has a keyboard and touch it will have a chance at dominating.

    Microsoft's enthusiasm for yet another mobile platform joining the fray (along with iOS, Android, RIM, Symbian, Windows Mobile, Meego, various sundry Linux and Bada) is not just delusion. I'm sure that they gathered positive feedback from operators. By this time next year there will be dozens of Windows Phone devices on the market. After all, Windows Mobile attracted 1700 licenses.

  8. Subscribe to Asymco One for full access to our research.

  9. The Android abdication

    Research · 18 comments

    When I wrote about Android's pursuit of the biggest losers, I made the explicit claim, backed by data, that Android was most attractive to device vendors who were in financial distress. Android is a lifeline to sustain failing business models. But underlying that claim was the more sinister implication that Android is sustaining to the incumbent operator business models. That means that Android is subject to operator manipulation and its market access as well as those of competing platforms will be throttled to maintain control.

    The article below makes an even stronger case.

    As a result, we now have a situation where the U.S. telecoms are reconsolidating their power and putting customers at a disadvantage. And, their empowering factor is Android. The carriers and handset makers can do anything they want with it. Unfortunately, that now includes loading lots of their own crapware onto these Android devices, using marketing schemes that confuse buyers (see the Samsung Galaxy S), and nickle-and-diming customers with added fees to run certain apps such as tethering, GPS navigation, and mobile video.

    The dirty little secret about Google Android | Tech Sanity Check | TechRepublic.com.

    I would not say that Android is enabling the consolidation of operator power. I would say that operator power never wavered.

    The article concludes:

    Despite the ugly truth that Android is enabling the U.S. wireless carriers to exert too much control over the devices and keep the U.S. mobile market in a balkanized state of affairs, Android remains the antithesis of the closed Apple ecosystem that drives the iPhone and so it’s still very attractive to a lot of technologists and business professionals.

    But, the consequence of not putting any walls around your product is that both the good guys and the bad guys can do anything they want with it. And for Android, that means that it’s being manipulated, modified, and maimed by companies that care more about preserving their old business models than empowering people with the next great wave of computing devices.

    That sounds about right.

  10. Analysts' categorical failure

    Research · 15 comments

    Gartner explicitly explained so in its press release: "Gartner's PC group does not track media tablet sales in this PC shipment data, so iPad sales are not included in these results

    via Is Apple the real U.S. PC market share leader -- or soon will be? | Betanews.

    The reluctance of  industry analysts to measure the iPad as a computer is a fascinating and vivid symptom of how analysts conspire with their customers to smother visibility of impending failure.

    Before we dive into the motivation to ignore iPads, we need to understand how analysts in general and companies in particular group products into comparable piles. This process of grouping is called categorization. It should be distinguished from segmentation which groups buyers in a market. Categorization is essential for competitive analysis and measurement of the performance of a product (relative to other products).

    Categorization is a challenging problem for most companies. To illustrate why, consider four possible methods for categorizing products:

    1. By product attributes. The assumption here is that products with similar attributes compete in the same market. As an example hard disk drives might be categorized by dimensions of the cases and sub-categorized by capacity and perhaps transfer speeds.
    2. By user attributes. This method is similar to segmentation where products are grouped by the type of buyer. Magazine titles might be properly categorized by the age and gender of the readers. This can also cover geographic data.
    3. By user behavior. This method, sometimes called psychographics is a more advanced method than demographics where user personality, values, attitudes, interests or lifestyles are measured. You might have seen examples where users are defined with a "prototype" person and the products are attached to this prototype. This is a common way to categorize mobile phones (Nokia is a known leader in this method).
    4. By modes of consumption. Determine what products are hired to do the same job. In this case you have to have real insight into what people actually do with their products and try to look broadly at what they substitute. The classic example of this is to understand that a power drill competes with products what make holes in walls not just with other drills.

    When reading this list, it's easy to see that it's ranked in order of difficulty. The easiest thing to do is group according to things you can measure easily. Products are easier to measure than demographics which are easer to measure than psychographics and that's easier to capture than observed behavior.

    Consider how you would structure a study to capture this data.

    1. In the first case, you need an analyst to collect products (or just their descriptions) and record values in a spreadsheet.
    2. In the second case, users need to be surveyed for basic data. This is hard because you have to find users and then you have to get a statistically significant unbiased sample.
    3. In the psychographic study you need to ask a lot more questions about lifestyle in your survey and hope that the subject answers honestly. You still need a large sample.
    4. In the case of consumption analysis you need to observe a subject use a product for a prolonged period of time in the usual context where the product is used and be able to interject questions when certain behavior is encountered. The observation of one person can take one research person-day per subject. To get statistically significant data requires literally man-years of work.

    Now it should be clear why an analyst will only categorize according to product attributes. It's not only economically and temporally expensive to perform research on methods 2 to 4 but it also requires interpretation and insight into study development.

    A few companies go beyond buying analyst market data and do their own research. As far as I know user studies are more commonly done by consumer products companies. But it's extremely rare to see this research done by low-margin technology companies. They don't have the budgets or skill sets to do any research.

    However, in my experience, nobody performs the fourth, most difficult, form of categorization.

    The result is that good, smart managers trained to always base their decisions on hard facts, pick up these lowest-deonominator analyst reports to help decide which products to develop. And it should be obvious why they are surprised when products that did not show up on any market study suddenly take all their profits away.

    Thanks Gartner.

  11. Dell's running

    Research · 6 comments

    Once the pride and joy of the world's largest computer systems builder, consumer products now make up just 18% of Dell's total sales. That's probably a good thing in the long run, because this segment is notoriously margin-poor when compared to the less price-sensitive corporate computing market. I can't blame IBM for giving up on consumers years ago, and I think Dell should follow suit.

    via Make a Hard Left, Dell! (AAPL, CTXS, DELL, HPQ, IBM, MSFT, VMW).

    That's right. Flee upmarket Dell. Run, run.

    Quoting from the gospel:

    Step 2: Entrants grow and improve; incumbents choose flight. As disruptive attackers follow their own sustaining trajectories, they make inroads into the low end of the market or begin pulling less demanding customers into a new context of use. What happens when the disruptive entrant begins to make inroads? [...]

    Incumbents naturally choose flight. What looks highly attractive to the entrant continues to look relatively unattractive to the incumbent. The asymmetric motivation leads to incumbents naturally fleeing the low end. They cede that market to the entrant. [...]

    Remember, incumbents focus on delivering up-market sustaining innovations that allow them to earn premium prices by reaching undershot customers. They view flight as a positive development.

  12. Revisiting the App Forecast

    Research

    From a forecast I made on March 21st: 300k Apps Approved by August:

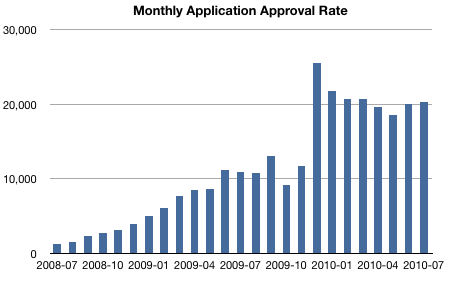
    My initial estimate in February for the 200k milestone was by May 1st. I was clearly off by nearly 40 days. If the add rate is maintained at 20k/mo 300k will come around in August although I’m not as confident in this forecast. The rate of app addition seems to be accelerating.

    As of today the Approved app counts are as follows:

    AppShopper: 297,165

    148apps.com: 296,662

    148apps.biz: 296,157

    The monthly rate of addition is shown in the following graph:

    The 20k/month has been steady during the last 7 months so I think the last 4k apps will be added in the next week, making the 300k roll-over in August, as forecast. The approval rate did not accelerate however but stayed pretty steady. There was a similar plateau in the middle of last year around 10k apps/month.

  13. Subscribe to Asymco One for full access to our research.

  14. Life's (Not So) Good

    Research · 10 comments

    Follow-up to LG dreams of smartphones.

    LG Doesn't See Return To Operating Profit Until Early Next Year

    By Roger Cheng and Jung-Ah Lee  Of DOW JONES NEWSWIRES

    SEOUL (Dow Jones)--LG Electronics (066570.SE), which readily concedes it is late to the smartphone game, said it plans to launch 10 more smartphones and sell 5 million devices by the end of the year as it scrambles to catch up with the rest of the industry.

    But the aggressive move, which includes increasing the research and development budget by a third and ramping up its spending on marketing, means the company's once-flagship mobile devices unit won't likely return to an operating profit until early next year, said Chang Ma, vice president of marketing for the division.

    "We have to just bear it," Ma told Dow Jones Newswires on Wednesday, adding that he hopes to see a turnaround after the fourth quarter.

    It takes R&D to make an Android phone?

    (Thanks to MfH for link.)