Asymco

Asymmetric Intelligence

Research

  1. Cracking the China code: Microsoft vs. Apple

    Research · 87 comments

    In 2011 Microsoft's CEO bemoaned that revenue in China was about 5% of what it obtained in the US. Yesterday Apple's CEO suggested that revenue from China will overtake the US in the near future.

    The contrast is even more stark when one considers the time and effort each company has made in China. Microsoft has been investing and promoting itself in China for decades while Apple barely had any presence 3 years ago.

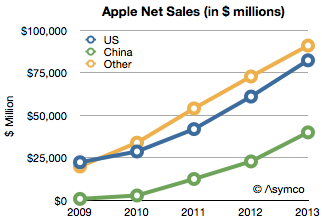
    To put a finer point on this I show below Apple's sales by region:
    Screen Shot 2013-01-11 at 1-11-10.08.26 AM

    Apple's China net sales in fiscal 2009 were only 769 million. In 2012 they were $22.8 billion. That is a figure greater than US sales three years earlier. Put another way, China sales grew in three years as much as they did in the US in 33.

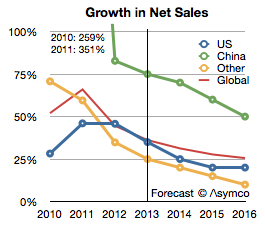
    The growth rates were astronomical: over 250% in 2010 and 350% in 2011. In 2012 the growth slowed to 83% but that is still almost twice the US or the global average. The growth rates are shown in the following chart:
    Screen Shot 2013-01-11 at 1-11-10.09.19 AM

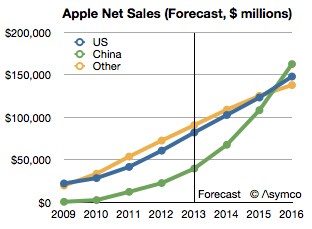
    I added an estimate for growth into the future moderating to 50% for China and 20% for the US. If that happens then China will become the largest market for Apple by 2016 as shown below.
    Screen Shot 2013-01-11 at 1-11-10.10.46 AM

    The reason for this growth is, of course, the iOS product lines. Growth started when the iPhone was introduced and surged with the iPad and every time updates were released.

    The contrast with Microsoft now comes back into focus. China and the US have a roughly equal number of PCs but the mobile users in China exceed the US by a factor of three to one. The pool of users is so great that Apple obtained its growth even with reaching only 30% mobile network distribution coverage.

    Without a mobile portfolio Microsoft is severely hampered. Of course, Microsoft is trying and has made several attempts to place its Windows Phone in the hands of Chinese users. It's a tough sale however because Microsoft must work through partners. They need to get vendors to license the OS and the operators to range the devices and retailers to push it. Given the flood of "free" Android variants they are having trouble even starting down that long road.

    But more fundamentally, Microsoft's software licensing business model is severely limited in China because what it offers is not what is valued. Both on the PC or on the mobile device, what China values is the tangible. Software can be made valuable only if it can affect the purchase decision of hardware and it can do so only if it's sold as part of an integrated product. With Surface, Microsoft shows that it understands this. What does this imply for a Microsoft phone?
     

  2. Getting to know the meaning of sisu

    Research · 13 comments

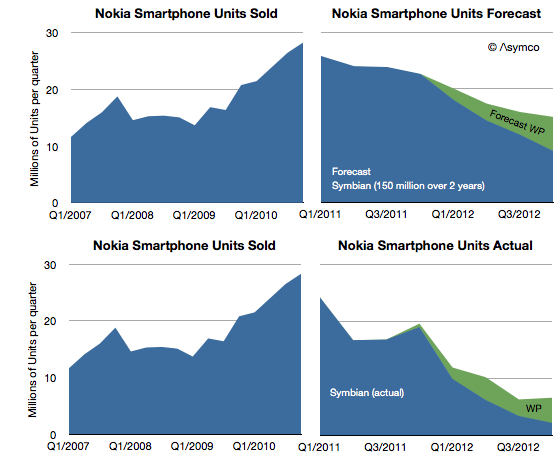
    Nokia announced 4.4 million Lumia smartphones were shipped in Q4. That's about 14 million since the Lumia line was launched a year earlier. It isn't however nearly enough to replace the lost sales from Symbian. One year earlier Nokia shipped 19 million Symbian phones in the fourth quarter and the year before 28.3 million. The history of smartphone sales from Nokia is shown below:

    Screen Shot 2013-01-10 at 1-10-6.23.00 PM

    I repeated the forecast I drew up in February 2011 when the platform switch was announced. That forecast was based on the company stating that 150 million Symbian phones would still be shipped. Symbian fell far more rapidly than I (and Nokia) expected and to date only 98 million have shipped. The last quarter's 2.2 million seems to be so low that it will be hard to imagine the platform lasting more than a few quarters.

    My forecast for Windows Phone was 15 million (through Q4/2012) and the 14 million actually shipped is not far off. However, note that the sequential growth into the fourth quarter was lower than the same period last year. For the holiday quarter Nokia received almost no boost. If there is reason to be optimistic it's that there wasn't a decline in overall smartphones into Q4.

    The overall result is that Nokia remains in an operating loss status and it's going to be very hard to recover. No phone vendor has successfully recovered to date. The company managed to book a €50 million one-time payment for IP rights (presumably from RIM) and is sustained by royalties and platform support payments from Microsoft. But even so it's barely breaking even.

    The prospects for Windows Phone may be improving however. Operators in the US continue to talk about it. We don't have a split for AT&T's push this past quarter and estimates suggest that 80% of smartphone from AT&T were still iPhones but Verizon will also push the platform and there are suggestions it's doing well in Germany. HTC has also launched some WP flagship phones and may have had a good December as a result.

    That translates into steady progress. But the growth of Android and iOS continue as well. Windows Phone needs to continue to persevere in adverse conditions for years to come. The Finns know a thing or two about that.

  3. A more complete picture of the iTunes economy

    Research · 59 comments

    As it did yesterday, on occasion Apple reports the cumulative total downloads and payments to developers. Since this is done in variable time intervals, it makes analysis of the value of the app store difficult.

    But not impossible.

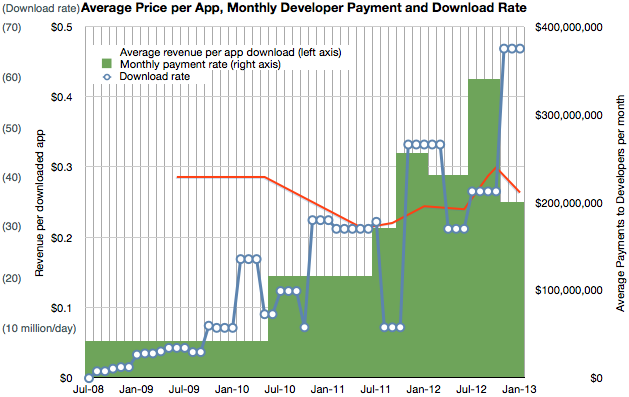
    The provision of developer revenues means we can determine the pricing of apps. The pricing of apps and the download totals allows us to determine the revenue of the store. Using the time stamps of the reports allows us to determine these quantities over time.

    I've combined the data we have so far into the following graph.

    Screen Shot 2013-01-09 at 1-9-3.17.11 PM

    It shows three quantities (on three separate scales) at a monthly resolution:

    1. Download rate (in millions/day, interpolated from download totals)
    2. Payment rate to developers (reported change in payment to developers/reported time interval)
    3. Resulting revenue per download (in red, trailing average over a 10 month period)

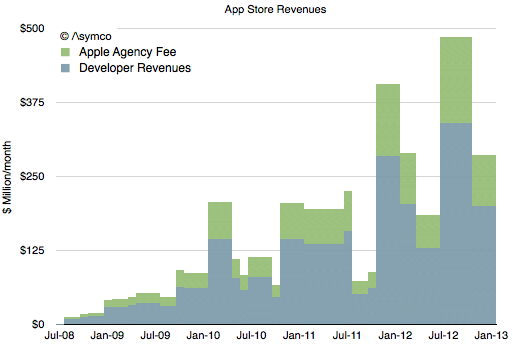
    Having a price and quantity of app downloads allows for a complete picture of App Store revenues over time, shown below:

    Screen Shot 2013-01-09 at 1-9-3.22.02 PM

    Note that I've separated the developer revenues from Apple's own revenues. The blue area should total cumulative developer payments (to a degree of error.)

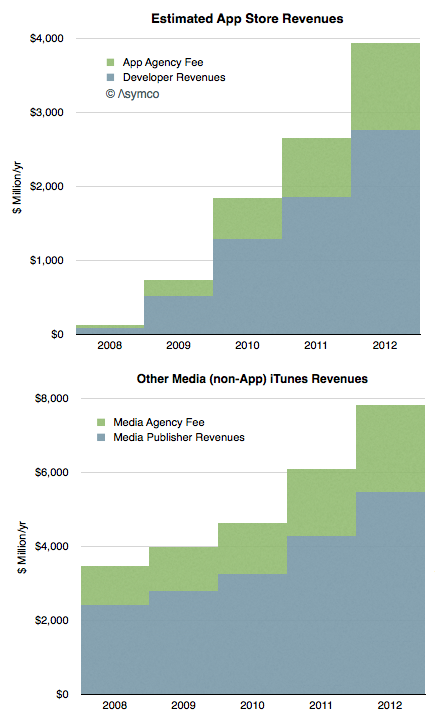
    The green area above is what Apple includes in its financial reports as part of "Music" revenues. If we annualize these App Store revenues we can strip them out and show them separately from "other media" revenues.

    Screen Shot 2013-01-09 at 1-9-3.25.04 PM

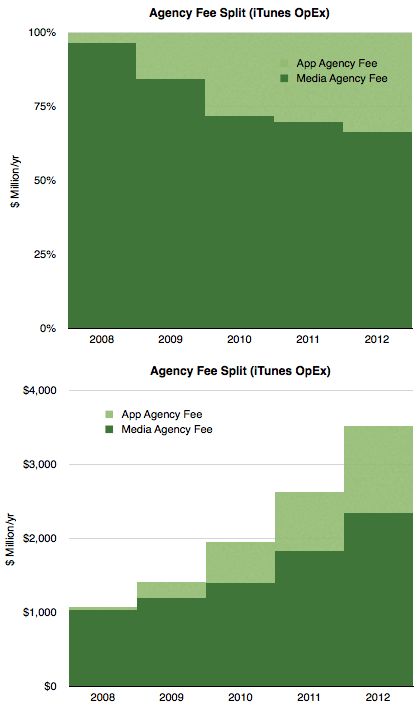
    Concentrating on the green areas which represent what Apple "keeps" we see the following split:

    Screen Shot 2013-01-09 at 1-9-3.28.55 PM

    Considering that Apple reports the iTunes store to being "slightly above break-even" then we can summarize the chart above as the operating expenses for the store.

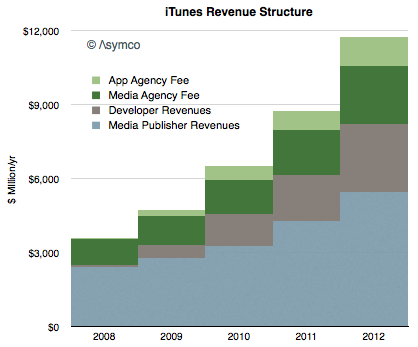
    Finally, taking into account all the information above we can draw a complete picture of how revenues flow through the App Store:

    Screen Shot 2013-01-09 at 1-9-3.34.23 PM


    Here are some conclusions:

    • The iTunes economy defined as gross revenues transacted through it is now about $12 billion/yr.
    • Over the last five years content owners (media and app) received a total of $24 billion while Apple spent about $10 billion to create those sales
    • Seen as a retail business, iTunes costs about $3.5 billion/yr to operate. This includes merchandising, payment processing and "shipping & handling".
    • Total revenues have risen steadily in a range of 32 to 38% compounded over the last 4 years.
    • Apps are now a third of all iTunes revenues, (about $4 billion/yr) having taken that share in only 4.5 years.
    • Non-app media still make up 2/3 of iTunes in terms of sales value but their growth is now 28% vs. about 50% for apps.
  4. App Store Download Rate Forecast

    Research · 21 comments

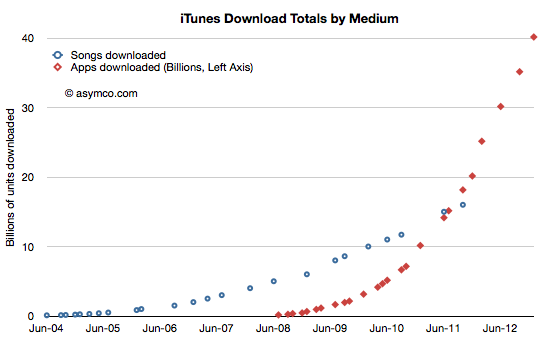
    Apple reported over 2 billion unique app downloads (excluding re-downloads and updates) in December. The total downloads reached 40 billion, payments to developers reached $7 billion and the total iTunes accounts reached one half billion.

    The total downloads is shown relative to total songs is shown in the following graph:

    Screen Shot 2013-01-08 at 1-8-2.09.04 PM


    Although we have not received an update on song downloads for some time, it's probably safe to assume that twice as many apps have been downloaded as songs.

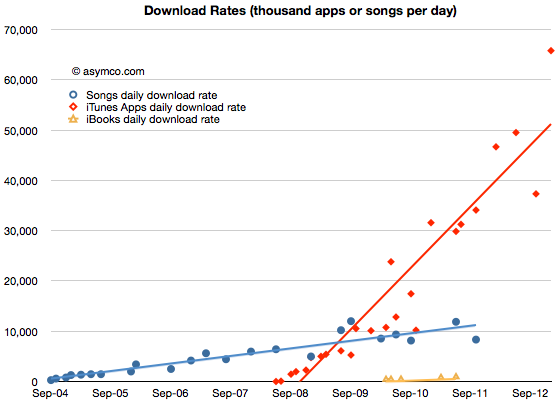
    This data can be reduced to a download rate:

    Screen Shot 2013-01-08 at 1-8-2.14.08 PM

    The apps daily download rate was about 65 million/day during the holiday period but may be averaging about 50 million/day on a yearly basis. Note however that the rate is increasing at approximately 1 million/day/month. That implies that the average rate will reach 100 million/day in 4 years and may spike to that level by 2015.

    The revenues associated with that rate will be $14 million/day. More about that in the next post.

  5. Estimates for Apple’s first fiscal 2013 quarter

    Research · 130 comments

    I've postponed my estimates for the fourth calendar for a long time. The reason is that there have been conflicting data to deal with and I've been hoping for some clues to give clarity. Unfortunately, even though I waited, I have not received many clues. Here are the challenges we have to deal with in this quarter:

    1. Management gave very low guidance for the quarter's earnings and sales. Normally this should not be a concern since the long-term pattern has been for them to "sandbag" significantly. For example last year's fourth quarter was guided at $9.3 EPS while the company delivered $13.87, a 49% "beat" to their guidance. However Q2 and Q3 beats were only 7% and 13% respectively and if we assume a similar number (10%) for Q4 we get about $13/share which would be a year-on-year decline in earnings (down from $13.9). This has not happened for many, many years. Management explained this through a lengthy set of reasons including a shorter quarter (13 weeks vs. 14 weeks), new product launches, currency fluctuations, deferrals and unfavorable component pricing. Then again, similar explanations were used in the past with no reflection in what actually happened.
    2. Management also launched a large number of new products. This normally leads to a surge in sales. In fact, 80% of revenues would come from a new portfolio of products. Having such a broad launch quarter into a holiday, would normally imply huge growth. Not only is this a critical launch quarter for many products but they also rolled out the iPhone to more markets more quickly than ever: 100 countries in three months. The broad roll-out implies a steeper ramp in production and thus more volumes. This would also contradict the lowered expectations from the CFO. However...
    3. Production was constrained. It was quite a long time before waiting times decreased for the iPhone--longer than what we saw last year. In the earnings call Tim Cook said "It's difficult to predict when supply and demand will balance, but I'm feeling very confident on our ability to supply quite a few iPhones". This again implies significant acceleration but did they achieve the targets? He did also announce that they met their target of 100 countries during the quarter but it's not clear if this was as quickly met as they would have liked.
    4. Margins are complicated. Launch quarters have lower margins typically and this is well understood. However, we have new products in the form of a new iPad at a new price point as well as the new iPhone which may have had some difficult manufacturing issues (i.e. yield). So how much faith do we put in the perennial pessimism in guidance?
    5. There was a vast increase in CapEx in the prior quarter. Normally CapEx spending "leads" production and is in proportion to it. However, the surge in Q2 and Q3 seemed to be unmatched by vast new production, at least that's what we are led to believe by both consensus and by management guidance. Did this CapEx differ in character from previous CapEx? Was it more "strategic" and less "tactical"? Will the disconnect continue?

    There are also the deeper questions:

    • Why there are no new operators being signed? The addressable market has not increased in the last 6 months. Why?
    • Is there a faster product cycle in the works? Is there a shifting of gears to a new product development process?
    • What's the nature of the relationship with Samsung as a supplier? Is their replacement characterizing the new type of CapEx spending?

    All these currents make this quarter doubly difficult to forecast. And it does not help that it comes on the back of two weak quarters which were argued away as exhibiting transition effects.

    So I'm very uncomfortable with my forecast and find it hard to defend this quarter. I considered not publishing one at all because it gives too much confidence when none is warranted. However, I received so many requests to publish that I relent and offer the following:

    • iPhone units: 55.5 million (50%/62%)
    • Macs: 5.0 million (-4%/+3%)
    • iPads: 24.4 million (58%/70%)
    • iPods: 11.2 million (-27%/-22%)
    • Music (incl. app) rev. growth: 25%/38%
    • Peripherals rev. growth: 10%/19%
    • Software rev. growth: 5.5%/14%
    • Total revenues: $60.0 billion (30%)
    • GM: 39.8%
    • EPS: $15.74 (13%)

    I included two growth figures (in parentheses). The first is a straight y/y value and the second is adjusted by assuming there were 13 weeks last year (and that sales were evenly distributed over those weeks).

    [We'll get a chance to go over this forecast and what is actually reported at Asymconf. Don't forget to sign up.]

  6. When will smartphones reach saturation?

    Research · 27 comments

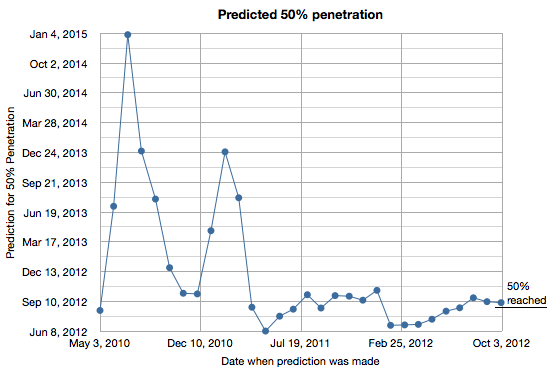
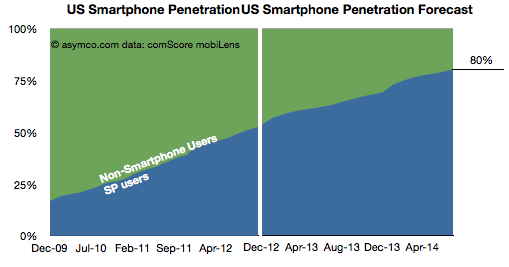
    50% penetration for smartphones in the US turned out to be fairly predictable. I tracked my predictions based on comScore data and the results are shown in the following graph.

    Screen Shot 2013-01-04 at 1-4-6.50.52 PM

    I began making predictions in May 2010 and updated the estimate every month since. As the chart shows, the prediction converged to early September 2012 by early 2011. The actual date was sometime in late August 2012.

    The reason this prediction was relatively easy was because the rate of penetration growth was mostly linear throughout the period of 2009 to 2012 or from 17% to 50%.

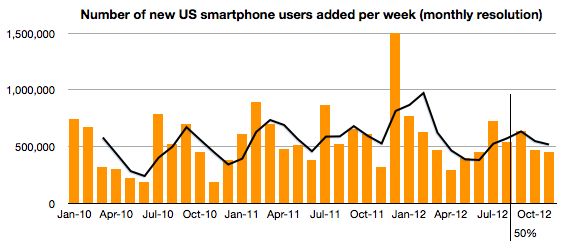
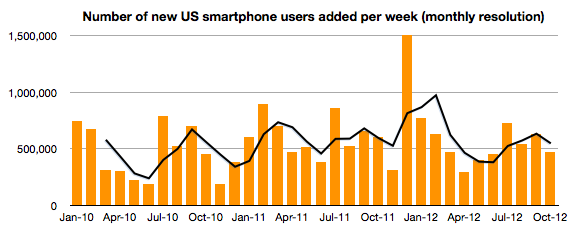
    In fact, the consistency continues even above 50%. The following chart shows the weekly new smartphone users add rate. No slowing seems to be evident for the few months since 50% penetration was achieved.

    Screen Shot 2013-01-04 at 1-4-6.51.02 PM

    So if we assume that this rate will be preserved or increase slightly, how soon can we expect smartphones will reach 80% penetration in the US?

    Screen Shot 2013-01-04 at 1-4-6.51.09 PM

    My guess is now August 2014.

  7. The last feature phone

    Research · 112 comments

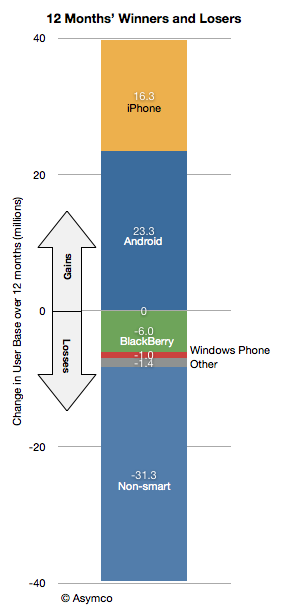
    During the last 12 months 31 million American phone users abandoned the use of feature phones. During the last 24 months over 60 million switched. Over 550k users are switching every week and this rate of switching has not changed much since late 2009.

    Screen Shot 2013-01-03 at 1-3-3.26.17 PM
    Screen Shot 2013-01-03 at 1-3-3.26.24 PM

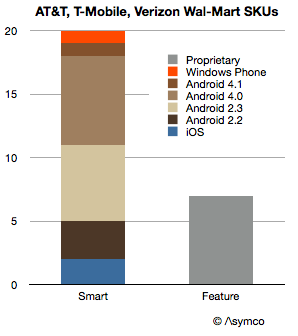
    Some of this switching has to do with demand for smartphone services but some of it is also due to a decreasing supply of non-smart phones. The shelf space being allocated to smartphones is nearing 100%. My single sampling of a Wal-Mart store shows the following data:

    Screen Shot 2013-01-03 at 1-3-4.11.18 PM

    Looking at individual carriers, AT&T ranged one feature phone and 7 smart SKUs. Verizon's ratio was 2:8 and T-Mobile's was 4:5.

    T-Mobile has been lagging in smartphone adoption and as they transition in 2013 it's possible that the AT&T ratio of 12% shelf space dedicated to feature phones will become the norm for the US. And as the US goes, the world will follow.

    With shrinking shelf space comes an accelerated decline in the product category. It may not come in 2013, and perhaps not by 2014 but it's quite possible that by 2015 the last feature phone will make its appearance in the US.

  8. In search of Apple's microprocessor

    Research · 62 comments

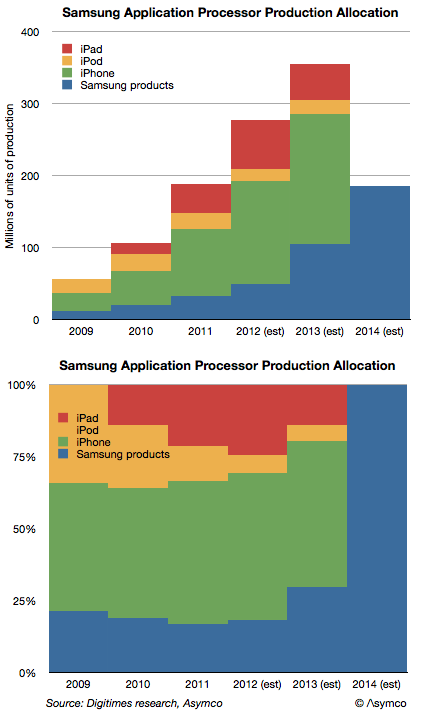
    Digitimes Research published an estimate of the allocation of production of application processors by Samsung. It suggests that Apple will transition away from Samsung as a processor supplier during 2013 and stop sourcing altogether by 2014.

    Most current capacity (nearly 70%) is said to be allocated to Apple's products. The iPhone, iPad and iPod touch consumed an estimated 226 million processors in 2012. That demand is expected to increase but it will increasingly to be met by other suppliers in 2013. However, Samsung's own products will take up some of the slack.

    The following graph shows the estimated production schedule by customer.

    Screen Shot 2012-12-28 at 12-28-9.57.37 AM

    There are several questions that this data raises:

    • Does Samsung's microprocessor production exceed that of Intel?
    • Who will produce Apple's processors after 2013. Will it be one or more suppliers is also an open question.
    • Is Apple's CapEx (est. $10 billion/yr.) being spent on some of this future capacity? A modern fab costs about that much.
    • As the iOS processors are Apple's own designs, will Apple be integrating production and design?

    Prior to his departure Intel's Paul Otellini had begun speaking about manufacturing. He argued that the "fabless" model was no longer competitive and that design and manufacturing should be re-integrated.

    I think we're about to find out to what degree that will happen.


  9. Call for Volunteers for Asymconf

    Research · 9 comments

    If you are available January 29th and/or 30th in the San Jose area we could use your help.

    We need eight people to help with registration, microphone relay, guides.

    We also need five people to act as Camera Operators - we will provide Cameras and training, but any experience is a bonus.

    We also need an Audio Mixer Operator – experience as a DJ is enough.


    In exchange for a day of hard labor you'll get:

    • Access to event (when not busy)
    • Access to reception and meals
    • A collectable Asymconf t-shirt

    Send email to volunteer@asymco.com to apply.

  10. Accommodations for Asymconf [Updated]

    Research

    We recommend staying at the Hayes Mansion

    200 Edenvale Avenue, San Jose, CA 95136

    Phone: +1 866.981.3300

    The workshops will be held here on January 29th.

    (Three One more workshop seats are available).

    Update: Workshops are sold out.

    Update 2: Use this link to reserve a special event rate of $149/night. You can also reserve by calling the number above and asking for the Asymco rate.

  11. The uncanny similarity between EU and US smartphone markets

    Research · 31 comments

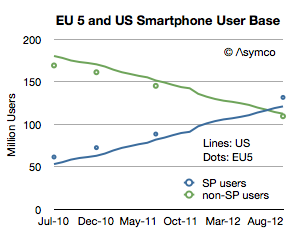
    comScore released one of its rare updates to the EU5 (Spain, UK, France, Italy and Germany) smartphone market. Note that the data is claiming to show installed base and not sales in any particular period. What interests me is a comparison or contrast between the European market and the US market.

    First, total users.

    Screen Shot 2012-12-19 at 12-19-7.30.57 PM

    The EU has about 500 million inhabitants while Europe overall has 731 million. The EU 5 total about 314 million which is very nearly the same as the US (311.6 million). Therefore the EU5 is a good comparable to the US in terms of population. As the graph above shows it's also remarkably similar in its adoption of smartphones. Note that the scale reflects users and since the populations are very similar then the penetration should also be similar.