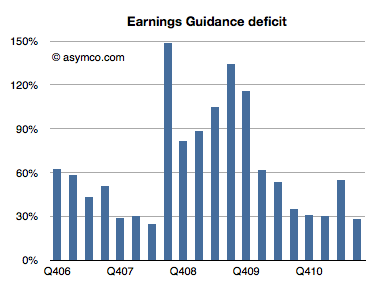
Every quarter Apple's management issues a "guidance" or forecast of their own earnings in the following quarter. Over the years, this figure has been nearly useless because not only is it not accurate, the error itself has been wildly variable. I plotted what I call the Earnings Guidance Deficit for Apple based on the formula (Actual EPS diluted - Guidance)/Guidance.
The higher the value in the bars above, the more the company underestimated (or under forecast) its performance. Note that during the recession the company routinely offered guidance at half the level they actually delivered. After the recession they returned to a more reasonable ~30% under-reporting.
The problem with this analysis is that there is such a high volatility in this factor that we can't count on it to predict where earnings will fall. Even if we saw a range bounded at 30% to 60% the usefulness of this would be very low as that is far worse than the range that analysts can get through other means (Deagol's accounting of analyst error). The best thing we can say is that the range seems to be bounded by 30% and 150%.
Rather than using this history for precision, perhaps it makes more sense to assume that the lower bound offers at least some limit to the possible value of next quarter's earnings. Maybe it can give us a "sanity check" for our own estimates.
For the next quarter Apple guided $9.30 per share. If we assume a 27% "deficit" which is at the lower end of the range above then the earnings are likely to be about $11.8.
That's equivalent to an 84% growth in earnings year/year. It would also imply $33 for the 2011 calendar year. At the current share price of $384 that implies a P/E of 11. That happens to also be the P/E for Apple at the trough of the recession in January 2009.
In other words, if the stock price does not rise (or falls) from the current level by the time earnings are reported in late January, then the P/E for Apple may drop to less than 11 on growth of 83%. That's a sanity check all of its own.
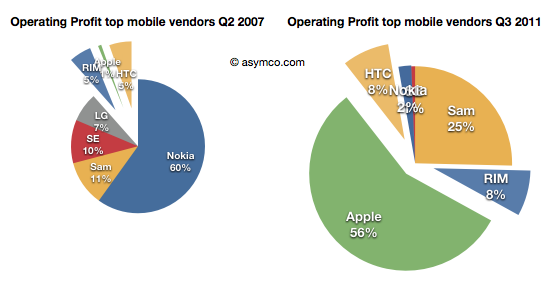
I recently posted a comparison between the profit capture of phone vendors in 2007 and the most recent quarter:
The idea was to show what a disruption looks like. A phenomenon where an entrant with none of the advantages of incumbency takes the profits away from companies privileged with ideal market access and knowledge.
The view of profit shift is the ideal view since it shows the "bottom line" impact and thus the denouement rather than more nuanced sub-plot. However, we don't always have access to profitability data. Sometimes we only have access to revenue estimates.
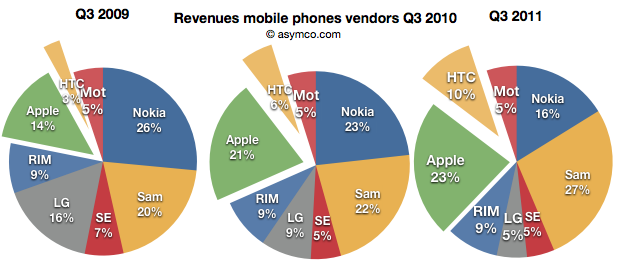
Fortunately revenues have a similar story and are often a good proxy. Consider how the evolution of revenue shares occurred in the same market:
Revenues for Apple and HTC combined doubled from 17% to 33% for the third quarter over three years.
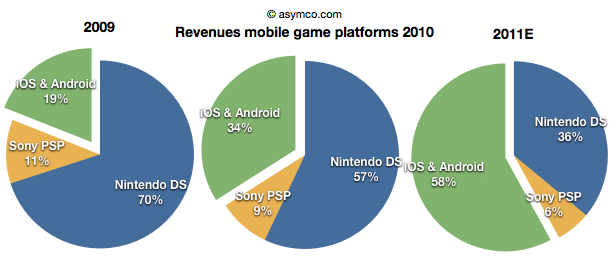
Note the similarity between this evolution and that in the mobile games market (data courtesy of Flurry):
The increase of revenues fro iOS and Android games nearly tripled over a two year period. Although we cannot say the same for profitability as the profits are not comparable since they allocated differently between platform and developer depending on platform, we can say that iOS is certainly driving vastly more value than Nintendo.
Sony and Nintendo may take some comfort from their console businesses which have not felt the same impact from mobility, but one wonders how long those franchises will last. Using an iPad with screen mirroring to a large screen TV already shows promise.
In the recently posted US Smartphone Landscape I used comScore's data to paint a picture of the growth of smartphones in general and the shape of the mobile platforms in the US. The source was survey data measuring the installed base. If we compare the installed base sequentially, we can get the increase (or decrease) of a particular platform. Comscore reports monthly but we can also summarize the data at a quarter-by-quarter basis.
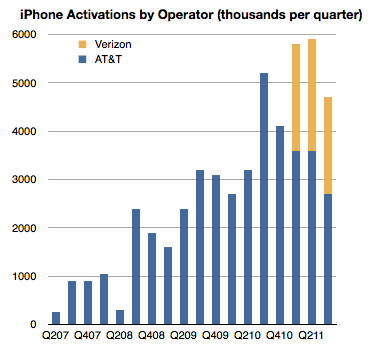
There is another source however for the US market, at least for the iPhone: operator activations. They report iPhone activations, shown below.
Can we use activations together with installed base data to learn something about the market? Yes, with some caveats.
First, it should be noted that install base should account for all sorts of devices. They could be new, old or hand-me-downs or purchased used. Changes in install base would come from addition of new devices but also from devices being discarded and users leaving the platform. Activations on the other hand include units new units but also those which have been re-activated after initial sale because they were either sold or given to other users. As far as I know operators do not report "net" activations so lost users are not included.
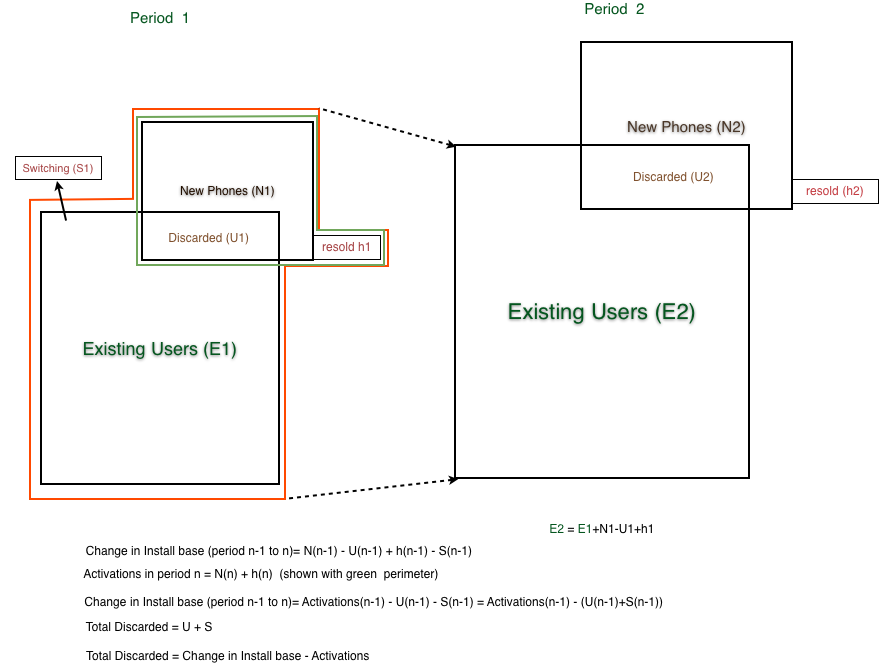
When the formulas are combined[1], what we get is the change in installed base is equal to Activations minus "discarded" iPhone, where "discarded" are both iPhones put aside in favor of a new iPhone or put aside in favor of another phone.
Since we have installed base change data and we have activation data we should be thus able to derive the number of iPhones being "discarded" or put out of use every quarter as the difference between activations and change in installed base.
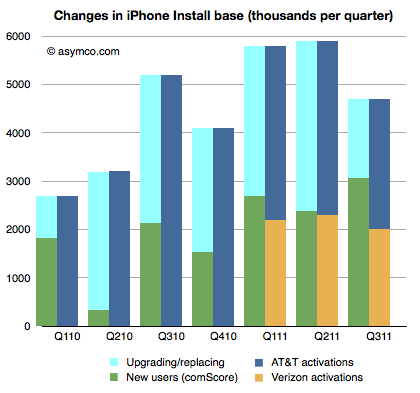
That allows the following chart to be built:
The green, dark blue and orange areas are given inputs and the light blue area representing discarded phones is derived.
This is an interesting (new) piece of information. What it suggests is that at least in the US the discard rate, i.e. number of phones being discarded over number of new phones is about 50% (56% on average over seven quarters.)
It's a rate I find surprising because I expected more of the phones to be re-used. But more surprising is that it leads to some surprising and possibly implausible behavior at AT&T.
If you look at the last three quarters, you can see that Verizon activations are very nearly equal to the increase in install base. As all Verizon users are new, they are certainly not replacing iPhones, so the green bars next to the yellow bars imply that all those new users are Verizon users. But that means that all the activations through AT&T were to replace existing phones and that AT&T only added a bit more than one million iPhone users in nine months.
In quarters prior to Verizon's launch, the AT&T discard rate was a modest 60% on average and after Verizon launch it went to 81%.
What does it mean?
---
Note:
The following diagram shows the derivation of "discarded" units.
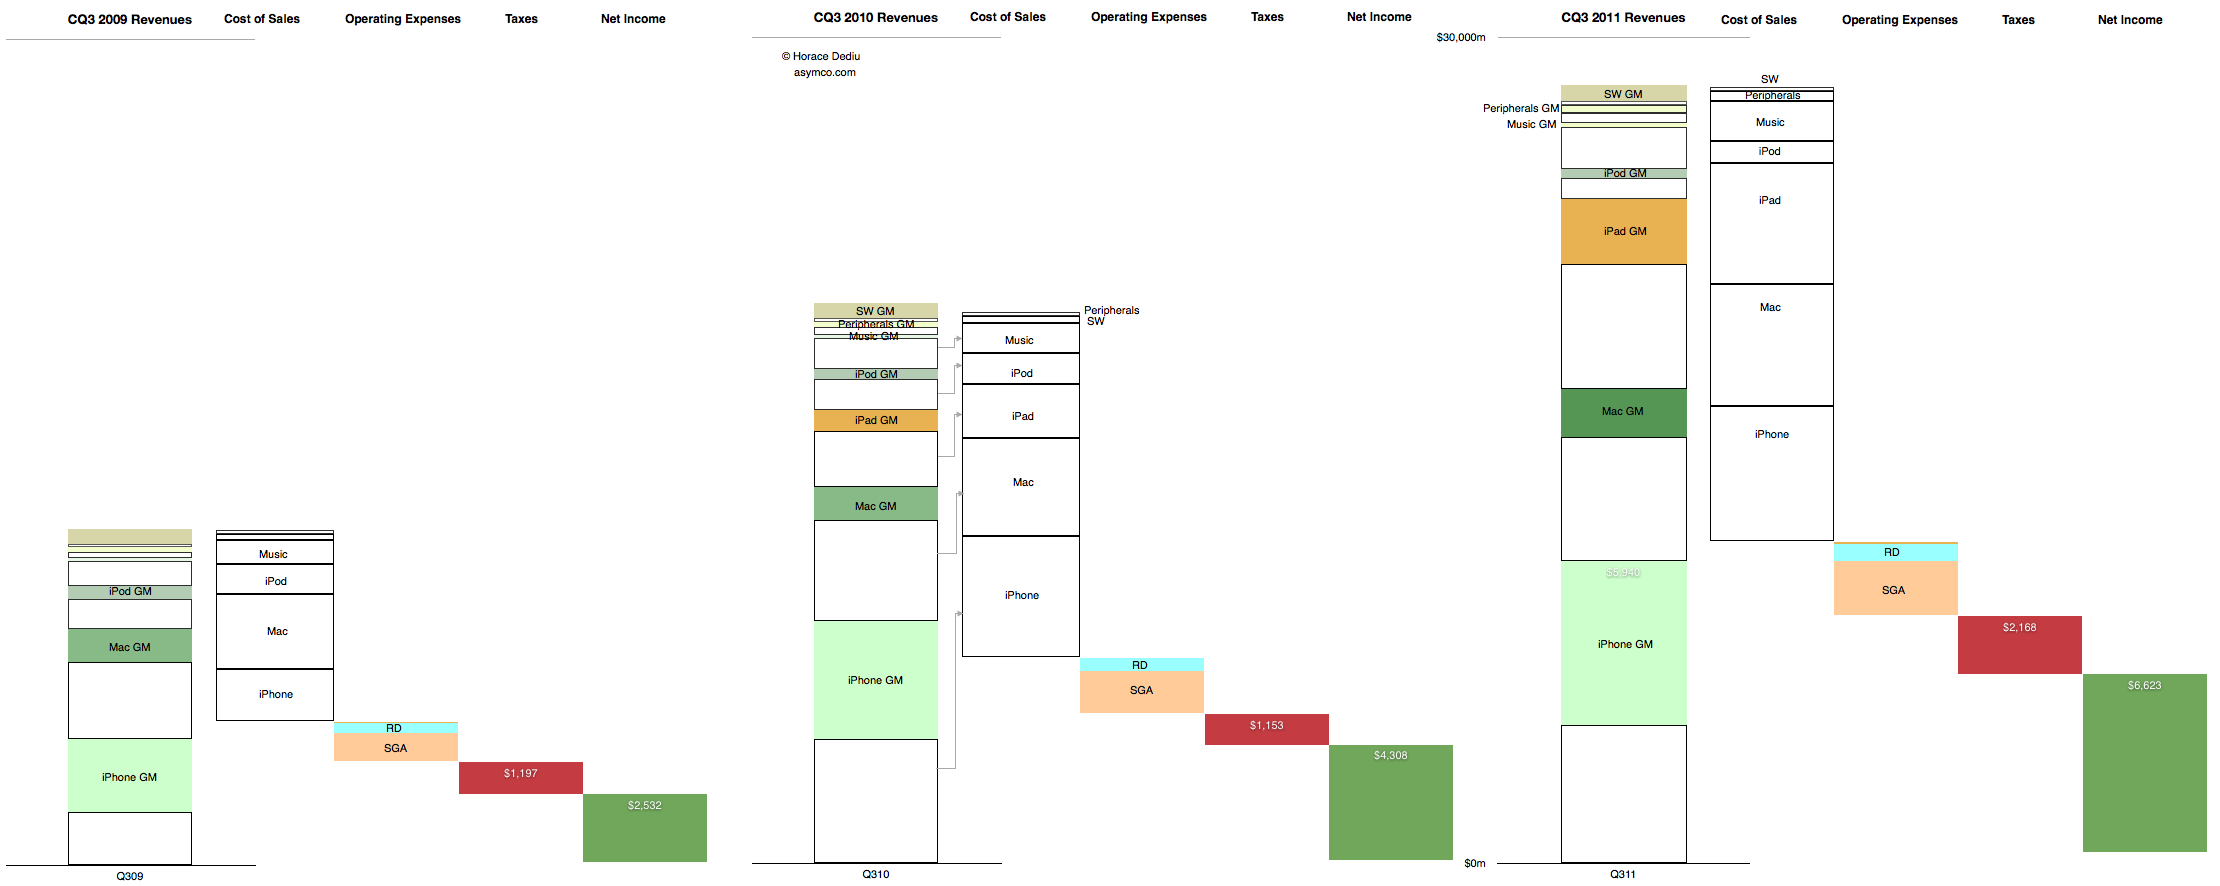
This is the cascading view of Apple's financial performance in the third calendar quarter. It only includes information that is already in the income statement but shows the relative growth of the individual product lines, their cost structures and the relationship between fixed (Operating) expenses and their variable (cost of sales) expenses at a glance.
In the past I would publish current and year-ago data, but in this quarter's summary I present three years' history of quarterly data. Note that the full view is quite large (2,220 x 886 pixels).
Here are some handy tips on how to read the chart:
The "top line" is the size of the first column in each quarter's chart.
The "bottom line" is the size of the last column.
The blank areas are what Apple pays suppliers.
The red area is what Apple pays to the government.
The Pink and pale blue area is what Apple pays its "exempt" employees. (Other Income and Expense is also included but is nearly invisible).
The Green area is what is declared as earned and becomes the "E" as part of the P/E ratio. (Note that not all of this goes to the Cash account as the cash flow statement will reveal).
The colored areas in the first column labeled with product name and "GM" (for gross margin) represent what Apple keeps from the sale of each product after paying expenses tied to producing that product.
The ratio of sold areas to the corresponding white areas below in the first column represent the margin (as a percent) per product line
You can observe the trend over three years by tracking each of these quantities from left to right.
The scale of the chart is shown by the line near the top representing $30 billion.
comScore published the latest data regarding US smartphone installed base. To summarize:
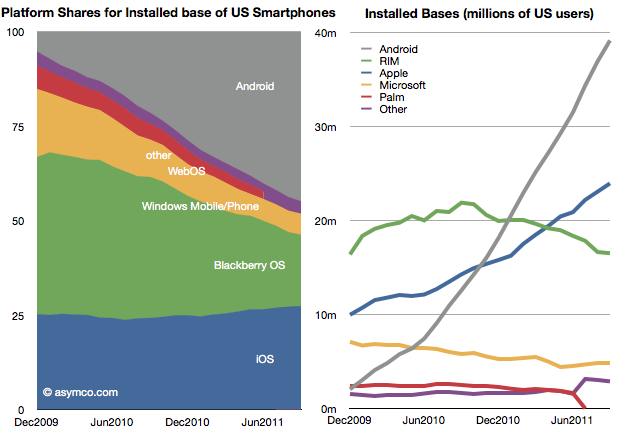
Penetration reached 37.4%, an increase of 2.9 million or 1.24 points of percentage.
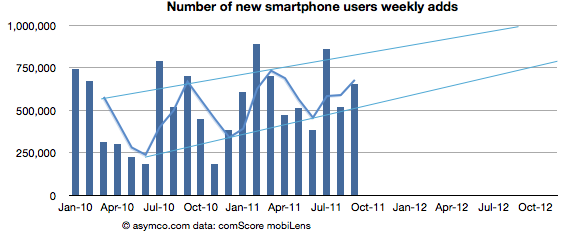
Approximately 650k consumers switched from non-smart to smartphones every week during September
Based on trailing average of six months' growth, 50% penetration will be reached by end of September 2012, though the trend is for accelerated adoption (see chart below).
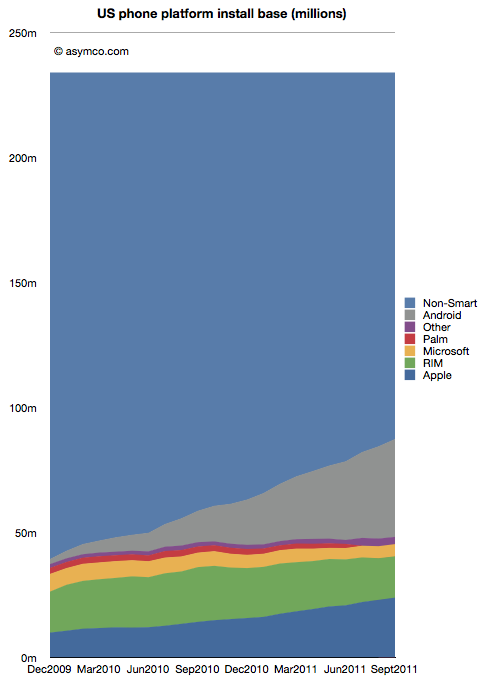
Of the platforms available, Android reached 39 million users, RIM 16.5 million, Apple 24 million and Microsoft about 5 million. Smartphone non-consumers dropped to 147 million. Among platforms, here are the shares and total users:
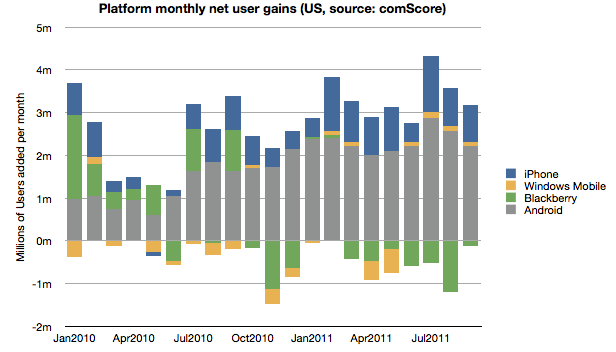
In terms of user gain/loss here is the tally:
Android and iOS have continued to increase consumption fairly consistently while RIM has moderated user losses. Microsoft has also shown the fourth consecutive month of usage increase having increased users by 440k since May. The new Windows Phones seem to have at least stopped erosion of user base though that base is still nearly a third of RIM's.
Overall, smartphone non-consumption continues to be the largest competitor though one which is steadily losing.
Even though China may overtake it in the new few months, the US is the largest smartphone market and it's a good leading indicator of the way the industry in evolving. It's also being measured by multiple observers[1] and we thus have a better chance at understanding the rate at which change is happening.
---
Note:
Nielsen reports that 43% of the phones in use in the US now are smartphones in the US with Ages 25 to 34 having 62% penetration.
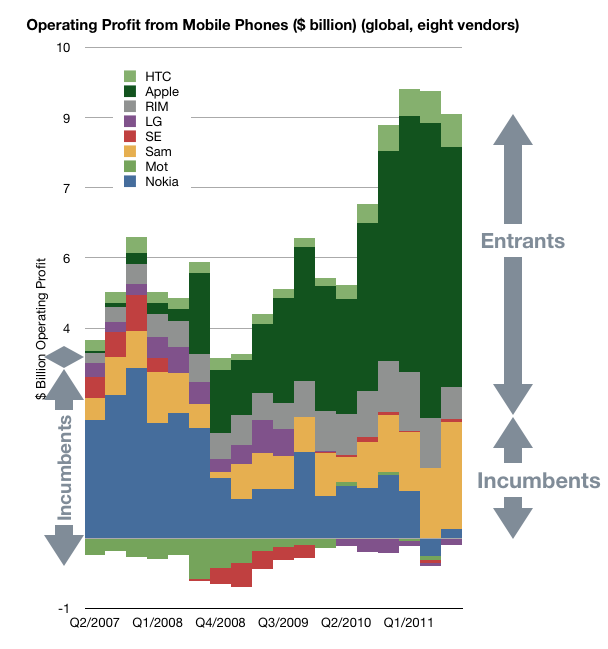
As shown in the yesterday's post, in the third quarter, overall mobile phone profitability declined. The eight vendors I use as a proxy showed a total net profit of $8.51 billion, down slightly from $8.57 billion and a drop of $9.01 billion in the first quarter.
Overall, the industry dropped by 1% sequentially but is still up 30% over last year and has a 20% compounded growth rate over a three year period.
Nokia returned to profitability, though at $180 million it's only about 2% of the top eight.
Motorola remained in the red with a small loss of $20 million, an improvement over the $90 million loss of the previous quarter. Motorola is being acquired by Google after an accumulated mobile operating loss of $4.69 billion since the beginning of 2007. It's unlikely we'll receive any updates on performance thereafter.
Samsung had a great quarter with a sequential increase of 19% and year-on-year growth of 130%. The total profit amounted to 25% of the peer group.
Sony Ericsson broke even with about $50 million in operating profit. Like Motorola its performance was barely break-even during the last four years and its also disappearing from our list of independent vendors as it becomes part of Sony.
LG had its sixth consecutive quarterly loss and is now appealing to investors for more capital to continue operating as a smartphone vendor. Raising dilutive capital seems a radical approach and not one that inspires confidence.
RIM had a sequential reduction in profit of 35% and y/y reduction of 30%. The company is exhibiting clear signs of decay and the stock market is valuing the company below book value.
Apple profit dropped by 19% but grew 43% y/y during a transitional quarter. The growth remains 43% compounded over three years.
HTC has a 1% sequential increase but a 78% y/y growth.
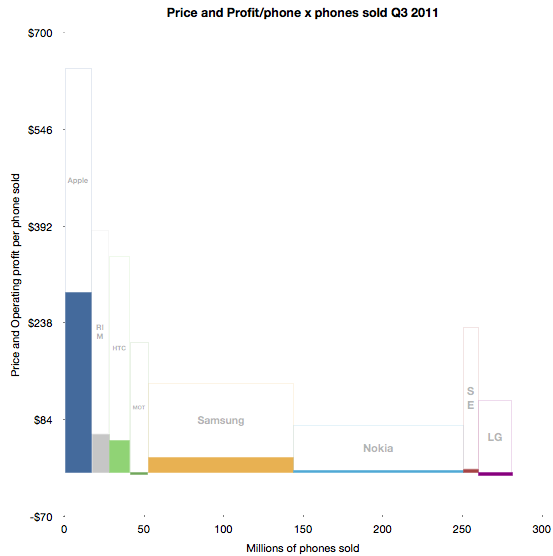
To illustrate the performance in terms of profit, pricing, volumes and margins, I developed the following chart.
The solid areas representing profit are operating profit/phone in the vertical axis and volumes shipped in the horizontal. The blank areas above are the cost of goods sold per phone and the combined solid and blank represent the average revenue per phone.
Some of the areas are over-represented due to the lack of resolution available.
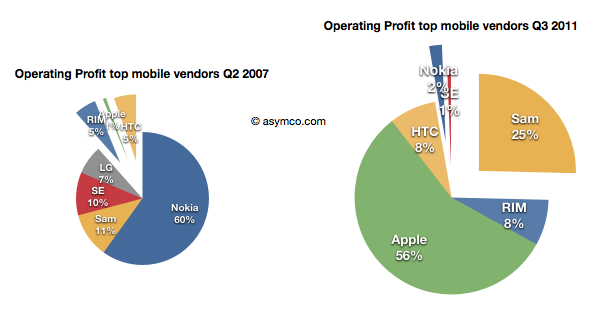
Using before-and-after pie charts for positive profits, we can see how the entrants (RIM, Apple and HTC) went from 6% of profits to over 73% four and a half years later.
I feel that this is somehow the end of an era. I've written before about the brutality of this market, listing 13 companies which were either merged or acquired or disappeared in the last decade. Now both Motorola and Sony Ericsson will soon be added to the list. On average, it's as if one phone vendor has disappeared every year for fifteen years.
And it's still not over. RIM is also becoming a going concern issue, and LG has a big question mark above it.
Of course, ZTE and Huawei and Lenovo are joining the list of competitors but I note that they are not focused on mobile phones. They are opportunistic phone vendors, depending on other businesses to compensate for the risks inherent in phone sales. It's interesting to note that neither Apple nor Samsung are pure phone plays.
In fact, of all the phone brands only RIM and HTC are exclusively phone-only companies. It may indicate something profound is happening. The notion that the development and marketing of phones as an activity independent of other business models may be coming to an end.
A few years ago, around the middle of the last decade, the mobile phone market was characterized by the rivalry between a few established vendors. These were Nokia, Samsung, LG, Motorola and Sony Ericsson. These incumbent companies had a broad portfolio of devices including smartphones and feature phones and basic phones. Many also sold networking equipment and were deeply engaged with their customers, network operators.
There was also a set of entrants who offered only smartphones. They were quirky. HTC was a a prominent "ODM" or original design manufacturer who built phones for companies who added their brands and sold and supported the product. HTC made phones and PDAs for operator brands and for some large PC companies. It also began to sell phones under its own brand. RIM was also offering products that had evolved from pagers into email appliances with added voice capabilities. But RIM's products were not very good as phones. Voice was so poorly integrated that many people carried both a BlackBerry and a voice phone. Then there was Palm with something called a Treo which promised many things but did not quite deliver.
In 2007 something happened which changed the industry. It took a few years to even realize it was happening but by the time it was obvious, it had changed to such a degree that huge companies found themselves in financial distress. This chart illustrates the effect.
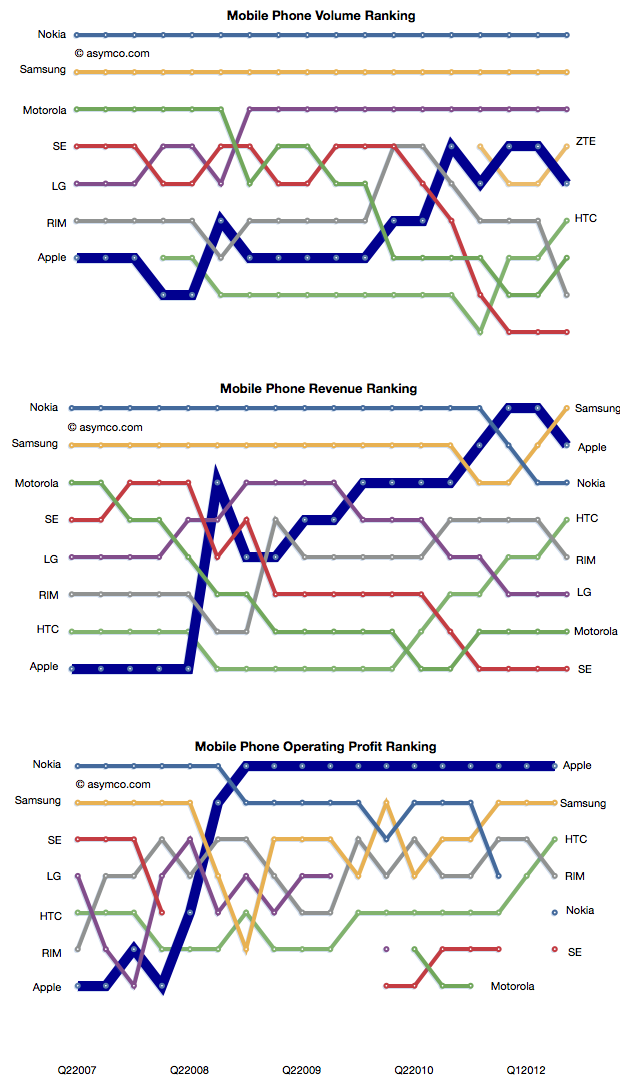
In a few short years the rivalry between incumbent handset makers has evolved into a rivalry between mobile platforms where the incumbents were caught in an increasingly unprofitable role of hardware integrators. Motorola is now being absorbed by a search company. Sony Ericsson is being absorbed into a consumer electronics company. Nokia is going through a potentially existential crisis and even abandoned its platform. Acquisition talk surrounds LG's phone efforts. Samsung is prosperous but sill at the mercy of its software suppliers. Even the entrants are starting to feel beleaguered. RIM, the oldest pure play smartphone company is trading below book value and has regressed in value to 2004 levels. Palm evaporated. A view into the changes is the rankings of the companies in terms of volumes, sales and profit as shown below.
How did large, powerful, smart companies let this happen?
It happened despite having a clear, front row view of the transition of the industry from mobile voice to mobile computing. The shift in the basis of competition from "connecting people" to "connecting people to data" ended up being a classic disruptive trap. Many will argue that it was the failing of individual managers. Perhaps, but how did they conspire to fail simultaneously?
When you see disruption happening, it's natural to seek out a cause, a pivotal magical "force" or event that enabled the weak to humble the strong--the proverbial sling that enabled David to defeat Goliath.
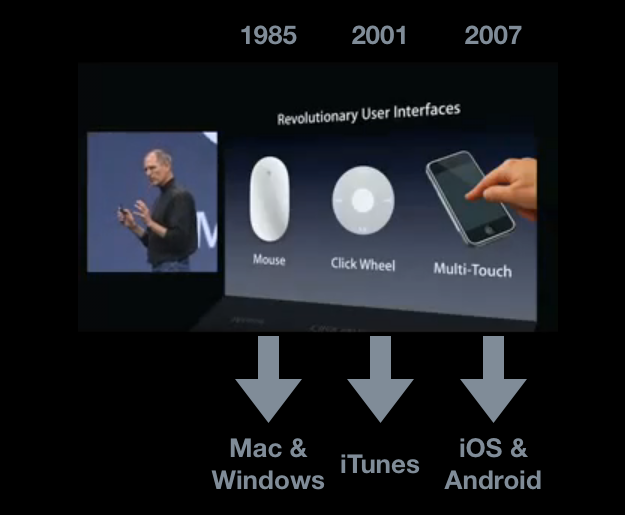
My hypothesis is that The Primary Cause for the shift of profits from Incumbents to Entrants has been the disruptive impact of a new input method. I illustrated this with the help of the January 2007 slide presented by Steve Jobs at the launch of iPhone.
Each new input method led to not just a disruption but new platforms and new business models. Each new "sling" victimized a set of historic companies. Mainframe and minicomputers, consumer electronics giants and now telecoms.
Just like David's sling, these technologies are not powerful in and of themselves, but rather, the way they are used makes them unpredictably sinister. The context of using capacitive touch on a handheld device rather than on a table-top makes it disruptive. Coupling it with high-speed mobile networks and powerful but efficient microprocessors made it into a force.
That is now ancient history. The consequences and repercussions are still being felt and weighed, but the smart money should be focusing on the next shift. From the time frame in the diagram above, it's clear that the cycle time between "Revolutionary User Interfaces" is shrinking. It's been five years since multi-touch. Is the next "RUI" already here? Is Siri the next RUI?
There are many things going for it:
It's not good enough
There are many smart people who are disappointed by it
Competitors are dismissive
It does not need a traditional, expensive smartphone to run but it uses a combination of local and cloud computing to solve the user's problem.
It is, in a word, asymmetric.
My disruptive hypothesis for Siri is that it shifts the competition from platforms positioned on a device to a "coupled" super-platform dependent on broadband and infrastructural computing.
Just after collecting enough data and observing patterns in it that give us clarity, It looks like things are about to change all over again.
This is a quick note that I'll be speaking at the Apple Investor Summit, March 15-16, at the Los Angeles Convention Center. My topic will be the analysis of Apple's capital structure for strategic insight.
Apple co-founder Steve Wozniak and Walter Isaacson, Steve Jobs' Biographer, will be keynote speakers.
The organizers are offering a Friends, Family & Followers VIP discount pre-sale from today until Friday, November 4th. Go to www.appleinvestorsummit.com to register at the discounted rate and check out the other speakers.
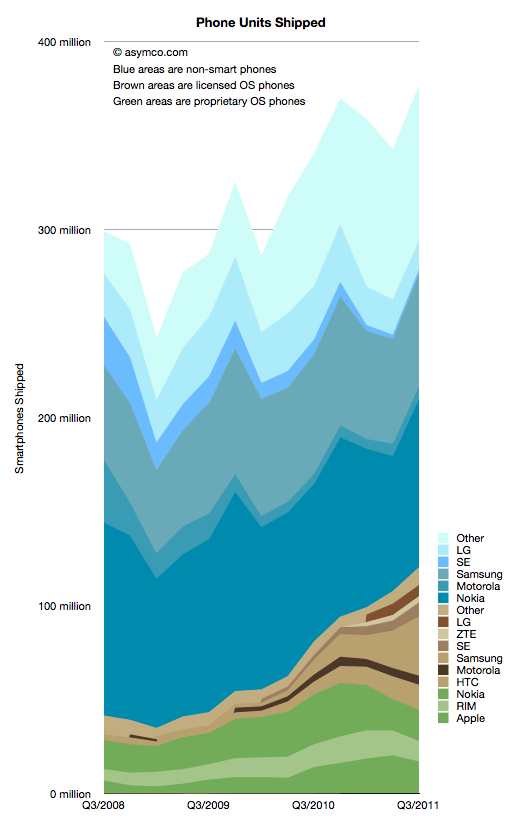
I collected all the data available so far and created a new graph that illustrates the complete market evolution over a three year period.
I chose a particular color scheme where shades of blue represent non-smart devices (think blue ocean), shades of brown are smartphones with licensed operating systems (Android for the time frame above) and shades of green as proprietary operating system smartphones. Multiple vendors are shown and those which sell both smart- and non-smart phones are shown twice. Note that the legend shows the vendors in the same order as the stacked areas.
There are several observations that are easy to make from this type of view:
The smartphone market is growing rapidly, not surprisingly. However, the overall market is also growing. Smartphones as a percent of total units sold is at around 31%, up from 14% in Q3 2008. Smartphone units however have tripled in the same time frame (from 40 million to about 120 million). This means that almost all of the market's growth has been smartphones with non-smart units barely increasing from 258 million to 272 million over a three year span.
Non-smart phones are far more seasonal than smartphones. As smartphones increase in share, seasonality should match that of the other phone types.
The number of branded smartphone vendors has increased significantly with "others" becoming a small part of the total. In contrast, the opposite effect is taking place in the non-smart market. Non-smart phone shipments have concentrated in two main brands and a large set of "others". This bi-polar industry structure points to where the value is migrating and hence where rivalry is increasing. We can use these shifts as indicators of industry maturity.
The opportunity for smartphone growth remains in the 70% un-penetrated blue area. However there is evidence that smartphone "switchers" are increasing with a noticeable decline in Nokia/Symbian and RIM. Apple's decline in Q3 is likely to be reversed in Q4 but Apple's share of all phones remains under 5%-- a five-fold increase in share from 2008 but a sign of how much is left to be done.
As Nokia shifts its Symbian portfolio to a licensed Windows Phone model the licensed cohort will tip over into an "all but two are licensees" line-up. This should be particularly worrisome as value is shifting to software and services and "super-platforms". But before the disruption is complete, there are still some cards to play. Samsung and Nokia have vast non-smart volumes to convert and it's unclear if they will do it with Android and Windows vs. layering their own proprietary Bada and future Nokia Linux platforms.
In the next few weeks I'll publish details of all the measures of the market but this first "landscape" view gives a good initial perspective. In the mean-time the data is accessible from the Asymco "cloud" here.
Samsung no longer reports mobile phone shipments. The company's phone market performance reporting is limited to the following:
Shipment : High-20%↑YoY (low-20%↑QoQ)
ASP : Slight increase QoQ
As the company did not report volumes or ASP last quarter either, the QoQ (Quarter on Quarter) growth estimates are almost useless. The only fragment that might be useful is the "High-20% YoY" given that they did publish units for Q3 2010: 71.4 million. This leaves the question of what "High-20%" means. Here are some ranges and what the result would be:
92.1 million assuming 29% YoY growth
91.4 million assuming 28%
90.1 million assuming 27%
The "best guess" might be 91.4 million.
As the company also provides revenue for its mobile division (14.42 trillion Won) we can therefore estimate the average selling price: $142. Is this a slight increase? By a similar approach, last quarter's ASP was $139, and assuming exchange rates did not vary widely, this increase is small enough to be called "slight".
We also have a figure for the operating margin for the entire Telecom group (16.9%) which gives an operating profit of $2.2 billion.
The last piece of the puzzle is the number of smartphones Samsung shipped. Samsung said smartphones grew "more than 300%" year over year. That would imply 31.4 million. One estimate is from Strategy Analytics that suggests 27.8 but it's coupled to an overall volume estimate of 88 million (well below the 91.4 million estimated above). The Wall Street Journal published an estimate of 28 million.
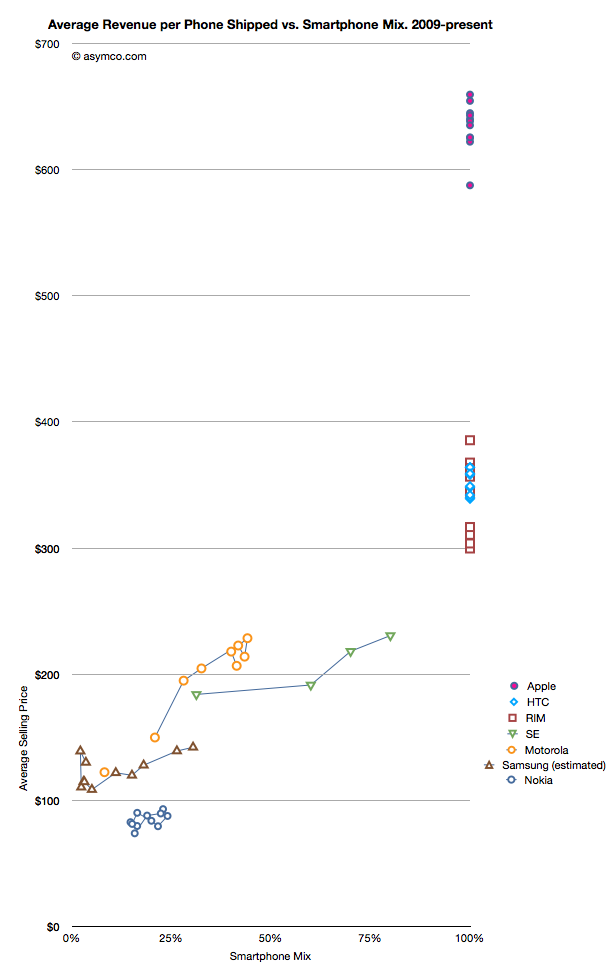
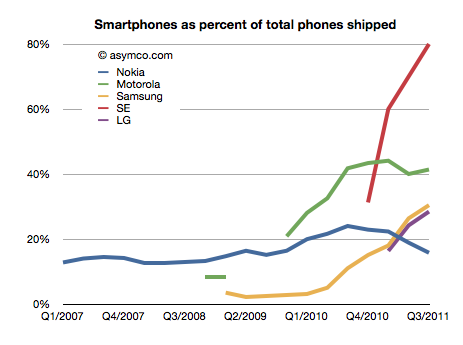
I have no idea how to narrow down this estimate, but if we go with the one that claims the highest precision (27.8 million) we get an estimate of about 30.4% of Samsung's volumes being smartphones (what I call the "smartphone mix"). That is an interesting basis for comparing Samsung's smartphone business to other companies' smartphones. I prepared a graph showing how pricing is affected by the increasing mix of smartphones in vendor portfolios.
What the graph shows is the movement of prices as companies have increased their smartphone mix since Q1 2009. For example Sony Ericsson moved from 31% smartphones to 80% smartphones in about a year. Their ASP increased from $184 to $231. Some companies have not changed their mix. Apple, HTC and RIM have maintained 100% smartphones in their portfolios so their pricing has been consistently high ($650, $354 and $357 over last 12 months, respectively). Conversely, Nokia has struggled with its smartphone portfolio and as a result its pricing has remained stubbornly clustered below $100.
But the most interesting companies to watch are Samsung, Sony Ericsson and Motorola. You can see how their "vectors" or price migration point toward the sweet spot where HTC and RIM reside. Ideally, they would be very much better off with pricing in the $300 range.
Samsung is moving quite rapidly toward the sweet spot but the slope is not as steep as the others. That's may be because SE and Motorola have much smaller volumes but it's still an open question why, with an estimated 30% mix of smartphones, the pricing remains $60 lower than when Motorola was at the same mix or $40 lower than Se.
Some of the answer might be due to the number of "low end" smartphones (Bada?) that Samsung is selling or maybe their non-smartphone pricing is trending down a lot more rapidly.
Keep in mind that if we change the assumption of the number of smartphones to a lower number (i.e. below 27 million) then the trajectory of the Samsung line in the graph would increase and may match more closely the slope of the other two vendors.
I don't have any reason to believe that it's lower than 27 million but I don't have any reason to believe that it's above 27 million either. It's an estimate.
If we believe it then we have to say that with a near tripling of smartphone mix (from 11% to 30.4%), the company grew its overall units by 28% and its revenue by 39% and pricing by 17%. Profits also grew by 130%.
It would follow then that switching to a 100% smartphone mix would make a lot of sense.
There has been increasing chatter about a new TV being developed by Apple.
My opinion on the subject was summarized in the post called Tele Vision. I contend that a TV cannot be smart until the content it delivers becomes smart. The logical conclusion is that the value chain needs re-integration so that the component which is not good enough (the content) can be improved along the dimensions that users value. And it cannot be improved unless the direction it needs to go into is aligned with the direction of the disruptive innovator. I won't repeat the theory here, but it suffices to say that whatever will change television will do so by re-defining the core product not just the tools we use to consume it.
But today I wanted to address another question: how do we value the opportunity? In a back-of-the-envelope manner, can we tell if this business is big enough to try to fix.
The answer depends a lot on the business model of the disruptive entrant. The entry could depend on software or advertising or hardware or distribution, and each would have a different valuation.
But for the sake of calibration, I want to start with a proxy. The basic question of how many "terminals" exist to the value networks. How many units of TVs are sold and how many could a new entrant convert to a new paradigm?
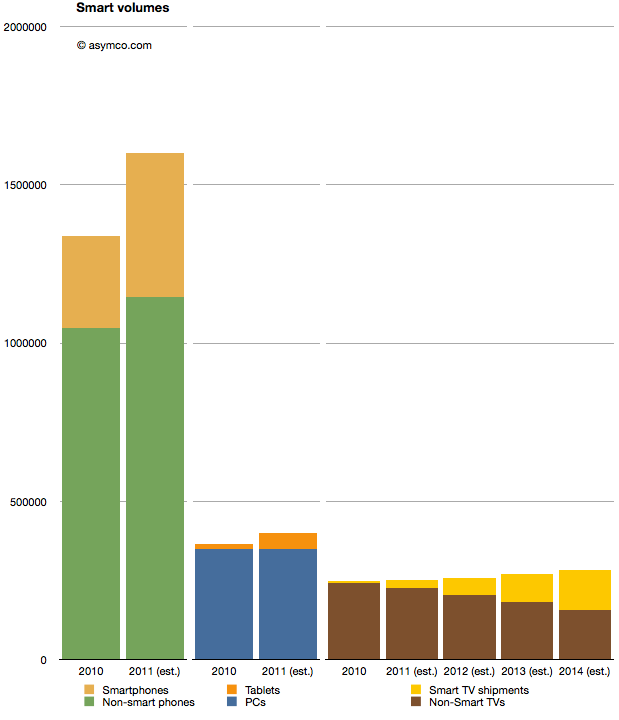
I prepared the following chart showing the world-wide TV market with a highlighted subset of so-called "smart TVs" (source TRi). The market is shown from 2010 actuals through 2014 estimates. To make it more interesting I also added similar data for two other markets. Mobile phones and PCs with their own sub-categories of smartphones and tablets as equivalent "high growth" opportunities.
When considering the opportunity, the Smart TV volumes are small relative to either tablets or smartphones. 2011 shipments are expected to be around 25 million Smart TVs, vs. 454 million smartphones and 51 million tablets. Looking forward, it seems that even by 2014, smart TVs will be smaller volumes relative to either (projected) smartphones or tablets.
A reason for this is that the TV market is not that big. It barely reaches 280 million units in 2014. Having reached saturation, the rate of growth is never assumed to be greater than 5%. The growth in the Smart TV business is assumed to be much higher however, being at least 100% in 2012, though off a low base.
But the concept of what "smart" means in this forecast is troubling. Christina Bonnington at Wired highlights many of the failings of Smart TV.
“In most cases consumers are buying a television with Internet connectivity as insurance. In other words, they are buying them just in case they need it in the future,” says Van Baker, a vice-president at the research firm Gartner. “Less than half of Internet connected televisions actually get connected to the Internet so clearly consumers don’t yet see this capability as a must have feature.”
There is vast under-consumption even if the devices are being purchased. This looks eerily familiar to the smartphone market before they became usable by the vast majority through the transformative touch input method.
So this market seems to be ripe for some serious re-definition. It may not be large today because there is nothing worth buying. Absent any innovation the forecasts can only foresee more of the same. If there is a breakthrough which "cracks" this puzzle then we might indeed witness unforeseen opportunity.