Asymco

Asymmetric Intelligence

Research

  1. More media tablet hype

    Research · 66 comments

    The iPad is still only slightly more than a year and a half old. Forecasting unit volumes has proven very difficult. But more than that it's proven very difficult to appreciate the impact on the market it's disrupting, PCs.

    For some people this is obvious, but what if you don't live and breathe disruptive theory? What if you don't watch every data source like a hawk for hints of change? What if you are not even a technologist. How would you form an opinion on the effect of the iPad on PCs?

    There are many industries and sectors about which I know nothing. If you asked me to analyze a market like industrial lubricants, I'd probably start by reading the consensus opinion put forward by the leading market analyst, an expert in that particular sector. That would form the baseline.

    In the PC sector, that opinion is formed by Gartner (and IDC and Forrester perhaps). Gartner will get a lot of citations and its stats and opinion forms the baseline view. It may not be right, but we can expect it to be the "consensus". This is because Gartner surveys a lot of data and interacts with a lot of insiders in the industry. They collect and weigh these inputs and put out what is likely to balance them all.

    If Gartner says that the iPad is a "media tablet" that is not a PC they may be wrong. But they are also repeating what the PC industry is saying. So I value Gartner as a reflection of the consensus. If there is a significant gap between Gartner and what I conclude to be reality then there is an interesting opportunity as well as evidence of incumbent ignorance.

    Let's then look back on how Gartner has been reporting the iPad's rise and the PC's decline.[1]

    Q2 2010

    "The consumer PC market registered double-digit shipment growth, but consumer mobile shipment growth slowed. This was due in part to slower growth of mini-notebooks," Ms. Kitagawa said. "Surging popularity of Apple's iPad temporarily cannibalized mini-notebooks, as well as consumer notebook sales to some degree. It is not certain at this stage if the cannibalization will continue with the current price point of media tablets."

    Q3 2010

    "Media tablet hype around devices such as the iPad has also affected consumer notebook growth by delaying some PC purchases, especially in the U.S. consumer market. Media tablets don't replace primary PCs, but they affect PC purchases in many ways," Ms. Kitagawa said. "At this stage, hype around media tablets has led consumers and the channels to take a 'wait and see' approach to buying a new device."

    Q4 2010

    “U.S. holiday sales were not fantastic for most PC vendors, but the professional market did show healthy growth during the quarter,” Ms. Kitagawa said. “Media tablets undoubtedly intensified the competition in the consumer market. These devices do not replace primary PCs, but they are viewed as good enough devices for these who want to have a second and third connected device for content consumption usage. Mini-notebook shipments were hit the most by the success of media tablets.”

    Q1 2011

    "Weak demand for consumer PCs was the biggest inhibitor of growth," said Mikako Kitagawa, principal analyst at Gartner. "Low prices for consumer PCs, which had long stimulated growth, no longer attracted buyers. Instead, consumers turned their attention to media tablets and other consumer electronics. With the launch of the iPad 2 in February, more consumers either switched to buying an alternative device, or simply held back from buying PCs. We're investigating whether this trend is likely to have a long-term effect on the PC market."

    Q2 2011

    Overall shipments of media tablets took place late this quarter and volumes remained low, minimizing any impact of the media tablets for PC substitutions in the second quarter of 2011

    Q3 2011

    "The main contributor to the weak consumer PC market in the U.S. was intensified competition for consumers' money," Kitagawa said "Media tablets and smartphones took center stage in the U.S. retail sector, and the expectation is for continuing demand for these devices throughout the holiday season."

    I've added emphasis for the key words describing the impact of the iPad (referred to as "media tablets").

    Note how the message changed over time. At first the effect was thought to be temporary (presumably due to "hype"). Three months later the "hype" was leading to "hesitation" in the channel. Three more months and there was "a hit" on Mini-notebooks but only for those needing a second or third device for "consumption". In the fourth report it seems that "consumers" (vs. business users) are really interested in this. The fifth report suggests that the effect is "minimal". The latest report suggests that this is a "localized effect".

    An external observer (or paying customer) reading this must conclude that five quarters in, these media tablets are having some effect but most probably a transient one. By keeping tablets separate from PC's Gartner is implicitly stating that the two products do not compete. If they have an effect it's on the discretionary spending by consumers. Similar to the effect game consoles or consumer electronics may be having on PCs.

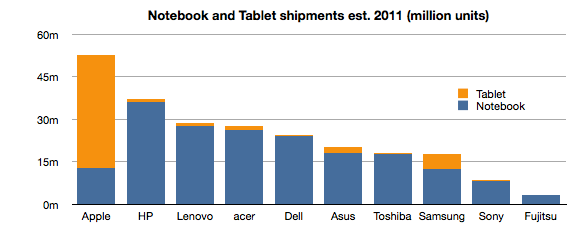
    However, if tablets were added to notebook totals the chart for 2011 would look like this:[2]
     

    Notes:

    1. The quotes are from periodic reports (every quarter) from the same analyst at the same firm using a consistent set of measurements about the market. In order to ensure the same context, I've selected the comments from press releases published using the same template.
    2. Source: Digitimes Research, compiled by Digitimes, October 2011
  2. Windows Phone, a year on

    Research · 102 comments

    Windows Phone is in limbo. The company acknowledged that it has performed below expectations. During the last quarter for which we have data (ending June) I have an estimate that Windows Phone sold only 1.4 million units (Gartner's sell-through analysis suggests 1.7 million). That gives Microsoft a 1.3% share of units sold (Gartner 1.6%), a new low.

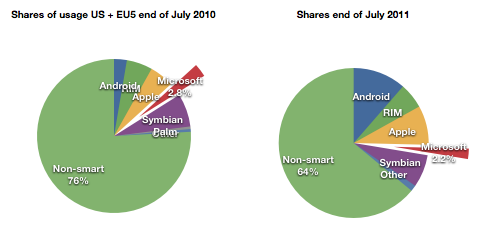
    At the same time, comScore data shows that user erosion in the US and EU5 has slowed and is holding at about 2.2% of all users.

    For its part Microsoft has lain low during the last few months. It released version 7.5 (Mango) last month to manufacturers.  It has a number of Windows Phone SKUs in the market or recently announced (27 with version 7 and eleven with version 7.5)

    It also sued Android vendors successfully and obtained royalties from the largest Android licensees Samsung and HTC. Patent royalties from Android are probably going to be higher than license revenues from Windows Phone for quite some time.

    Something is missing from this analysis. Clearly Microsoft has a plan. It's always had a plan. The plan is not easily perceived because the market Microsoft addresses itself to is not directly to the consumer--we cannot read the message. Microsoft needs to work through partners. Device vendors and operators mainly. In order to persuade them Microsoft deploys its check book.

    Put another way, the plan is that Microsoft intends to buy market share. Before we get into exactly how, we need to understand the most important but least discussed contributor to device sales: channel incentives.

    Before a phone is sold it needs to get through a mine field of obstacles: it needs to appeal to operator or distributor priorities; it needs to fill a slot in a portfolio of products for the manufacturer and the channel; it needs to acquire shelf space; it needs to appeal to some end users and, unless it has a blindingly strong brand, it needs to offer incentives to the retailer.

    This last piece of the puzzle is something of a mystery. Although not a universal practice, in many cases retail staff are paid commissions directly or indirectly by the device vendor. This relationship between the retailer and the vendor is not transparent. A buyer typically does not know what incentives are attached to a given device. Stories of salespeople steering people to and away from certain devices abound.

    Microsoft acknowledges this:

    Both Samsung and HTC Corp. have committed to increasing marketing budgets for the phones, said Andy Lees, president of Microsoft’s mobile unit, in an interview. While manufacturers will determine how the money is spent, some of it will probably go toward spurring retail staff to tout Windows Phone models, he said.

    Microsoft Phones to Get More Marketing, Sales Incentives - Bloomberg.

    In another interview:

    Q: It seems like one of the challenges is getting the salesperson in the store to push the phone.

    A: Absolutely. I think that's a number of things:

    One — they get influenced by how good the product is. The reviewers have influence with that and also their own experience.

    The second thing is the alignment with the operator. I think we're already pretty aligned and over the life of this release, we'll get even more aligned.

    Much more here: Business & Technology | Windows Phone chief Andy Lees sees time ripe for Mango | Seattle Times Newspaper.

    What's more, Microsoft and Nokia have a deal whereby at least one billion dollars from Microsoft are earmarked for the promotion of Nokia Windows Phones.

    Even prior to the launch of the Nokia relationship, with the original Windows Phone launch exactly a year ago, Microsoft made clear that it had a budget for promoting Windows Phones ($400 million in fact). In the event, the money seems to not have been spent, or spent sparingly because LG made public its disappointment. The coded language can be interpreted as a snub to Microsoft for withholding promised funds.

    Perhaps the funding was withdrawn because by the time the launch was scheduled, the Nokia deal was being negotiated. Perhaps Microsoft felt it better to put more effort behind the re-launch of the platform with Nokia on board. A re-launch which has yet to happen but seems to have already had $127 million allocated to it by Nokia alone.

    Microsoft is proud of what it has accomplished with Windows Phone because they were able to update the OS in 11 months and took only about two years to completely rebuild Windows Mobile into Windows Phone.

    But the dependence on a complex value network means that products do not reach users quickly enough and when they do the marketing message is weak, even when backed by large budgets. The real problem with Microsoft's approach is that it's neither viral like Android (because it has a price and a contract associated with it) nor is it focused and agile like Apple's. It seems to suffer from the worst aspects of modularity (market lag) without benefiting from the control over the ecosystem and end user experience that differentiates it.

    Microsoft will muddle through but the 20% share that it says is "conservative" seems anything but.

  3. How many iPhones will be upgraded next year?

    Research · 70 comments

    Last week I proposed that there were two significant markets for the new iPhone: 1) the existing iPhone user base 2) smartphone "non-consumers". Today I want to dig a bit deeper into the first market to get an idea of what it amounts to.

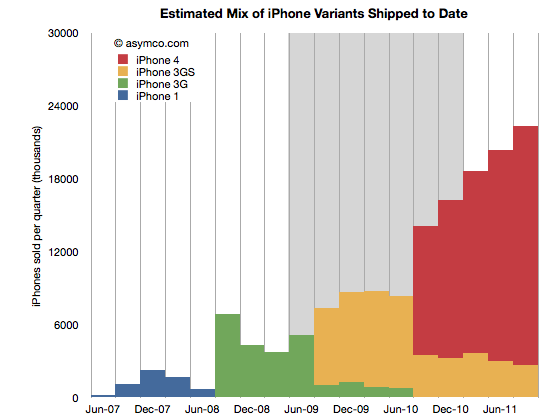
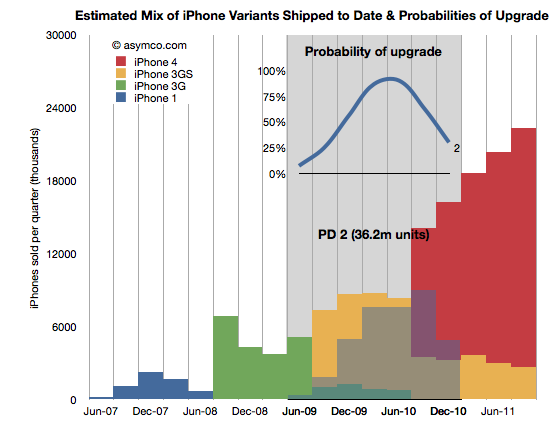
    The following chart shows the total iPhone shipments over time with an estimate for the mix of models during the last two years.

    The way I calibrated the mix is by taking into account the statement that Tim Cook made that half of all iPhones shipped were iPhone 4. I first estimated that this past quarter (ending September) included about 22.3 million units. That makes the total iPhones to end of Sept 151.3 million. Half would be about 75 million. Therefore the red area needs to add up to that total. The remainder must therefore be the yellow, 3GS volume.

    This mix implies that the following shipments by variant (through end of Sept 2011):

    • iPhone 1: 6.1 million
    • iPhone 3G: 24.4 million
    • iPhone 3GS: 45.4 million
    • iPhone 4: 75.4 million

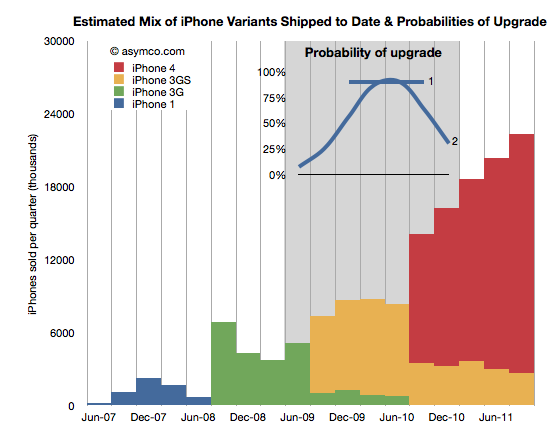
    I also highlighted in grey the most likely target market for upgrades during the next 12 months. What I'm assuming is that recent buyers will not be likely to upgrade but those having purchased an iPhone two years hence will probably be looking to replace it. The naive approach is to assume all the iPhones beyond a certain age will be automatically upgraded. That would give almost 70 million units. However, not all those phones are in use and many of those phones may have already been upgraded to iPhone 4s. 70 million is a theoretical maximum. We have to be more specific.

    In order to get a better figure for this I created a probability distribution (PD) which suggests the likelihood that the phones purchased in that quarter get upgraded in the next 12 months. I created two such PDs illustrated in the inset chart below:

    PD 1 is the simplest. It assumes that 90% of two year old iPhones will always be upgraded. PD 2 is a bit more nuanced where it assumes that there is a range of probabilities over a wider period, but with a peak in the 2 year old zone. These PDs are guesses but consider them starting points for debate.

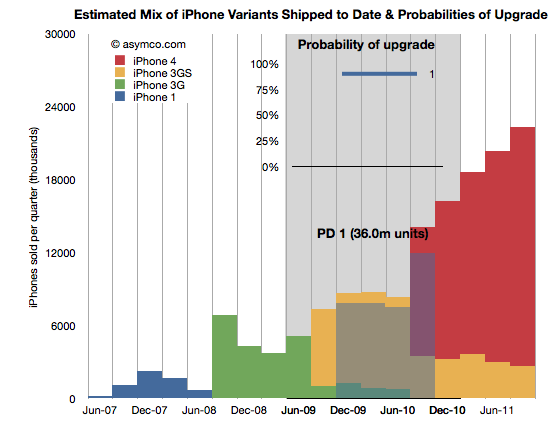
    By multiplying the probability in the line chart (PD1) with the area below it (the units it covers) we get get the shaded area indicating which phones (and variant) will be upgraded next year.

    The areas not shaded are either left un-upgraded or represent phones which were already upgraded to iPhone 4's last year. The PD1 assumption yields 36 million units.

    Doing the same with PD2 yields a different upgrade set shown below:

    This assumption leads to about 36.2 million units upgraded in the next 12 months. Very similar to PD1 but approached from a different angle. Are these figures credible? I don't know. The real PD may be quite different but I think these are pretty conservative figures. They are about half of the theoretical maximum.

    Why is this Interesting?

    This is interesting because of two reasons.

    Firstly, it lets us calibrate our forecast for iPhone sales next few quarters. My own estimate stood at 140 million prior to this analysis. Is it reasonable? Remember that the target market includes non-consumption or non-iPhone, non-Smartphone users. Given the "guaranteed" market above at least 36 million, it makes the non-consumption target about 104 million. Does it sound reasonable?[1]

    Yes. Primarily because most iPhones sold during the last 12 months were sold to non-consumers. And there were 76 million of them. Apple's distribution has increased since and will continue to increase[2]. That means that Apple does not need to stretch much more than it already has to get the additional growth from un-penetrated markets. We know that this market is still measured in the billions of users. The demand is there.

    Secondly, this is interesting from a competitive point of view. When competitors like Microsoft claim that Apple left open an opportunity by not launching a new iPhone "5" they are not looking at the world through the lenses shown above. From their point of view each new phone sold must come from their installed base or non-consumption.

    But they don't have any installed bases over 2 years old looking to upgrade. There are few Galaxy users who are yearning to upgrade since they just bought their first units. There are no Windows Phone users (and no Windows Mobile users) who are ready to upgrade to Mango. Since they don't don't see the world through upgrade "lenses" they see their marginal buyer as somebody who might have bought an iPhone 5 because it was the latest and the greatest in terms of specs or novelty.

    However they cannot be hopeful that any existing iPhone buyer will switch because they know the satisfaction scores are above 90%. They also know the legendary Apple brand loyalty that keeps Mac and iPad and iPod users glued to their devices. They are also aware of the moats of iTunes, iCloud, hundreds of installed Apps and iMessage all designed to preserve Apple's customer base.

    Competitors have none of these things. They don't have upgraders, or switchers to target. They can only target non-consumers. There their odds are better but Apple's are at least as good.

    ---

    Notes:

    1. The 140 million target for next 12 months is probably well above consensus. It assumes a growth rate of 84%. I've seen a few estimates where the growth is forecast at less than 30%. If we are to believe the analysis above, the consensus begins to appear catastrophic.
    2. Apple's distribution measured as number of carriers and countries covered is still about half that of RIM and about a third that of Nokia or Samsung.
  4. The new iPhone portfolio and implications on ASP

    Research · 74 comments

    The iPhone portfolio is now larger than ever. It's arguable that, for the first time, we can actually call it a portfolio vs. the [n, n-1] pair of products that's been available to date. A year ago I even argued that the n-1 variant of iPhone was more of a cognitive illusion than a real alternative.

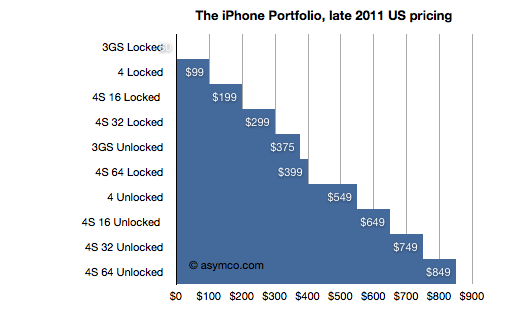
    But that all changed last week. For the first time since launch, there is a real portfolio. The iPhone is now available as five different variants with 10 different price points. Prices and options may vary by country, but I took the US portfolio as the baseline and illustrated it:

    Including all the pricing options It's a very regular pattern. It reminds me of the iPod which, at one time was sold at every $50 increment point from $50 to $500. The logic behind this pattern is that "there is now an iPhone for every budget". Of course, as with any purchase decision, each of these price points has trade-offs. Considering product performance or in terms of option value, the buyer has many things to weigh.

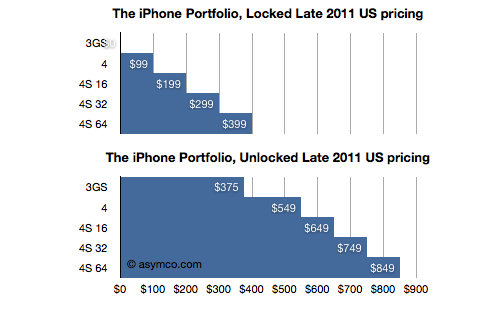
    To simplify, I divided the options into two subsets: Locked and Unlocked.

    We can now see the premium for unlocking (or, the discount for losing the freedom to use the phone on another network, as the case may be). We can also compare unlocked prices to unlocked prices for competing products.

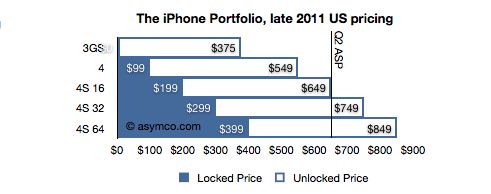
    To assess it further, I combined the two charts above into one, superimposing the unlocked price onto the locked price.

    In this last chart it becomes clear that buyers who purchase an unlocked phone are paying $450 more (the white areas), regardless of the phone's spec (except for the 3GS where the difference is only $375). For locked phones, the $450 discount is, presumably, the value of the change of carrier (GSM only) option for a buyer.

    But there is more to this picture. The unlocked price is also the price that Apple sells its product direct to consumers, many of which will be traded in secondary markets world-wide. Many will be sold in countries where Apple does not have distribution agreements with any operators. Because Apple needs to avoid channel conflict, they cannot price the unlocked product lower than they sell it to their channel. As a result, the unlocked price must be very nearly the price that operators themselves pay (excluding any volume discount).

    We can actually confirm this because Apple publishes the average selling price (ASP) that Apple obtains from the iPhone. I made a line in the last chart at the price Apple got in the last quarter.  It falls very nearly around the mid-point in the portfolio (and thus assuming the mode equals the mean and median in the distribution of sales.)

    There is one further implication in this. I think it's a safe assumption that the ASP for the new portfolio will be largely unchanged. Although Apple introduced the lower price for the 3GS ($375), it also added a more expensive 64G option. The lowering of ASP with the 3GS may be offset by the additional high-end sales, especially early on.

  5. Can the BlackBerry recover?

    Research · 73 comments

    The August comScore mobile survey (MobiLens) is out. It measures the penetration or consumption of various mobile products and services in the US over a three month period.

    I track the change in this data over time. Here are some highlights:

    In August about 520,000 users switched to using smartphones (from non-smart phones) as their primary phone. This is a bit down sequentially from July but about average for the period starting January 2010.

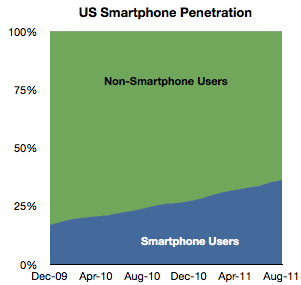
    Penetration increased by about 1 % to 36%.

    Extrapolating this growth implies 50% penetration by September 2012. However growth is accelerating slightly so that tipping point may come sooner. Separately, T-Mobile reported that 75% of its device sales during this year have been smartphones, so if this is indicative of overall US market, then by next year it may in fact be quite difficult to find any non-smart phones to buy.

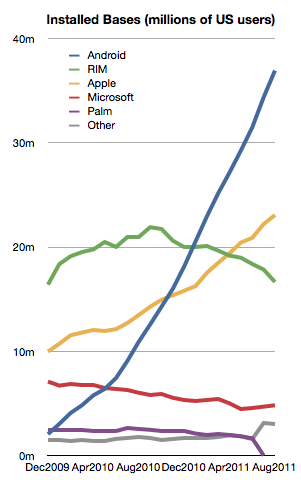
    Among the smartphones, the different OSs have the following installed bases:

    The growth in both Android and iOS has been fairly constant for the last 18 months.

    Microsoft seems to be stabilizing at around 6%

    But RIM shows an alarming deterioration. The company has lost 4.3 million users in the last year and is now at about the same number of users it had in late 2009. This is in a market that has more than doubled.

    With only about 16.5 million US users and an average loss of half a million users per month, unless something drastic happens, RIM could lose its entire US user base by the end of next year.

    During the last month alone RIM lost 1.2 million users. Management insists that new devices will boost sales but here we're measuring the erosion in core users, not upgrades. It's much more likely that those 4.3 million who left BlackBerry went to other smartphones. To move from a BlackBerry to a feature phone seems very improbable to me.

    That means that BlackBerry's pain is probably iPhone or Android's gain. This sort of switch is often painful and I can only imagine that it's done with some reluctance. All the more remarkable then that RIM could not offer incentives to stay. The BlackBerry brand is fading rapidly and brand value is very hard to re-build.

    There's one more thing.

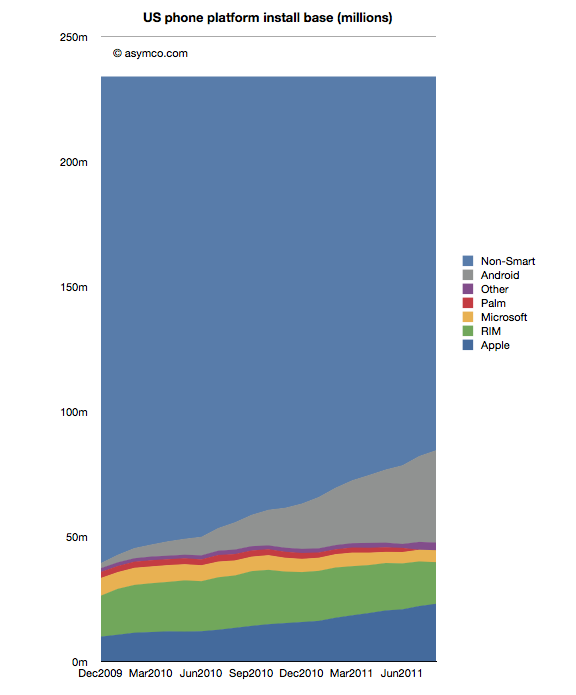
    We can see platform rivalry in the installed base chart but the bigger battle is the competition with non-consumption. The following chart shows how overall platforms are faring as they carve up the feature phone market.

    There are still 150 million Americans whose primary phone is not a smartphone. The conversion of those users is happening at a consistent pace but there are many years of growth remaining. I've often wondered if and when this pace would moderate. I suggested perhaps at 50% there would be an inflection point as the "easy money" would already have been made.

    Much of that will depend on how the product (device + service) will be priced. It's hard to get data on overall pricing. We can get some subsidized phone prices (for example now ranging from $0 to $400 for iPhone and probably similar for Android). What we don't have is an average device+service price point for the industry. That's what I would like to keep an eye on.

  6. Steve Jobs didn't

    Research · 114 comments

    • Steve Jobs did not create products. He created an organization that predictably and reliably created emotionally resonant products.
    • Steve Jobs did not make movies. He made a company that predictably and reliably made blockbusters.
    • Steve Jobs did not wrest market share from competitors. He created new markets that attracted and sustained competitors.
    • Steve Jobs did not design anything. He gave others the freedom to think about what jobs products are hired to do.
    • Steve Jobs did not re-engineer processes. He brought engineering processes to works of creativity and the creative process to engineering.
    • Steve Jobs did not develop new management theories. He showed by example that innovation can be managed.
    • Steve Jobs was not a visionary. He put the dots together and saw where they led.
    • Steve Jobs was not a futurist. He just built the future one piece at a time.
    • Steve Jobs did not distort reality. He spoke what he believed would become reality at a time when those beliefs seemed far fetched.
    • Steve Jobs was not charismatic. He spoke from the heart compelling others to follow him.
    • Steve Jobs was not a gifted orator. He spoke plainly.
    • Steve Jobs was not a magician. He practiced, a lot.

    He had taste. He was curious. He was patient. He was foolish. He was hungry.

    These things many others can do. Maybe you can.

  7. At $2.9bn/yr apps are challenging songs as the most valuable online medium

    Research · 16 comments

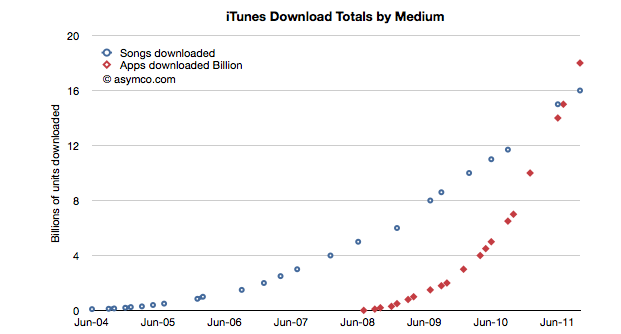
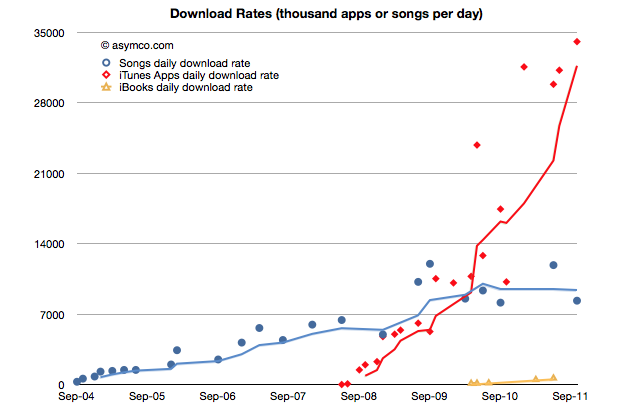
    During the October iPhone event Apple gave an update on the app and song download totals. This is a reliable gauge of the iTunes ecosystem performance and Apple has been supplying these numbers for several years.  Plotting these numbers gives us a good idea of the trend in mobile content consumption. Here is the data to date:

    The total number of apps downloaded (excluding updates) overtook songs in June/July and continues on its trajectory. In fact, the rate of downloads for Apps is now over 1 billion / month. Given the data points above, I calculate it to be about 34 million per day. The corresponding rate for songs is 8.3 million per day.

    You can see the rate of downloads as it's changed over time here:

    I used trailing four periods' moving average for the lines to show the trend more clearly. The gap in download rates is large and increasing.

    Now most observers would note that songs are much more expensive than apps, especially since there are no free songs and many apps are free. This would imply that the music business is probably more valuable than the app business.

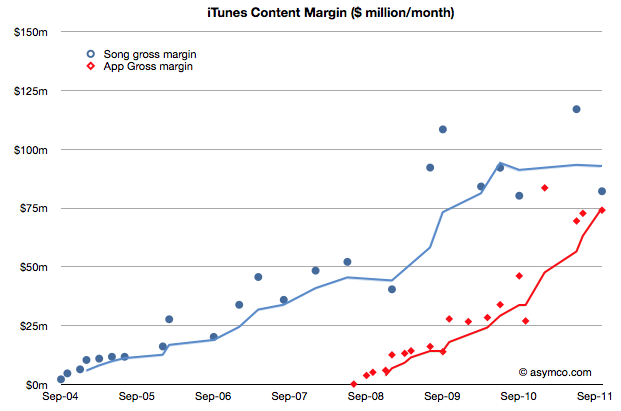
    That's true, but not by much. To determine how much, I used the other data point offered: $3 billion in payments to developers. Since that represents 70% of gross revenues to Apple, we can determine that the average price per app is now 23.8c (down from 28.5c in April 2009)[1]. Knowing the app price we can plot both revenues and the margin that Apple keeps.

    We can compare that with the margin that Apple keeps from songs (assuming a price point of $1.2 per song and a 73% pay-out to labels.)

    The data jumps around quite a bit but the trend is pretty clear. After paying the content owners, iTunes is left with about $75 million per month from apps and $85 million per month from songs.

    Apple then needs to pay other direct costs like credit card processing, bandwidth, storage, curation and testing. Then there are other operating expenses like R&D and marketing. These costs add up such that, according to Apple, they cover revenues, yielding a break-even operation.

    Break-even or not, the way the data is trending it's pretty clear that Apps will be responsible for a the majority of content cash flow at Apple.

    At a billion downloads a month (and rising) the value in terms of revenues is already a run rate of $2.9 billion per year. This has been enough to overtake a business that has been running for more than seven years.

    ---

    Notes:

    1. The payments to developers probably includes in-app purchases.
  8. Why is there no iPhone 5?

    Research · 243 comments

    I've been asked what will be the effect on the market of the iPhone 4S. Actually the question was what would be the effect on the market of there being no iPhone 5.

    I'd answer that the iPhone 4S is a product designed to compete for two markets: (1) half the current iPhone users who bought a phone prior to the iPhone 4 and (2) non-iPhone users, typically non-smartphone users.

    I'll describe each market briefly.

    The current iPhone users

    Tim Cook said that half of all iPhones sold to date have been iPhone 4's. That means that about 70 million iPhone 4's have been sold. Those are not a target market because of three reasons:

    1. The vast majority of those users are still paying for their iPhone 4 through the subsidy model used to sell them and to change phones today would incur a cash penalty.
    2. Customer satisfaction surveys show that they have 90%+ satisfaction rating for their iPhone 4 and we can therefore assume that they are not looking for something better
    3. Their iPhones are practically new and they still work and are upgradeable.

    The other 70 million or so iPhone users have either a 3GS or a 3G iPhone. These are a very different market for three reasons:

    1. They have already paid off their iPhones. They would not face any extra costs in switching to a new iPhone
    2. Earlier customer satisfaction surveys showed that they once had 90%+ satisfaction with their product so they are likely to stay with the brand.
    3. Their iPhones are getting old and beaten up after two years of use.

    The current non-iPhone non-smartphone users

    This market is so vast that it's practically infinite. Over 1.5 billion phones are sold each year and Apple only has about 5% share. Therefore there is a vast pool of users who probably have been interested in getting an iPhone. These potential buyers will find the iPhone 4S an attractive alternative to buying a non-smart phone. They will also notice that there is now a range of price points for various iPhone models starting as low as zero.

    Current non-iPhone smartphone users

    I'll add this market to complete the picture. This market is similar to the current iPhone 4 market because, except for Blackberry, most smartphones have been purchased in the last 12 months. This is especially true for Android phones. These owners of smartphones are unlikely to be interested in switching a phone that is "brand new" unless they have a very poor satisfaction with it. If they are not satisfied, there are many options, and iPhone is one of them. There are too many conditionals in this market and I therefore don't think it's a good target for the iPhone 4S.

    So What are the prospects for the iPhone 4S (and other iPhones)?

    The market for the new iPhones could then be summarized as follows: 70 million early generation iPhone users who are eager to upgrade (with 90% probability) plus a subset of a billion buyers of new phones next year who are looking for their first smartphone. These two markets iPhone 4S is targeting are "easy" because the competition is weak. It's either "don't upgrade my old iPhone" or "buy a dumb phone or another smartphone for almost the same price as an iPhone".

    I don't see the result for units sold being different if there was a hypothetical iPhone 5 vs. the current iPhone 4S (and 4 and 3GS as a portfolio). In fact, a "better" iPhone would not be better at winning this competitive battle because the bar is so low.

    So to answer the question in the headline: because an iPhone 5 is not needed meaning that it would over-serve the market and price itself out of contention.

    The question will be very different a year from now when most early Android buyers will be looking for a new phone and when most iPhone 4 users (all 70 million of them) will be looking for a new iPhone. That would seem like a good time to introduce a new iPhone "5".

  9. Sprint's gamble

    Research · 61 comments

    The Wall Street Journal reported that Sprint Nextel made a "multibillion-dollar" gamble on the iPhone. This is based on information that Sprint committed to buy 30.5 million iPhones over the next four years.

    Wall Street Journal reporters calculated that the deal is worth around $20 billion on the basis of iPhone ASP during the last quarter (about $650). That Sprint would get that price is possible but not necessarily correct as there is likely to be some discount and the ASP Apple receives includes accessories.

    But the "gamble" is more than the deal value. The way it's being reported is that Sprint bet the company on being able to sell this many iPhones. So naturally we have to ask: how hard can it be to sell 31 million iPhones?

    First, note that the order is over a four year period. It's also not likely to be linear, with volumes accelerating over time. If I estimate a ramp where in year one the commitment is for 4 million, year two 6, year three 9 and year four 12 million we get a total of 31 million. Can Sprint sell this volume?

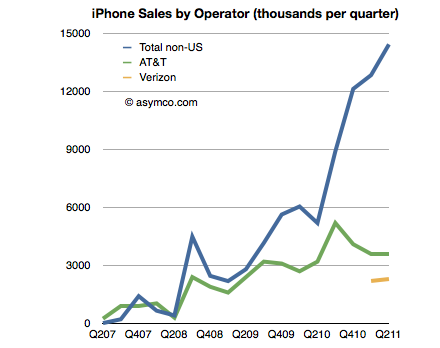
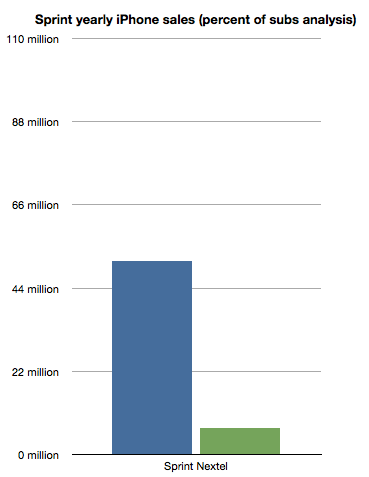
    To get an idea we can look at the sales rates for the other US operators. I built a table of iPhone sales by Operator last July. The data is shown in the following chart:

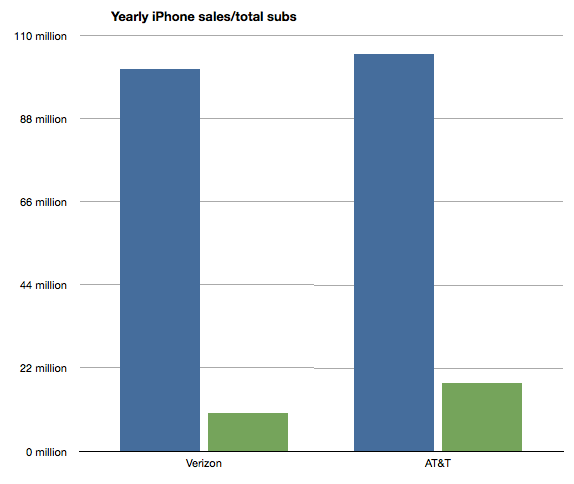
    What is interesting is to see the number of iPhones sold in a given time frame as a percent of subscriber base. I chose to measure a year's worth of iPhones where I extrapolated Verizon's volumes from the six months reported so far.

    The ratios are that Verizon sold iPhones at the rate of about "10% of its subscriber base per year". AT&T has been selling at the rate of about "17% of its subs per year". If we average these two we get about 13.6%.

    So if we assume that Sprint can sell iPhones at about the same rate as Verizon or AT&T (as a percent of their user base which was 51.1 million) we get about 7 million iPhones per year.

    That's right in the middle of the range it needs to get to 31 in four years [4,6,9,12]. I charted the projection on the following chart:

    So the gamble Sprint is taking is that they will be able to sell iPhones at the same rate as Verizon and AT&T.

    How is this risky?

    The deal seems to be inline with what is known about the product's popularity and the pattern of purchasing and upgrades that US consumers have been exhibiting for a few years.

    As with AT&T and Verizon, volumes ramp up over time. As with AT&T, users are loyal and they upgrade regularly. As with Verizon, there is competition from Android and Blackberry. As with both, payment is expected up-front with payback over the duration of contract length. As with the others, there will be incentives to keep churn down.

    If anything the riskiest thing for Sprint would have been not to do the deal at all. Indeed, we'll get to see the effect of that option on T-Mobile.

  10. iOS vs. Microsoft: Comparing the bottom lines

    Research · 60 comments

    I began comparing Microsoft and Apple's financial performance with a review of "top line" or revenues by product lines over a four year period.

    This post is about the "bottom line" for the same companies and products.

    Before I jump in I would like to make sure there is no confusion about the terms. I will be comparing "operating income"[1] as a measure of "bottom line". This is a common way to compare the profitability of companies because it excludes taxes and interest income. These non-operating expenses/income can distort a comparison of performance because they can be the result of investment activity or changes in tax law or where the company is domiciled. One should not make judgements of comparative performance on those non-operational bases.[2]

    Another challenge is that some companies report operating income by division while others don't. We can usually compare overall operating income but usually not on a division or product-level. This is the challenge I will try to overcome in this analysis between two very different operating models.

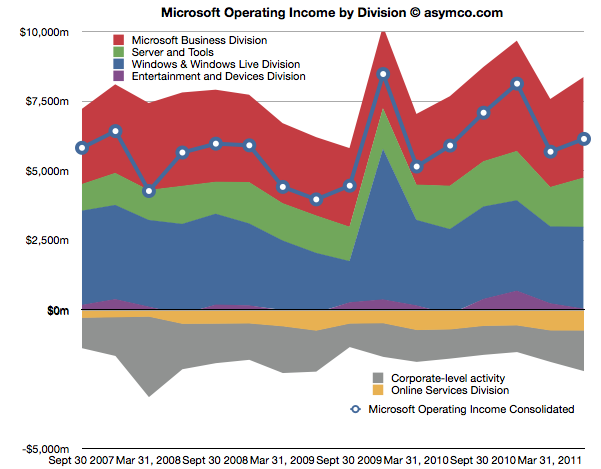
    The first chart shows Microsoft's Operating Income by Division as reported by the company.

    Each area represents a business division. Note some are showing negative income (losses).I've added a line representing consolidated operating income which is the sum of all areas (including the negatives).

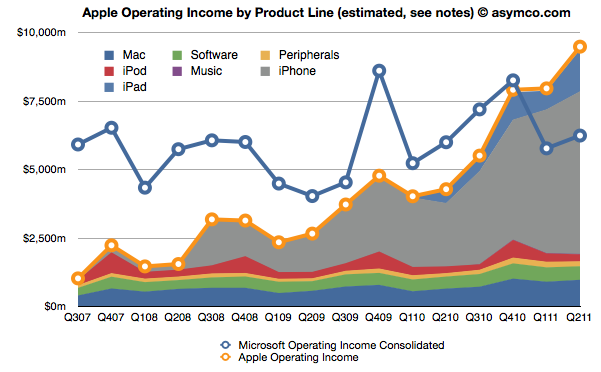
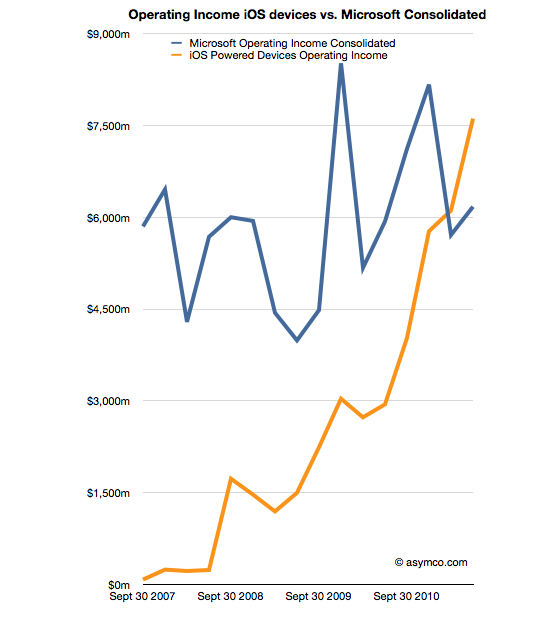
    The same line from the chart above is super-imposed on the chart below and is comparable to the orange line that represents the operating income that Apple was able to obtain over the same time frame. Note that both axes are using the same scale.

    The Blue and Orange lines are indisputable but the allocation of the areas under the orange line may be open to debate.

    As Apple does not report a break-down of each product line or division, getting the areas in the Apple chart is a matter of analysis and estimation. The method I used was to estimate gross margins per product (the overall gross margin is known) and assigning a portion of OPEX (also known) in a ratio equal to the sales level of that product. [3][4]

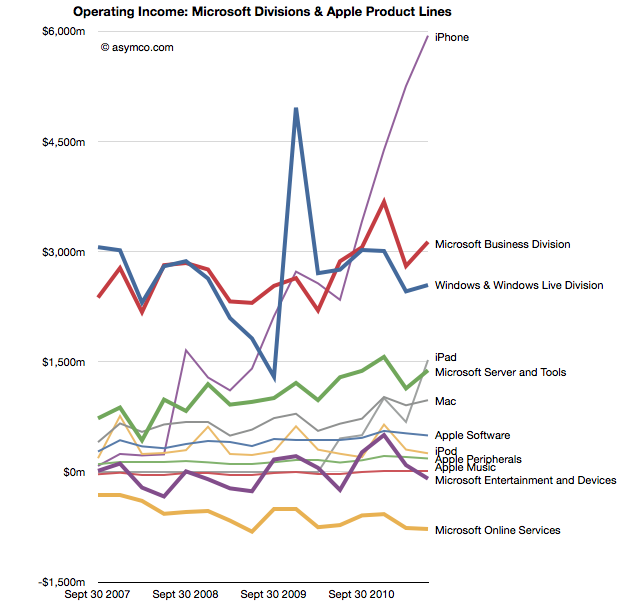
    To make the contrast sharper (though more cluttered), I took all operating incomes from all product lines and divisions of both companies and laid them out as time series line charts in the following chart. I allocated Corporate Level Activity as an expense proportionate to each business unit in a ratio proportional to its sales. This allows comparison of product lines individually.


    Finally, I combined all the iOS product lines (iPhone, iPad and iPod touch est.) as one line and laid it alongside overall Microsoft Operating Income (consolidated).

    The second chart in this post showed that Apple has reached higher operational profitability than Microsoft by the end of last year. This fourth chart shows that iOS products combined are more profitable than Microsoft as a whole.

    Microsoft invented the software business and built it to become the world's most valuable business by the year 2000. It's still been growing since and after 35 years it is reaching a profit of $27 billion per year. It did this while maintaining enormous margins and a highly disruptive monopoly business model the likes of which the world had never seen before.

    It is scarcely believable then that a device business has been created to overtake it in four years.

    ---

    Notes:

    1. The operating income is almost the same as EBIT  which is explained here: Earnings before interest and taxes - Wikipedia, the free encyclopedia.
    2. On the other hand, one should not use Gross Margins alone. The crucial difference between Gross Margin (Sales Revenue - Cost of Goods Sold or COGS) and Operating Income is that fixed costs are also accounted for. These fixed costs are typically Selling, General and Administrative Expenses and Research and Development Expenses (commonly summarized as Operational Expenses or OPEX) which can be allocated to a particular business or division. For different business models, gross margins can be widely different. In the case of Microsoft for example, software has negligible direct variable costs. A CD or download is of tiny cost compared to the price of the license to use it. As a result software often has 80% gross margins. Hardware on the other hand can have very thin margins in single digits (e.g. PCs). Conversely, Microsoft will have very high fixed costs to pay for developers, product management and sales forces. A hardware vendor may have few engineers and sales could be handled through resellers. Thus Microsoft will have very high OPEX and a PC company will have very low OPEX.
    3. So, for example, In Q2 '11 the iPad had an estimated gross margin of $2.06 billion (which assumed 34% margin on published revenues of $6.06bn). As it also was 21% of total revenues that quarter, I assigned 21% of OPEX to the iPad. That means 21% of $2.54bn or $540 million was the operational expense allocated to the iPad. This results in operational income estimate of $1.52bn for the iPad in Q2.
    4. To summarize, the assumptions this estimate depends on are gross margin estimates and the allocation of OPEX in proportion to sales. Gross margin analysis has been a matter of iteration and peer review for some time and I'm fairly confident in my estimates. The allocation of OPEX is more arbitrary. Chances are that these expenses vary greatly with each quarter where more work is done nearer to launch of a new product and less in late season. If there are better methods available to allocate expenses by product, I'm open to suggestion.