MacDirectory: Exclusive | Horace Dediu: Apple expert
"This is my site. It’s an evolving experiment in collaborative and peer reviewed analysis."
"This is my site. It’s an evolving experiment in collaborative and peer reviewed analysis."
In intra-day trading Apple's stock price traded at a P/E ratio below 15. That threshold is now at a price of about $315/share. Excluding cash the P/E is under 12. On a forward basis, there is widespread agreement that Apple has the reward (yield) profile of a bond without the risk of inflation.
The history of the P/E ratio and the share price is shown in the following chart:
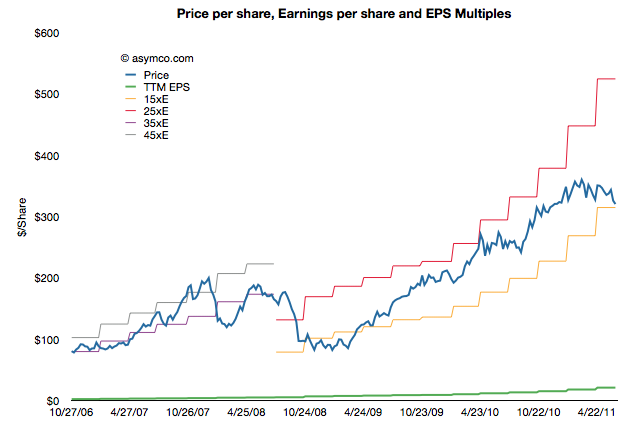
As the chart shows, Apple traded in a range of P/E between 35 and 45 until late 2008 and has been trading between a range of 15 and 25 since about spring 2009. It might seem that the price is rewarding growth, but it's not.
When adjusting for the growth the company has maintained, the company is at a similar P/E/tG (Price/Earnings/trailing Growth) to the depths of the recession.
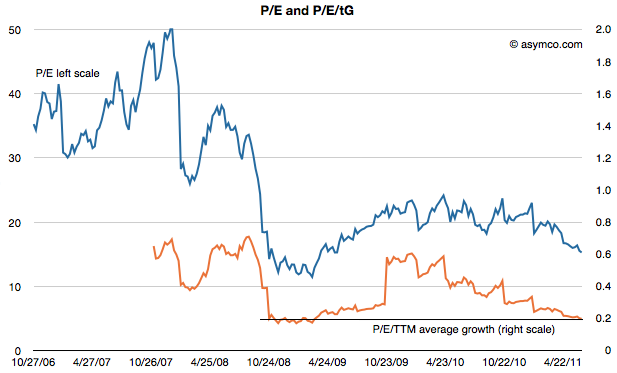
At the trough shown above, the company was growing earnings at high 30% rates and sales in the teens. Today the company is growing earnings at 92% and sales at 83%. the following chart shows P/E ratio vs. growth.
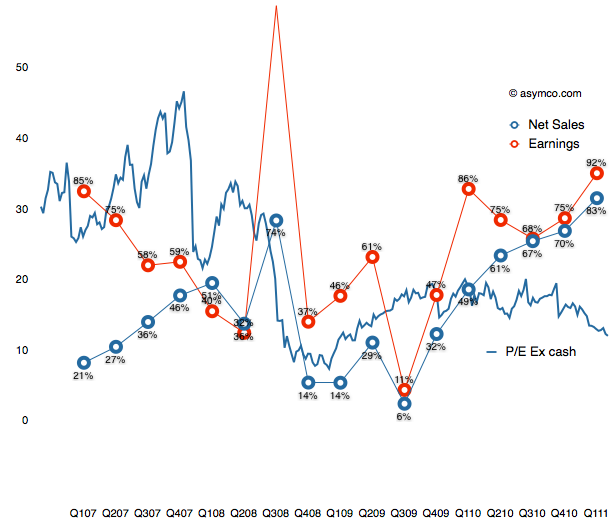
From a historic perspective, Apple is as cheap as it was at the bottom of the recession. At the time there were many reasons given for why the company would suffer 'headwinds'. Most commonly cited was that the company was a maker of "luxury" products and luxury does not sell in a recession.
Today reasons being given for why the company will not prosper are far more nuanced. I won't re-iterate them but they deal with competition, platform issues, production issues, sympathy with companies that are failing, and saturation of markets.
The trouble is that these arguments are easier to refute than the luxury vs. economy argument. Exactly because the arguments are more precise, there is data that can be used to counter pessimism.
And yet, with or without data, markets sometimes decide that profits are not reliable indicators of value created or potential for value creation.
Research #Industry · 75 comments
The second quarter ends in less than two weeks. When it does, I expect Apple will have over $70 billion in Cash, Cash Equivalents, Short-term marketable securities and long-term Marketable Securities. That figure has been growing predictably.
Also predictable has been the decline in value of Apple's mobile phone competitors. Most spectacularly Nokia and RIM. The enterprise values of the public companies selling 75% of all phones sold world-wide are as follows:
The values of the profitable phone-making subsidiaries are a bit more difficult to estimate but we can use multiples of trailing operating profits. I generously use the multiple applied to HTC (14).
That leaves valuing LG's phone business which has not been profitable in the last four quarters. I assume a nominal value of $10b. These data points are shown in the following chart:
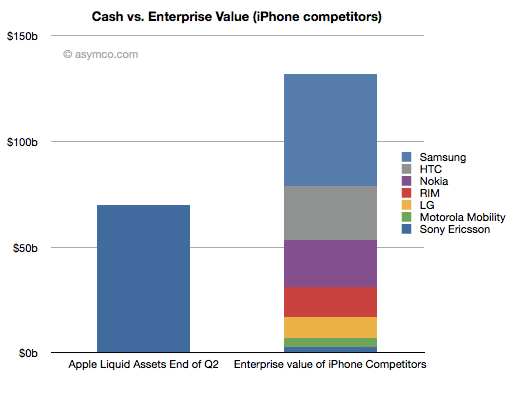
Given the current valuations, it would not be difficult for Apple to acquire every phone vendor except for Samsung with cash alone.
The more remarkable thing is that as market values of phone vendors continue to decline, Apple's cash will continue to grow dramatically. Indeed, a time may soon come when Apple's cash will be worth more than the entire phone industry.
Research #Market · 25 comments
By my estimate, Apple has paid out $16.6 billion to content owners. $2.5 billion to app developers and about $14 billion to music companies. The developer payments are published by Apple, the music payments are estimated based on total downloads and guesses about the split and pricing of that content (90% for the content and $1 to $1.2 average pricing over time.) There might be reason to move the music figure up or down but the difference will still be nearly a factor of 5.
The cumulative payments are shown in the following chart:
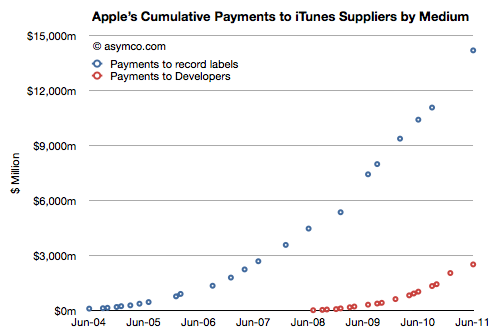
From this perspective, the music business is still a far bigger ecosystem than apps. However that's cumulative data and digital music has been around far longer. The story can be told a different way: What's the rate of sale in the present period? From what we know about the business, we can see what Apple takes in for apps and music (I've already estimated what Apple "keeps" after paying content owners)
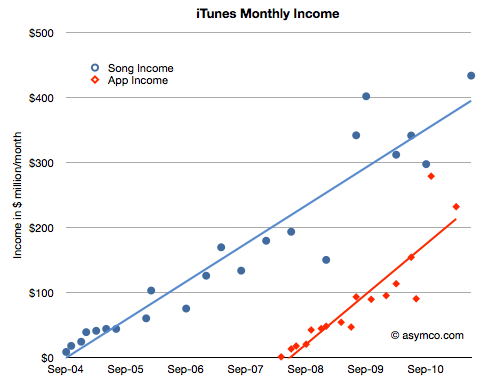
The combined "sales rate" is a remarkable $665 million per month, but the split now is that music generates only twice the income of apps (i.e. cumulative is a factor of 5 but on a monthly basis the factor is 2). But what should be more impressive is how quickly the app business is ramping. By the slope of the trend lines, it would appear that app income will exceed music income within three years. Therefore, it's only a matter of time before apps generate as much income (exclusive of advertising) as music.
Another perspective is the number of downloads per device per month. This shows that the rate of consumption of apps is increasing and is now about 6 apps per device per month.
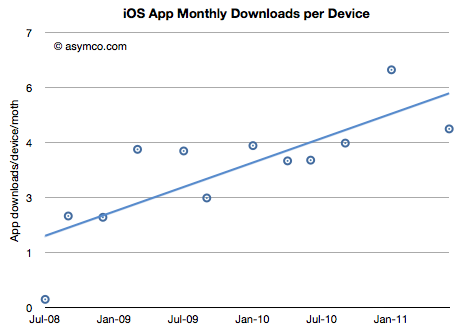
(You have to think of apps not as traditional computer applications or console games where each device has a certain number of expected apps attached, but rather that apps are more like a subscription where there is recurring monthly income).
I don't have a comparable figure for music because the number of iPods and Macs as target devices is hard to estimate, but I doubt consumption for music on a per device basis is increasing. As a consolation, I can estimate the number of apps or songs per iTunes account. Here the story is consistent.
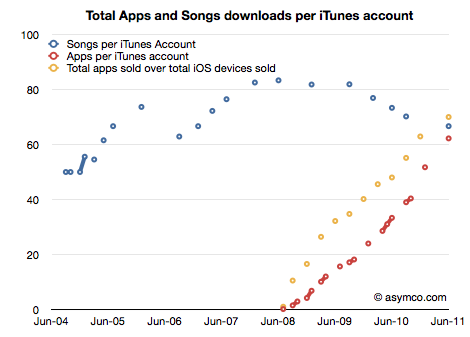
Each iTunes account has "consumed" about 67 songs but also 62 apps. Remarkable parity in such a short time. And the trend speaks for itself.
All this data points again to the ascendancy of apps as a new medium. In a mere three years these digital objects have redefined themselves. They went from being tools to enhance the use of your phone to a new medium of expression and art. They have the ability to create a powerful economy of their own and will likely lead a profound shift in where value resides in mobile computing.
Research #Industry · 93 comments
The iPhone is now available in the US unlocked. Judging by the lack of reaction to the news, one would assume that this is not a significant event. I would argue however that it's a very significant event.
What is unappreciated is that the iPhone is a very restricted product. Unlike any of Apple's other products (iPod, Mac and iPad), the iPhone is designed to be hard to get. Apple did not make it easy in the one dimension of ease that matters most: its purchase.
Consider that many people in the world cannot buy an iPhone because it's not available locally. In case it is, in most cases you need to sign a contract and commit to a long-term relationship with a company other than Apple. In those cases where you don't sign a contract, you cannot use it with a service provider other than the one (arbitrarily) chosen for you.
A few have been able to buy iPhones unlocked if they lived in a few countries (UK, France, Australia, Belgium, Hong Kong[1]) but those phones could only be purchased online if sent to a local address or in an Apple retail store--of which there are not many.
Consider that in Europe alone, the following countries do not have iPhone distribution: Albania, Armenia, Azerbaijan, Belarus, Bosnia, Georgia, Iceland, Kazakhstan, Serbia and Ukraine. The populations total over 100 million people. In Asia the number of countries without iPhone distribution outnumber those with distribution. Add in Africa, Latin America and the Middle East and the unaddressed market begins to look very large.
If you contrast this with every other phone platform out there, Blackberry, Android or Symbian, the iPhone is extremely restricted and the number of people that are permitted to buy it much more limited. The number of operators supporting Blackberry outnumber the iPhone at least by a ratio of two to one.
Then there is the matter of distributors. This is a channel that iPhone does not leverage. Distributors account for more than half of Nokia's volumes. They buy in bulk and resell (sometimes illegally or in violation of contracts) vast quantities of phones.
By offering unlocked iPhones in the US, the restriction on distribution is lifted to a large degree. What's different is that these phones can be purchased in 200+ retail locations. Many of these locations are in tourist hubs where there are large diaspora communities rotating continuously back to home countries. iPhones can now be purchased with cash and become as good as cash.
And this is not a new phenomenon. When the original iPhone was available, Apple had to restrict buyers to 5 per person and stopped accepting cash because of the huge grey market demand. The same thing happened with the original iPad and with iPad 2 lines are still forming for it because distribution is so restricted. Consider also that sales in Verizon stores pale in comparison with those for GSM products.
The way to think about it is that the iPhone has just become more "liquid" and it can now flow to parts of the world where it has been difficult to acquire. The iPhone was already liquid to some degree with unlocking and sales through Hong Kong/UK, but the US market's retail footprint and the lower costs that result will boost liquidity dramatically and probably increase volumes substantially.
---
Note:
Research #Market · 82 comments
The iTunes store continues to grow. The data that Apple published in the last event included the following:
As this data is added to the existing data and cross-referenced additional insight into the economics of iTunes is emerging.
Since we know something about the average price of songs and apps, and we know the split between developers and Apple (and roughly between music labels and Apple) we can get a rough estimate of the amount Apple retains to run its store.
The following chart shows iTunes "content margin" by month. This margin is what Apple "keeps" after paying content owners but before paying for other costs like payment processing and delivery/fulfillment which should be accounted as variable costs. Strictly speaking this margin is not "gross margin".
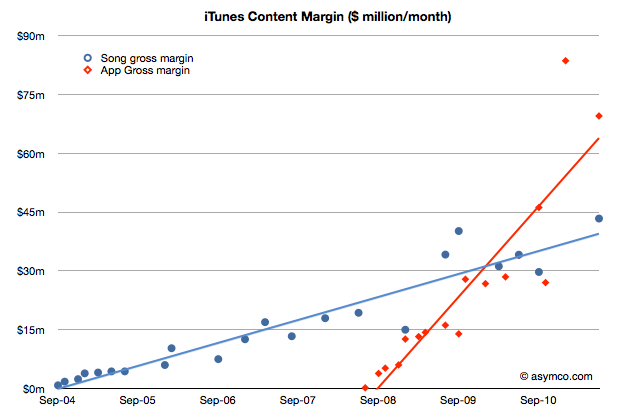
If we add the content margins from music and apps and assume the store runs at break even we can get an idea of what it costs to operate the store. The latest number is $113 million per month (from a total income of $313 million/mo.). It implies over $1.3 billion per year.
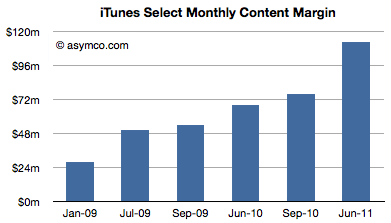
Much of that cost does go into serving the content (traffic and payment processing). Some of it goes to curation and support. But it's very likely that there is much left over to be invested in capacity increases.
I would like to hear alternative opinions, but my guess is that much of the capex that went into the new data centers Apple built came from the iTunes operating margin.
Research #Market · 37 comments
There are 225 million iTunes account holders. 25 million joined in the three months. As the iTunes store has been operating since April 2003 it's possible to step back and look at its history and measure the rate of growth relative to other ecosystems.
The following chart shows various platforms/ecosystems in terms of adoption. In the case of phone operating systems and consoles, the cumulative units sold is shown. The scale is 10 years by 1 billion users with users measured on a logarithmic scale.
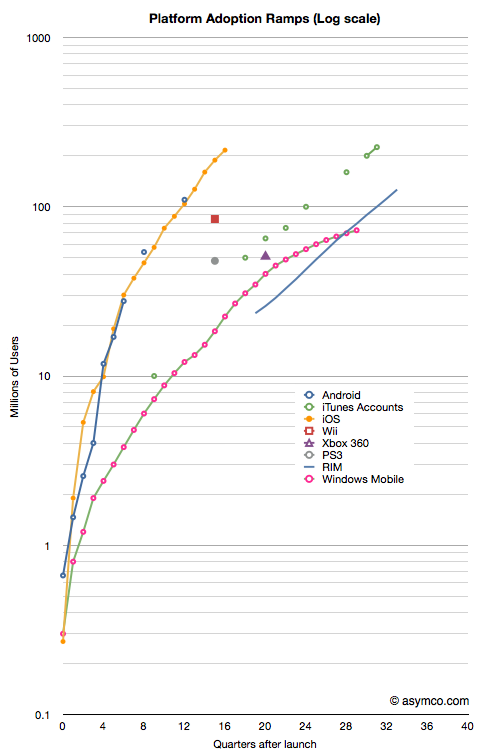
What can be easily observed is that iTunes continues to grow on a logarithmic scale even at its advanced age of 7 years. This cannot be said for console-based gaming systems or for some alternative mobile phone platforms (e.g. Windows Mobile or Symbian).
The reason for this prosperity at an advanced age may be due to the fact that iTunes has survived the transition from one device (the iPod) to a device platform (iOS). It also was able to embrace multiple media from music, to movies to TV and apps. iTunes turned out to be far more flexible and resilient given what was technologically foreseeable at its birth.
Looking to the future, is it possible that iTunes could grow in parallel with iOS toward the 1 billion user limit that the slope in the chart implies? Much will depend on gaining users who are unlikely to have credit cards and live in emerging markets. If there is one obstacle to the iEmpire it's the addressability of markets which lack consumer credit infrastructure. I suspect, however, that these problems are not unsurmountable given that telecom infrastructure leapfrogged credit infrastructure growth with nary a ripple. Apple could certainly offer that service directly to the consumer.
Research #Industry · 29 comments
According to 148apps.biz, the App Store has seen over half a million apps since inception. The number of available apps, according to Apple, is now 425k. (148apps claims 402k apps available in the US store.) The history of the App store catalog is shown in the following chart (showing both US and World-wide measures).
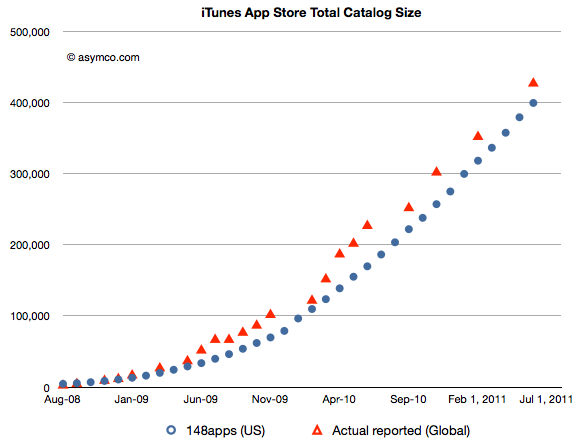
In an interesting new post by Appsfire, APPtrition - or why app store size does not matter that much... Ouriel Ohayon makes a good point: available is very different than accepted. When comparing catalogs it's important to distinguish between these measures. Apps are published and then unpublished for various reasons. He calls this app attrition and details the reasons it might happen.
What makes this interesting is the contrast between attrition rates on Android's Market and those on Apple's App Store. About 80k (or 16%) of Apple's catalog has been removed while nearly a third of Android apps have disappeared from the catalog. (By another measure, the submission total is tracked here and shows nearly 375k apps while Ouriel points out that there are 206k available. An apparent attrition rate of 45%.)
We can compare how the two marketplaces are adding apps here:
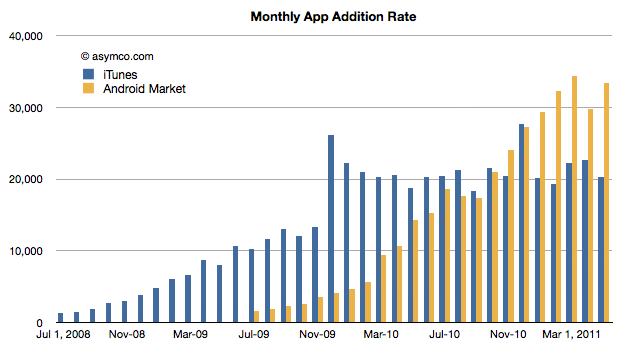
(The iTunes data is US only)
This data would indicate that the iTunes App Store has plateaued at about 20k apps per month while Android is still growing and adding at about 30k per month. The challenge for an observer is to reconcile the growth in Android submissions with the apparently far higher attrition rate.
In other words, Android developers and producers seem to be more prolific but less persistent. With few if any constraints on submission it's understandable that there will be more apps thrown into the catalog. But why would they be so rapidly removed remains a mystery. Maybe economics, maybe policing, maybe something else altogether explains this.
Research #Market · 30 comments
The 200+ million iOS devices have caused 14 billion apps to be downloaded in less than three years. The iTunes music store caused 15 billion songs to be downloaded over a 7 year period.
The two media download totals are shown in the following chart:
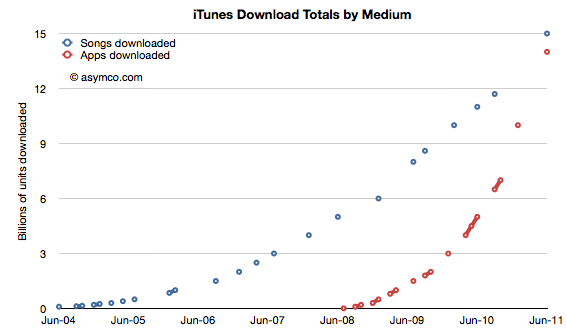
About 9 months ago I predicted that Apps would overtake song downloads. I was off on the timing by a few months. The app download rate slowed down in the last few months. However, the crossover point is imminent. The song download rate is running at about 12 million per day while the app download rate is at about 30 million per day (the iBook download rate is still growing but is only at half a million per day). The following chart shows the three media types and their download rates over time.
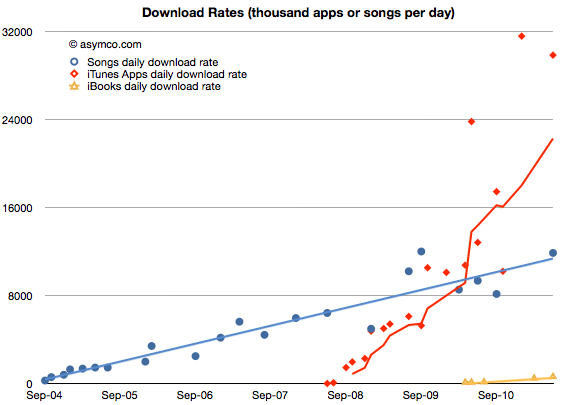
Although it took about 35 months for Apps to reach 14 billion downloads, the equivalent time for the Songs was about 80 months. You can see the different "ramp rates" (cumulative totals indexed to the same starting date) for the three media on the following chart.
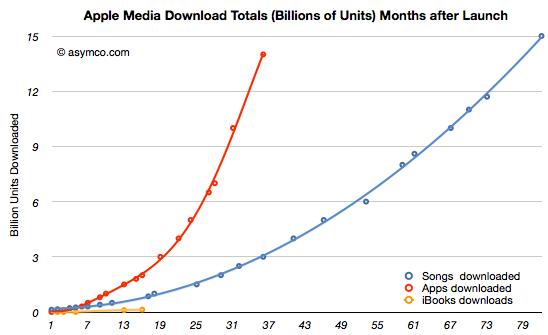
Given the large numbers involved, a better view might be had looking at a log scale chart of the same data:
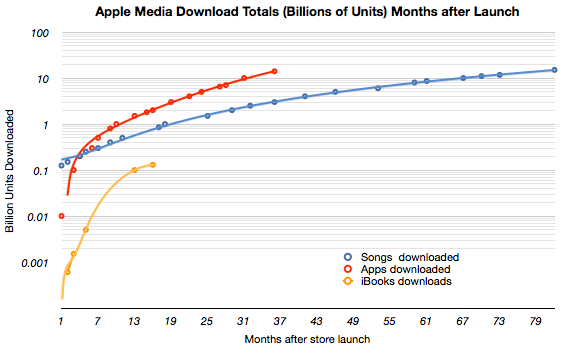
What I would point out is the emerging pattern that the three media ramps are separated by about an order of magnitude. In other words songs are 10x more downloaded than books (at a given point in the life of the media store) while apps are 10x more downloaded than songs. You would see this pattern emerge within the log chart as the three lines run parallel and equidistant.
Obviously, apps are going to be more popular than songs since many are free. And obviously songs are going to be more popular than books because many are much cheaper.
But painting this picture with price is only a rough sketch. The ways that these media are consumed (and consumable) fills in the details. The amount of energy needed to enjoy each varies greatly. The "digestibility" of the material is different. In a way, these are the same factors which are drawing consumption toward tweeting, blogging and browsing and away from paper based media.
The new technologies are allowing consumption to conform more closely to people's lives. They are like clothes that fit a bit better and are more comfortable. They may not look as good as formal attire, but in the end casual always wins.
Research #Industry · 37 comments
In their monthly survey update on US phone usage, comScore reported that by the end of April 74.6 million people in the U.S. owned smartphones. In the same period a year ago only 48.1 million did. The percent of smartphone users out of total phone users has reached 32%.
The following data points can also be deduced:
The following chart shows the evolution of installed base share of platforms among users of smartphones in the US.
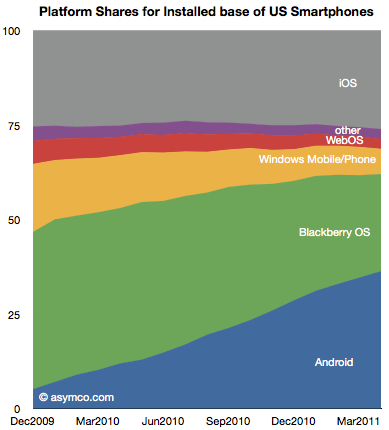
The impressive share gains for Android are apparently at the expense of RIM and Microsoft. Over the period shown, Android gained 25 million users while RIM gained only about 2.8 million.
Although perhaps comforting to see some growth overall, the situation for RIM is more grim than that. During the first half of the period (December 2009 to August 2010) RIM had gained 4.6 million users. During the second half (Sept 2010 to April 2011) RIM lost 1.8 million users.
The net user gains and losses for the various platforms is shown in the following chart:
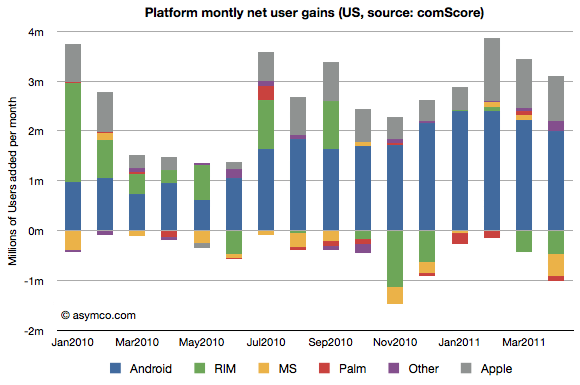
Note how RIM (green bars) went from being a consistent net usage gainer to a consistent net usage loser during this 16 month period. In addition, note how Microsoft's platforms (yellow bars) have had a very poor showing with very small gains during four months and moderate losses during the others. The losses in usage even increased after the release of Windows Phone late last year suggesting no traction whatsoever for Windows Phone.
The other point to be made is that if we assume smartphone users remain smartphone users, then those platform losses are gains by other platforms. In other words, the areas less than zero in the chart above represent smartphone "churn" or switching between platforms (As a percent of all smartphone users that number represents 1.35%.) That number is far lower than the total smartphone gains, so it's safe to say that most of the iOS and Android gains were at the expense of feature phones rather than other smartphones. And since iOS share is consistent (and supplies are constrained), few if any Android gains are at the expense of iOS.
There are many interesting patterns to observe in the data, but I think the most evocative is the erosion of Blackberry usage. If the Blackberry peaked, and a follower platform not yet in sight, the question is how long will RIM survive?