Asymco

Asymmetric Intelligence

Latest from Asymco

  1. An interview with Kenney Ho of The Chosun Daily of Korea

    Research · 20 comments

    Kenney Ho, a staff reporter from Korean newspaper The Chosunilbo (The Chosun Daily) sent me a set of delightful questions.

    According to Kenney, The Chosunilbo "has a history of 90 years, has been the most dominant, and influential paper of all time in Korea. It is the No.1 newspaper company in Korea with more than 1.8 million circulation, firmly holding the largest market possession. The paper is recognized Asianwide, where there are many readers in Japan and China."

    -You said "All mobile device vendors experiencing losses are not likely to really recover". Even though, it wouldn't mean that the employees, executives of Nokia has completely nothing in hands for recovery. If you are the CEO of Nokia right now, What are your steps to make Nokia recover its deficits?

    My statement was based on the historic data which shows that 14 phone vendors have either exited the business or lost their independence during the last decade. No vendor that has reached a period of prolonged loss making has recovered. These are just observations and it's possible that Nokia may be the first to recover. However, going by the patterns of the past, it would be very unlikely. When I thought about the reasons why companies have not been able to recover I came to the second observation about the way phones are sold. Once a brand reaches a point where it's considered "risky" for distributors and operators to range they tend to defer purchases which leads to a spiral of continuing losses and more damage to the brand. The market amplifies "distress" and recovery becomes impossible.

    If I were the CEO of Nokia I would set course for turning the company into a new business. I would approach the market asymmetrically and not try to compete directly with the other vendors. I would look toward services, platforms and software solutions and de-emphasize hardware.

    -Many experts say that because Nokia dominated phone making industry in the 2000s, they maintained a corporate culture of complacency, which led them to decline. Do you agree with this? If you agree, Can you point out the examples of Nokia's complacency?

    Complacency would mean that Nokia would not invest or try new things. This is not quite right. The company invested in software, services and platforms. It tried many new things and had a large R&D budget. It was the leader in mobile software for many years. There was, however, a culture of arrogance about their position. This meant that they did not think the basis of competition would change. They thought they were too big to fail. They did not challenge the core business model of hardware-first and try to find an internal disruptive business.

    -Experts note that Nokia should have reacted directly to Apple's iPhone appearance at 2007. What should have Nokia have done at that time?

    The iPhone showed that software and experiences matter more than operator relationships. Nokia did a lot of research on user experiences and software but when the decision came to implement the ideas, the constraints of hardware and logistics and operator preferences took precedence and the software was compromised. What Nokia needed to do is build product around software not software around the hardware and the market.

    -Since Apple's iPhone appeared in 2007, Samsung took a Fast-follower tactics which made them successful, which Nokia could not. Do you think Fast-follower have advantage over first-mover?

    I don't consider first-mover or fast-follower to be accurate descriptions of strategy. Success follows from innovation and only from innovation. There are various forms of innovation: there is new market creation, new business models, low cost or distribution innovation. Nokia tended to create low cost innovations which opened new, low-end markets. Apple created a new market for browser-based devices and for app-based experiences. These were enabled by an ecosystem that benefited from integration.

    Samsung implemented a portfolio strategy with a large number of devices and price points which allowed them to find market niches that could be exploited. This was a distribution innovation. Each strategy has advantages and disadvantages and each strategy is usually linked to company core priorities and processes. There are times during a technology cycle when one strategy is better and another is worse. This is why companies find themselves successful and then fail. Their processes don't match the technology adoption cycle.

    For example, in the PC market there is little potential for new experiences tied to an integrated device (except for tablets) and hence there is little growth opportunity for an Apple-like approach. The innovation that matters in the PC market is mostly cost reduction. Nokia was doing cost reduction at a time when voice products were commoditizing. Cost reduction does not work when the basis of competition is new experiences and new business models. As smartphone hardware commoditizes, it's unlikely that Samsung will have an advantage unless is goes to a low-cost approach and enters into direct competition with low-end devices.

    -Can you predict the 'Big 5' in handset industry 10years from now? Many people think the list will include Apple, Samsung. Who else might be on the lists?

    There is no guarantee that Apple or Samsung will be the top vendors 10 years from now. I expect Chinese brands to become dominant in market volumes. I expect online service companies like Amazon, Baidu, Facebook to create new platforms which and have their own devices, perhaps in large volumes. I expect new input methods (like voice) to create new opportunities and perhaps new platforms and ecosystems. I expect Google may make a lot of money. One thing is for sure, being a hardware-oriented company without software and services and platforms and ecosystems is a sure path to becoming disrupted.

    -Nokia was the leading company in Finland. What are the reactions of Finland towards Nokia's downfall?

    People tend to blame each other for failures and this is the main discussion topic in Finland: who's to blame. The failure of a company is rooted in complex decision processes which usually take years to run their course. It's quite futile to lay blame on persons, especially since the same persons were celebrated for their wisdom at another point of time. At the same time as Nokia is failing however, another Finnish startup is celebrated world-wide and about to go public: Rovio, the maker of Angry Birds. It will be bigger than Nokia. Finland should make sure there are more Rovios to come.
  2. Calculating Google's contribution to iPhone profitability

    Research · 16 comments

    In the iPhone cost structure analysis I showed how revenues and costs for iPhone are probably allocated. The revenue per iPhone was shown to include $29 for revenue items "above" the price of the phone to the channel. This total includes Apple's own iPhone accessory sales plus revenue from licensing the "Made for iPhone" trademark to third party accessory makers. Apple also receives some revenues from cloud services. But, pertinent to our recent discussions on the Android business model, Apple also receives revenues from Google.

    Wouldn't it be nice to know how much? Here's a way we can estimate it.

    I've read an estimate that 50% to 60% of ad revenues from Google search initiated via iOS are paid to Apple. This is believable because the TAC for Google overall is about 40% and Apple probably drove a hard bargain to get a premium for its, presumably, premium traffic.

    So if we knew the revenue run rate for Android search on a per device basis we could perhaps guess how much of each phone's revenue comes from Google. What we've heard last year in Congressional testimony is that two thirds of its mobile revenues come from iOS devices. This would imply that the run rate for iOS would be 2x the run rate for Android.

    Having a model of Android revenues helps at this point. Assuming Google obtains $4.4 from Android (excluding AdMob and App sales) and assuming negligible other mobile revenues from other platforms gives a possible Google revenue per iOS device per year of nearly $9.

    Taking the lower bound of the revenue share estimate above means that half of Google's revenue goes to Apple or $4.4/iOS device/year or $9 over the two year life of the device.

    That would put revenue from Google at about 1.4% of iPhone revenues (see average revenue per iPhone here). And that revenue comes without any costs and so flows straight to the bottom line. That, in turn, would imply that 3% of Apple's operating margin is provided by Google. Not a bad deal considering that some phone vendors can't get that for their entire product line.

    The interesting factors at work here are that this contribution by Google to Apple is higher than the contribution by Android to Google. In yesterday's post, I calculated that in 2011 Android contributed about $590 million to Google's operating margin (5% of total).

    If we consider that Google pays Apple $9[1] for every iOS device and since Apple sold 156 million iOS devices in 2011 then Apple received $1.4 billion from Google, all of which went to the bottom line.

    $1.4 billion from Google to Apple vs. $600 million from Android to Google. Three percent contribution of Google to iPhone profits vs. 5% contribution of Android to Google's profits.

    This sets up all kinds of game theorizing which will undoubtedly entertain and enrich us all.

    ---

    Notes:

    1. Perhaps this $9 value is not valid for all devices. Perhaps iPod touch does not get a lot of traffic and is less valuable. Perhaps iPads get more traffic and are worth more. On average, this may be plausible.
  3. Android's contribution to Google

    Research · 41 comments

    Yesterday I presented the estimated Android income statement vis-à-vis Apple's income statement. In this post I'll compare Android as a part of Google's overall business.

    Recall that Google has already been compared in terms of overall revenue, growth and profitability to Apple and Microsoft here.  The argument can be made that mobility has not yet had a measurable impact on Google (certainly not noteworthy enough to be reported by management).

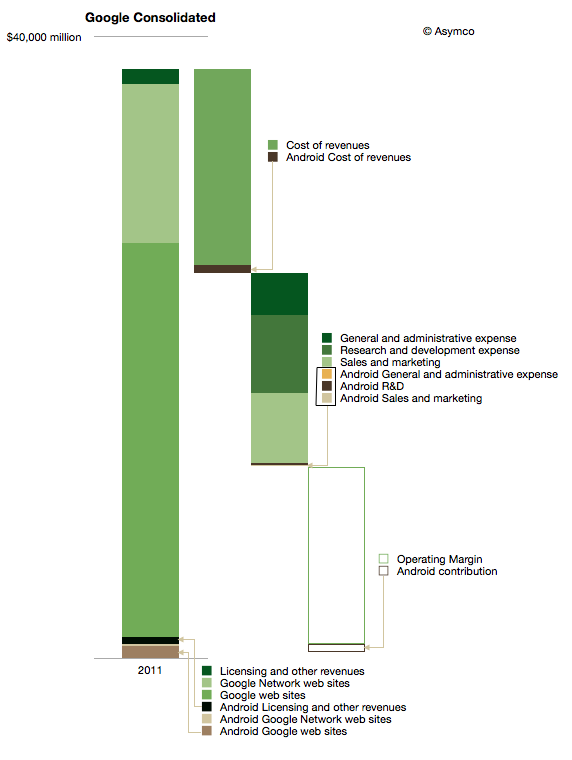
    The impact on Google of Android can be shown in the following diagram:

    I used color coding to identify non-Android (Green) and Android (Brown) segments of the business. Overall, Android could amount to about 3.5% of total Google revenues and about 5% of operating earnings.

    It's important to note that this is not all the revenue that Google obtains from mobility. This diagram represents Android only and there are revenues also coming from alternative platforms and operator deals.

    iOS contributes between 3 and 5 times more ad revenue to Google than Android.[1] The contribution to earnings is even more difficult to assess. We don't know the terms between Google and Apple for search revenue sharing and placement. One analyst suggests that the cost of sales (TAC) for mobile Safari search could be as high as 60%, far above what Android traffic costs.

    The other observation is that Android cost structure is quite small (see third bar from the left above.) My estimate is that Android R&D is only about 3% of total Google R&D. I'm projecting $200 million for 2012. That implies between 700 and 900 headcount. It's interesting to compare that total to the 20,000 or more that came with the Motorola acquisition.

    Having these estimates allows one to calculate many ratios and potential valuations. I'll refrain from putting a value on Android using multiples or sales or earnings, but would come out well below what was paid for Motorola's $12.5 billion.

    Which again compels one to ask what is the strategy at work here.

    ---

    Notes:

    1. There are various reports of the ratio including congressional testimony and reports to courts. BlackBerry, Docomo and KDDI were listed as significant other sources of ad revenue by Google in 2010.
  4. The Critical Path: The First Year » What I've learned so far on Kickstarter

    Podcast · 8 comments

    One week into this project and the response has been phenomenal. We are at nearly 500% funded. There are 414 backers so far and the average pledge is nearly $34. This means that the vast majority of people (328 so far) opted for the $35 pledge. Many pledged even more than $35.

    Perhaps it's only symbolic but the interest in the hard copy version was something I did not expect. It's gratifying that people would prefer to have a physical representation of the work. It also means that I have to think carefully about the production of a good quality paper book.

    The abundance of support allows me to invest in design, editing and perhaps illustration as well as the text. I will also have to do a lot of signing.

    Thanks again to all who have contributed. I'm completely humbled by the level of support and can only promise to keep doing that which has been so resolutely defended by you all.

    via The Critical Path: The First Year by Horace Dediu » What I've learned so far — Kickstarter.

  5. Android Revenues in Perspective

    Research · 87 comments

    Data is useful only when put in perspective. Yesterday's post on the Android Income Statement showed how sales and revenues are captured and how costs are paid for that revenue. The data was shown for the entire calendar year 2011 and the maximum value in the vertical axis was $1.5 billion.

    Google has also reported that their revenue "run rate" is now in excess of $2.5 billion so there is significant growth, as would be expected from an exponentially increasing user base.

    However, it's important to place this growth in perspective, both in absolute and in relative terms.

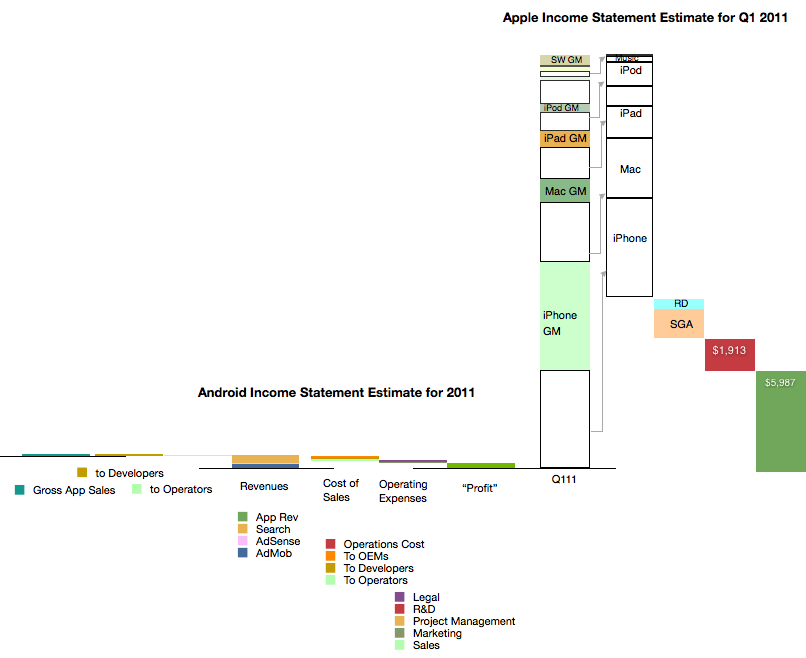
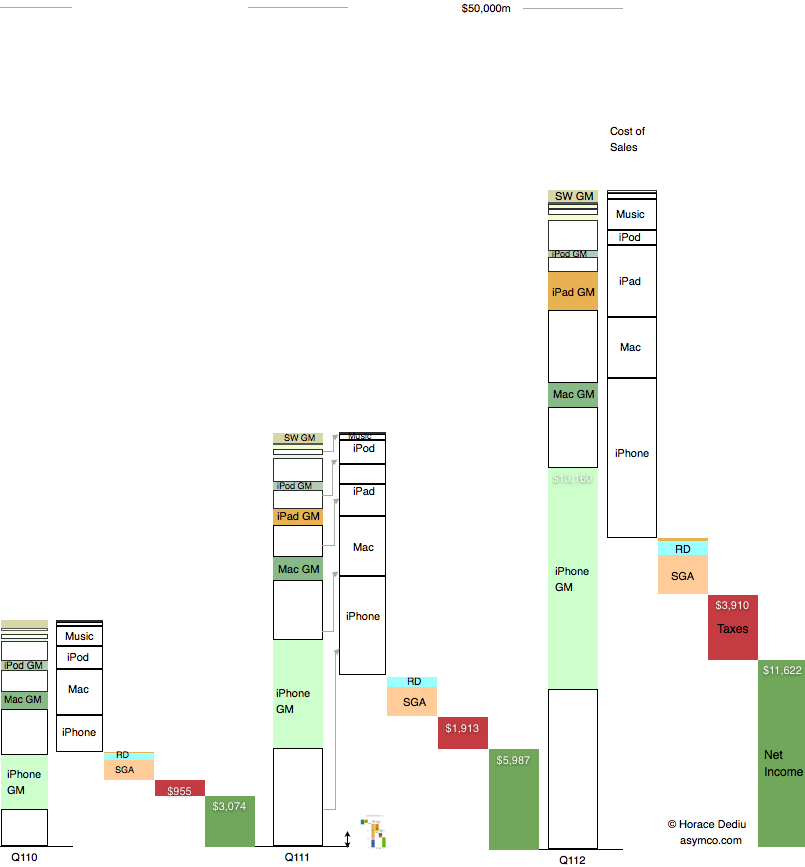
    Below is a diagram showing Apple's revenues for the first calendar quarters of 2010, 2011 and 2012. Each product group (iPhone, Mac, iPad and iPod) is shown separately with estimated gross margins (GM). Operational costs, taxes and net income are also shown.

    Consistent with previous versions of this data are the color schemes where white areas represent costs of goods sold.

    I also placed a scaled version of the Android Income statement next to the first quarter 2011 revenue bar for Apple. The scale is maintained where $1 billion is represented by the double-ended arrow line.[1]

    It might be hard to see the Android section of the chart so I expanded it below at 400% the original:

    It is still difficult to resolve the data at this resolution but the picture should become clear nevertheless. Keep in mind that the iPhone data is for one quarter while the Android data is for one year. Comparing revenue "run rates", on a yearly basis Android is 2.5% of iPhone or 1.6% of iOS.

    As various members of the Android ecosystem are rewarded from the 40% revenue share of Android, it would be important to consider the scales involved in these illustrations when considering the influence Google exerts. It could be argued that Google's spreading of wealth from search creates strong incentives for participation in its ecosystem.

    However, there is little wealth created. 40% of a little is a lot less.

    ---

    Note:

    1. The scaling of the image in both X and Y dimensions can be deceptive. I provide the following view where only the vertical dimension (value) is reduced for Android
    1. :


  6. The Android Income Statement

    Research · 38 comments

    This is a continuation of the "Android Economics" series of posts. It deals with how revenues and costs are categorized for Android.

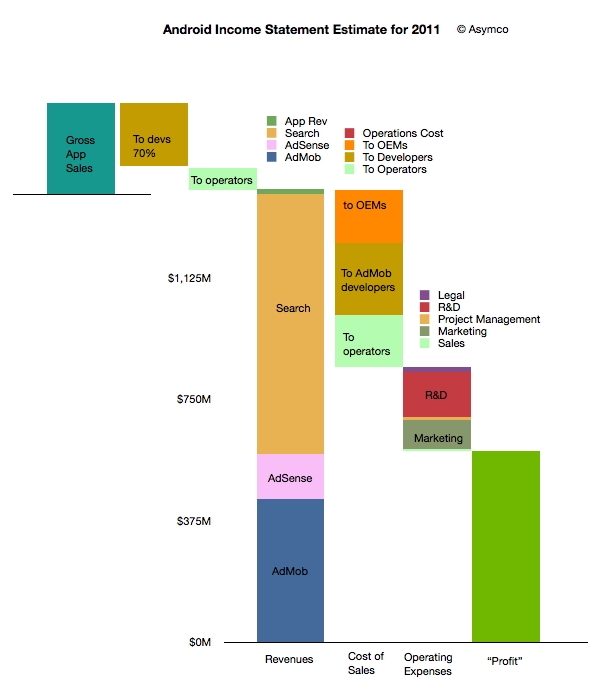
    The following diagram shows an approximate representation of what Android's "Income Statement"[1] would look like.


    I'll discuss the assumptions that are built into the model as I go along. I'll begin at the upper left and move toward the lower right in the discussion.

    The first thing to note is that sales from Google's (formerly known as Android Marketplace) Play are not registered as revenues. This is because Google, like Apple, treats itself as an agent. Agency means that the revenues don't "belong" to the agent but get passed on through to the primary beneficiaries. In the case of Play, Google passes 70% to developers (or content owners) and then distributes on average 25% to network operators (or carriers).

    I emphasize on average because there are many cases where Play transactions are not handled by or don't pass through operator billing systems. In those cases where operators are involved, it's possible that they capture more than 25%. It's not uncommon for operator billing to capture 45% of a transaction's value. The reason for this is that there is significant collection risk on billing--far more risk than on credit cards. It would also imply that on some transactions Google may be paying out more than it receives.

    This means that on average about 5% of Play content sales to be booked as revenues for Android.

    This 5% ends up a quite a small amount if overall app sales are small. We don't know the exact amount but anecdotal evidence from developers seems to indicate that they receive far more revenues from ad sales than from direct app income. Hence the size of the Android app sales is overall, modest. My estimate is that in 2011 there were about $330 million in gross app sales through the Android market. (Google estimated its sales to be 76 million for 2010 half way through that year.)

    The bulk of revenues are therefore from other sources: Search, AdSense and AdMob. I'm modeling that overall revenues are based on a "revenue per device in use" multiplied by the number of devices in use. Google has publicly stated that they are targeting $10/device/yr. in revenues. This is probably ambitious as the amount was nearly that much in early 2010 but the number of devices bought by emerging market consumers exploded. As they are not actively targeted by Google's primary customers (especially in China), the average revenue per phone is likely to be much lower. I estimated $6.5 on average for 2011.

    However, even if we use $6.5 per phone per year, the total revenues are quite strong since there were likely more than 215 million users at year end[2]. That results in a total revenue base of $1.4 billion for 2011. Removing the app revenues results in about $1.38 billion from Search and AdSense and AdMob.

    How to allocate revenues to these three businesses is mostly guesswork. I used a split of about one third to AdMob, 10% to AdSense and the rest to Search. If we assume this split then the next step is to consider how to allocate costs to these sources of revenue.

    As discussed in the introduction to this series, the primary costs of sales for Search and AdSense are network operators and OEMs or phone vendors. They are the primary "channel" which ensure the flow of search terms to Google. As Google also explains, the channel receives revenue share--so-called traffic acquisition costs (TAC).

    I used an overall allocation of 39% for TAC. Crucially, this includes the payments to developers for AdMob traffic. The rule of thumb I used was:

    • Network operators get 20% of Search
    • Developers get 50% of AdMob
    • OEMs get the rest (of the TAC)

    The resulting split is shown in the column above with the "Cost of Sales" at the bottom. There are also additional operations costs which are negligible.

    After this 39% TAC (revenue sharing), Google needs to pay its operating expenses. This includes R&D, Marketing, Sales and Legal costs for the Android division (including AdMob). You can see the approximate values in the column labeled "Operating Expenses". This operating cost amounts to about 27% of sales, with R&D at 14% and Marketing at 9%. These rather high fixed costs make sense as there is a significant development work underway for Android.

    Finally, after these costs are allocated, the remainder is the contribution of the division. This comes to about 34% of revenues which is called the operating margin. Google has to attach depreciation from data centers and other costs as well as taxes before placing this into earnings.

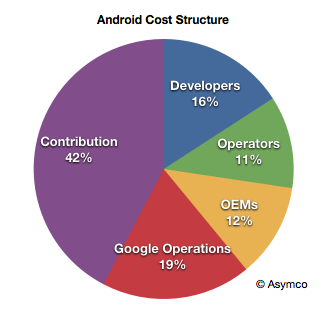
    Considering the agency structure, the overall cost structure of Android looks like this:

    When playing with the assumptions, it becomes clear that the model is most sensitive to the revenue per device and total devices in use. The profitability is entirely dependent on those figures as variable costs are a percent of sales and fixed costs are limited by talent constraints.

    For example, if revenues per device drop to $4.5/yr then the operating margin drops to 38%.

    Now we can calculate some of the more interesting figures. For example:

    • Android OEMs receive $0.76 on average per device per year
    • Android Operators receive $1.07 on average per device per year (including Play)
    • Android Developers, as a group, receive $1.94 per device per year (including Play and AdMob)
    • Google receives a contribution of $2.75 per device per year from Android

    Again, these figures are very sensitive to the revenue per device (currently assumed to be $6.5).

    Because of the number of devices involved, these cash flows are an important part of the value network of mobile computing. The next step will be to assess how they affect the incentives, alignments and competitive stance of various platforms vying for a seat at the table of the future of information.

    --

    Notes:

    1. An income statement shows the sources of revenues and the costs associated with those revenues. It also shows the fixed costs (or costs which are independent of revenues so they don't go up or down if revenues change). Finally it shows the operating income which is called contribution if it's a division within a company. This contribution is still subject to taxes and depreciation before it's recorded as earnings.
    2. I'm using Android installed base estimated based on daily activation rates as published by Google. I've discussed these estimates here. I'm using year-end estimates but subtracting retirements based on a two year device life.


  7. Android economics: An introduction

    Research · 51 comments

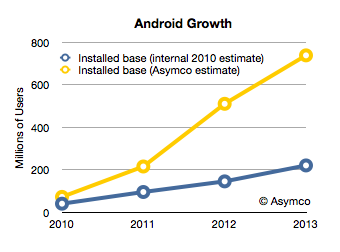
    Android has had unprecedented growth. Based on activation announcements, it's possible to estimate that thus far, about 370 million Android devices have been activated. The total number of devices in use is a lower figure which depends on replacement rate and retirement rate. This total number of devices in use at year end is estimated in the following chart.

    I added the blue line which represents what Google had as an internal estimate in mid-2010.[1] The difference between the two lines shows that Android's growth is far higher than what the company expected.  If the company itself did not expect this growth, it's unlikely anybody else did either.

    Unexpected, exponential user growth is usually accompanied by a dramatic positive improvement in the finances of a company and a higher return to shareholders. The curious aspect of Android's success is that it has not had an impact on either. The market has not "discounted" the half-billion anticipated Android users into a price for Google shares that reflects this growth. It can only imply that those users are not very valuable.

    But why would there be such a disconnect between the number of users and their value?

    In order to answer this question we have to come to grips with what I call "Android economics". We need to understand how Google uses Android to make money and whether it is succeeding and if it's not, why not.

    In many ways, the Android business model is straight forward. It's an extension of the existing Google business model: Revenue is obtained from Search, AdSense and the applications that enable these two.  In the case of Android there is also revenue from app sales (Google Play a.k.a. Android Market) and from AdMob. Of course, all these revenue sources (except for Play) are sold through other mobile channels that include alternative, competing platforms. They are present on iOS, Symbian, BlackBerry and even embedded OS phones ranged directly by carriers. For each of these alternatives, Google pays for placement of their search as the default search in the browser.

    To Google, total search revenue from iOS is far higher than it is from Android. That's because iOS users engage more with their devices and there are not yet a large multiple of installed Android users vs. iOS users.

    But it would make sense that having your own platform would be more economical because there would be none of these placement fees. In this sense Android is another "channel" for distribution of Search and AdSense. But one which may be a lot cheaper.

    However, it turns out that it does not work that way. Android has other costs.

    In fact, Android's distribution costs might be higher than other channels. What we have to understand is that all of Google's channel revenues have a "cost". The revenue from a particular distributor of search results that Google generates is offset by the cost to acquire the terms. You can think of it as Google paying for the queries through a revenue sharing agreement. Google does not get search terms directly and depends on distribution. Overall, it pays about 50% of revenues back to distributors. In the case of its own web sites the rate might be lower, perhaps 40%.

    Google even has a term for it: Traffic Acquisition Costs or TAC.

    This revenue sharing in exchange for search terms extends to Android. Google pays about 40% TAC to Android distributors of those searches. But since Android is owned by Google, who does Google need to pay for traffic? Who is an Android distributor? Who gets the revenue share?

    Google does not make a secret of it: network carriers and device vendors (OEMs) receive revenue share. From the latest earnings conference call:

    Yes. I mean, again, I'm not going to talk about specific of the TAC on mobile. But as you know, we get people using our devices both organically as well as through our distribution partnerships with carriers and OEMs. And typically, the OEMs and carriers participate in some of the economics that are on the Android marketplace or Google Play and some of them participate in the economics around Google Search just the way we would do syndication on the Web platform, which you do with many partners around the world. We have similar deals on the mobile front.

    - Nikesh Arora, senior vice president and chief business officer at Google Google Management Discusses Q1 2012 Results - Earnings Call Transcript - Seeking Alpha

    Arora made another point in the quote above. Not only is there revenue sharing with carriers and OEMs for Search and AdSearch but also for Google Play (app and content sales.)

    Device vendors and carriers get a cut. Google's model has always been one of giving a cut of revenue to their upstream distribution. It just might be surprising to hear that device vendors like Samsung and carriers get a piece of Search and apps.

    This basic observation leads to a series of questions:

    • How much is paid out and to whom?
    • Is that revenue sharing sustaining the ecosystem? Do vendors create Android devices and do carriers push Android to consumers because they get this revenue share or is the amount insignificant vs. device margin? What about tablets? Why haven't Android tablets they taken off as Android phones have? Are the economics to blame?
    • Is this a competitive advantage vs. other platforms? Does Windows Phone compete with revenue share for Bing? Is Microsoft offering a bigger carrot (as well as a stick?)
    • How does this economic picture show up in Google's financial and stock price performance? Or, more precisely, why doesn't it?
    • And, finally, what conditions create a virtuous cycle of growth and what conditions could turn it into a vicious cycle of decline? Is there a lurking factor which would cause Google to benefit greatly from this user base or is there an inherent point of failure in the model?

    I'll be answering these questions in a series of posts this week.

    --

    Notes:

    1. Google's internal documents were leaked as part of the Oracle trial (Exhibit 1061). They can be found by using Google search with the following search term: "OC quarterly review".
  8. The Critical Path: The First Year by Horace Dediu — Kickstarter

    Podcast · 19 comments

    The Critical Path has been an exceptionally well received podcast. It has an audience of hundreds of thousands of thoughtful listeners. Many of the concepts covered can and should be reviewed in a medium that can be referenced and annotated and shared. For this reason I would like to publish edited transcripts of the podcasts as an eBook. This will be an edited and tagged transcript of the first year of The Critical Path.

    via The Critical Path: The First Year by Horace Dediu — Kickstarter.