Asymco

Asymmetric Intelligence

Latest from Asymco

  1. The Mobile Phone Landscape

    Research · 19 comments

    I collected all the data available so far and created a new graph that illustrates the complete market evolution over a three year period.
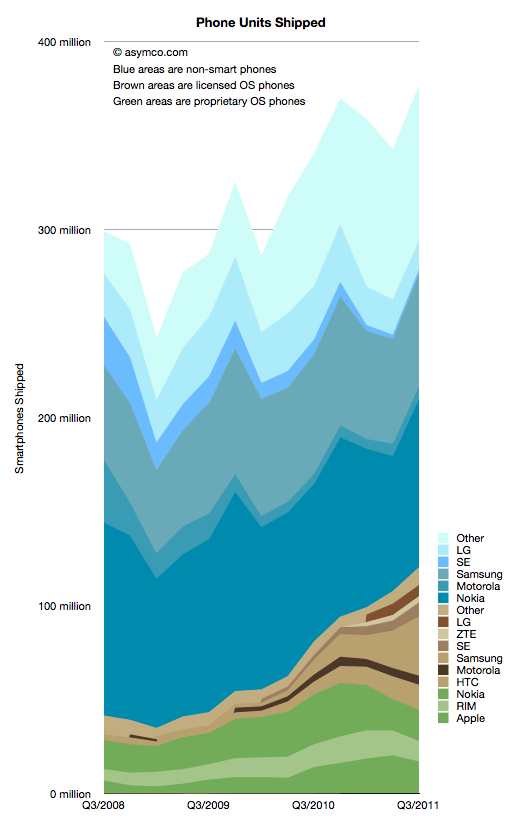
    I chose a particular color scheme where shades of blue represent non-smart devices (think blue ocean), shades of brown are smartphones with licensed operating systems (Android for the time frame above) and shades of green as proprietary operating system smartphones. Multiple vendors are shown and those which sell both smart- and non-smart phones are shown twice. Note that the legend shows the vendors in the same order as the stacked areas.

    There are several observations that are easy to make from this type of view:

    1. The smartphone market is growing rapidly, not surprisingly. However, the overall market is also growing. Smartphones as a percent of total units sold is at around 31%, up from 14% in Q3 2008. Smartphone units however have tripled in the same time frame (from 40 million to about 120 million). This means that almost all of the market's growth has been smartphones with non-smart units barely increasing from 258 million to 272 million over a three year span.
    2. Non-smart phones are far more seasonal than smartphones. As smartphones increase in share, seasonality should match that of the other phone types.
    3. The number of branded smartphone vendors has increased significantly with "others" becoming a small part of the total. In contrast, the opposite effect is taking place in the non-smart market. Non-smart phone shipments have concentrated in two main brands and a large set of "others". This bi-polar industry structure points to where the value is migrating and hence where rivalry is increasing. We can use these shifts as indicators of industry maturity.
    4. The opportunity for smartphone growth remains in the 70% un-penetrated blue area. However there is evidence that smartphone "switchers" are increasing with a noticeable decline in Nokia/Symbian and RIM. Apple's decline in Q3 is likely to be reversed in Q4 but Apple's share of all phones remains under 5%-- a five-fold increase in share from 2008 but a sign of how much is left to be done.
    5. As Nokia shifts its Symbian portfolio to a licensed Windows Phone model the licensed cohort will tip over into an "all but two are licensees" line-up. This should be particularly worrisome as value is shifting to software and services and "super-platforms". But before the disruption is complete, there are still some cards to play. Samsung and Nokia have vast non-smart volumes to convert and it's unclear if they will do it with Android and Windows vs. layering their own proprietary Bada and future Nokia Linux platforms.

    In the next few weeks I'll publish details of all the measures of the market but this first "landscape" view gives a good initial perspective. In the mean-time the data is accessible from the Asymco "cloud" here.
  2. Subscribe to Asymco One for full access to our research.

  3. Apple's Residual Enterprise Value is less than 7x Earnings

    Podcast · 70 comments

    In his third “The Critical Path” podcast, Horace Dediu explained how Apple’s cash can be viewed as a strategic option, an opinion that resonated also with other analysts [1]. Cash is one of the most flexible resources as it can convert quickly into other resources such as brands, companies, technologies, people and even processes. More cash means more strategic flexibility. The large cash reserve Apple has accumulated provides high flexibility for future investments. These characteristics of cash already imply an intrinsic option value. But how big is this value?

    Calculating Option Value

    To help us determine, I will apply the Black-Scholes model. The model has two key characteristics that are applicable to valuing the option character of Apple’s cash. First, the simple form of the calculation excludes dividends and, as far as we have seen, there is no new information available that would suggest that Apple will pay dividends in the near term. Second, it implies that the option can be exercised at any given time until the end of the option exercise period - just like any buying or investment decision made by consumers. Lastly, we will assume that Apple’s cash (including short-term and long-term cash as well as financial investments) is instantly available. Although large amounts are held by foreign subsidiaries or are invested in maturities longer than one year, we can overcome these practical issues by borrowing against it. As we are interested in the value of the whole pile, we use the latest reported figure of $81.6 billion as the strike price (or exercise price).

    What other inputs do we need to determine the option value of Apple’s cash [2]?

    • Volatility: A measure that determines financial risk of a certain asset. Apple’s share has shown a volatility of 26,1% over the last year.
    • The risk free rate determined by the 10 year US governmental bond interest rate: 1,96%.
    • A timeframe in which the option can be exercised. Let’s assume a 10 year timeframe in line with the risk-free rate and an imaginable horizon for mere mortals.
    • The value of the underlying (or what Apple is investing in):

    The return of the investment exercised with the cash at hand should yield a higher Return on Capital Employed (RoCE) than previously achieved to increase shareholder value. On the other hand, such a high cash pile also provides the flexibility to invest into lower return ventures. Such an investment would be taken if a certain technology or trend has been missed by management or becomes suddenly more important in the priorities of the company. In defensive moves or moat creating ventures, the expected return would be significantly lower or can even be negative. For the last twelve months, Apple has returned 106% in terms of operating income over its capital employed [3]. I use the return to value the underlying. For example, investing $81.6 billion in assets that yield 106% return equals a underlying value of $168 billion.

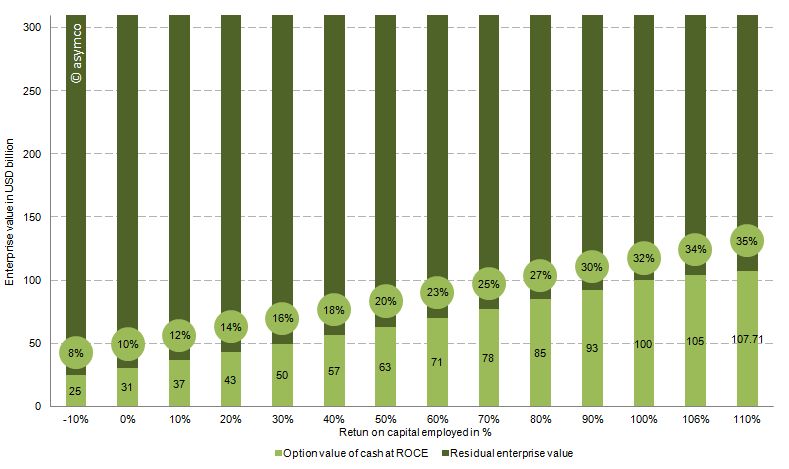
    The chart below shows the option value of the cash as a percentage of enterprise value of Apple (at the time of writing $310 billion) based on the range of the expected return on capital employed. Or in other words, how much of Apple’s current value is explained by the option value in holding such a large cash reserve.

    Conclusion

    Therefore, with the assumptions above and a RoCE from -10% to 110%, between 8% and 35% of Apple’s current valuation is explained by the option value of cash. We can see that even with large variations of the key input variables, Apple’s enterprise value is partly explained by the option value of cash which, in turn, is attributable to the sheer amount of cash at hand.

    If we look at the option value explaining 25% of Apple's enterprise value then 75% or $232 billion is the "Residual Enterprise Value" (REV) representing the value of Apple's cash flow generating operations. That puts Apple's valuation at 6.9x REV/EBIT 2011 or 6.5x REV/EBITDA 2011 -- fairly low relative to recent performance. EBITDA and EBIT have been growing at a rate of 70% for the last two years and at a rate of 84% over the last year alone.

    1. It’s good to be king (http://5by5.tv/criticalpath/3) , Apple: Behold The ‘iEndowment,’ Says Wedgewood (http://blogs.barrons.com/techtraderdaily/2011/09/20/apple-behold-the-iendowment-says-wedgewood/)
    2. For more information regarding option pricing see http://en.wikipedia.org/wiki/Option_(finance)
    3. Operating income of the last twelve month of 33.8 USD billion divided by capital employed of 31.8 USD billion defined as total assets minus cash (or sum of all asset excluding cash)
  4. Subscribe to Asymco One for full access to our podcasts.

  5. Estimating Samsung's smartphone mix

    Research · 57 comments

    Samsung no longer reports mobile phone shipments. The company's phone market performance reporting is limited to the following:

    Shipment : High-20%↑YoY (low-20%↑QoQ)

    ASP : Slight increase QoQ

    As the company did not report volumes or ASP last quarter either, the QoQ (Quarter on Quarter) growth estimates are almost useless. The only fragment that might be useful is the "High-20% YoY" given that they did publish units for Q3 2010: 71.4 million. This leaves the question of what "High-20%" means. Here are some ranges and what the result would be:

    • 92.1 million assuming 29% YoY growth
    • 91.4 million assuming 28%
    • 90.1 million assuming 27%

    The "best guess" might be 91.4 million.

    As the company also provides revenue for its mobile division (14.42 trillion Won) we can therefore estimate the average selling price: $142. Is this a slight increase? By a similar approach, last quarter's ASP was $139, and assuming exchange rates did not vary widely, this increase is small enough to be called "slight".

    We also have a figure for the operating margin for the entire Telecom group (16.9%) which gives an operating profit of $2.2 billion.

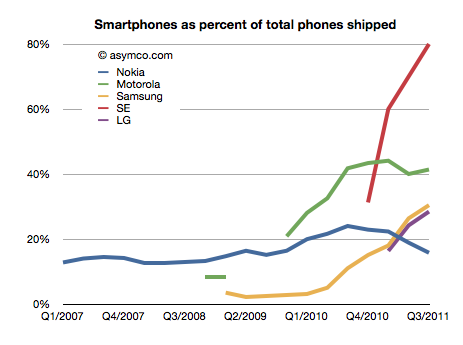
    The last piece of the puzzle is the number of smartphones Samsung shipped. Samsung said smartphones grew "more than 300%" year over year. That would imply 31.4 million. One estimate is from Strategy Analytics that suggests 27.8 but it's coupled to an overall volume estimate of 88 million (well below the 91.4 million estimated above). The Wall Street Journal published an estimate of 28 million.

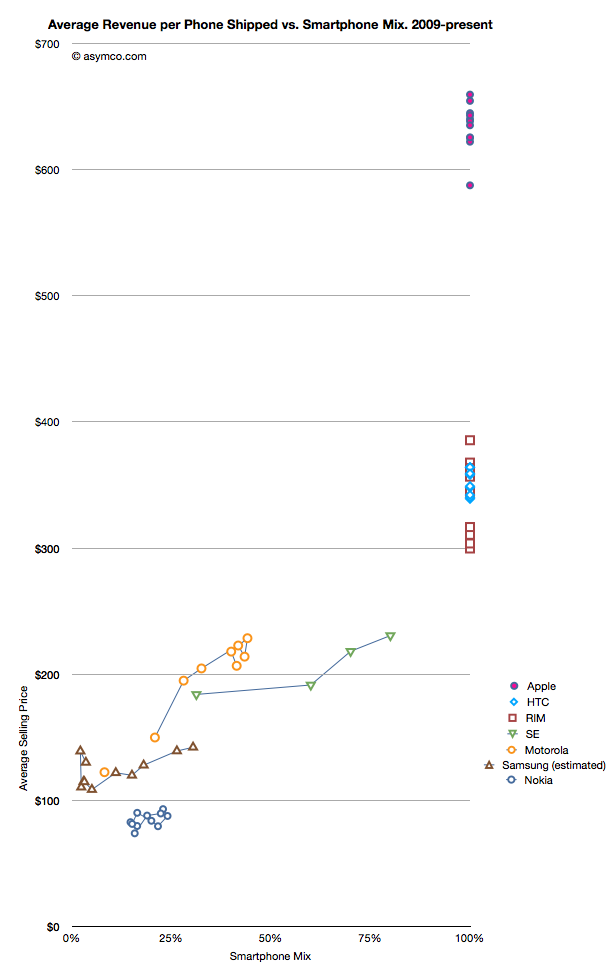
    I have no idea how to narrow down this estimate, but if we go with the one that claims the highest precision (27.8 million) we get an estimate of about 30.4% of Samsung's volumes being smartphones (what I call the "smartphone mix"). That is an interesting basis for comparing Samsung's smartphone business to other companies' smartphones. I prepared a graph showing how pricing is affected by the increasing mix of smartphones in vendor portfolios.

    What the graph shows is the movement of prices as companies have increased their smartphone mix since Q1 2009. For example Sony Ericsson moved from 31% smartphones to 80% smartphones in about a year. Their ASP increased from $184 to $231. Some companies have not changed their mix. Apple, HTC and RIM have maintained 100% smartphones in their portfolios so their pricing has been consistently high ($650, $354 and $357 over last 12 months, respectively). Conversely, Nokia has struggled with its smartphone portfolio and as a result its pricing has remained stubbornly clustered below $100.

    But the most interesting companies to watch are Samsung, Sony Ericsson and Motorola. You can see how their "vectors" or price migration point toward the sweet spot where HTC and RIM reside. Ideally, they would be very much better off with pricing in the $300 range.

    Samsung is moving quite rapidly toward the sweet spot but the slope is not as steep as the others. That's may be because SE and Motorola have much smaller volumes but it's still an open question why, with an estimated 30% mix of smartphones, the pricing remains $60 lower than when Motorola was at the same mix or $40 lower than Se.

    Some of the answer might be due to the number of "low end" smartphones (Bada?) that Samsung is selling or maybe their non-smartphone pricing is trending down a lot more rapidly.

    Keep in mind that if we change the assumption of the number of smartphones to a lower number (i.e. below 27 million) then the trajectory of the Samsung line in the graph would increase and may match more closely the slope of the other two vendors.

    I don't have any reason to believe that it's lower than 27 million but I don't have any reason to believe that it's above 27 million either. It's an estimate.

    If we believe it then we have to say that with a near tripling of smartphone mix (from 11% to 30.4%), the company grew its overall units by 28% and its revenue by 39% and pricing by 17%. Profits also grew by 130%.

    It would follow then that switching to a 100% smartphone mix would make a lot of sense.

  6. Subscribe to Asymco One for full access to our research.

  7. Assessing the Smart TV Opportunity

    Research · 83 comments

    There has been increasing chatter about a new TV being developed by Apple.

    My opinion on the subject was summarized in the post called Tele Vision. I contend that a TV cannot be smart until the content it delivers becomes smart. The logical conclusion is that the value chain needs re-integration so that the component which is not good enough (the content) can be improved along the dimensions that users value. And it cannot be improved unless the direction it needs to go into is aligned with the direction of the disruptive innovator. I won't repeat the theory here, but it suffices to say that whatever will change television will do so by re-defining the core product not just the tools we use to consume it.

    But today I wanted to address another question: how do we value the opportunity? In a back-of-the-envelope manner, can we tell if this business is big enough to try to fix.

    The answer depends a lot on the business model of the disruptive entrant. The entry could depend on software or advertising or hardware or distribution, and each would have a different valuation.

    But for the sake of calibration, I want to start with a proxy. The basic question of how many "terminals" exist to the value networks. How many units of TVs are sold and how many could a new entrant convert to a new paradigm?

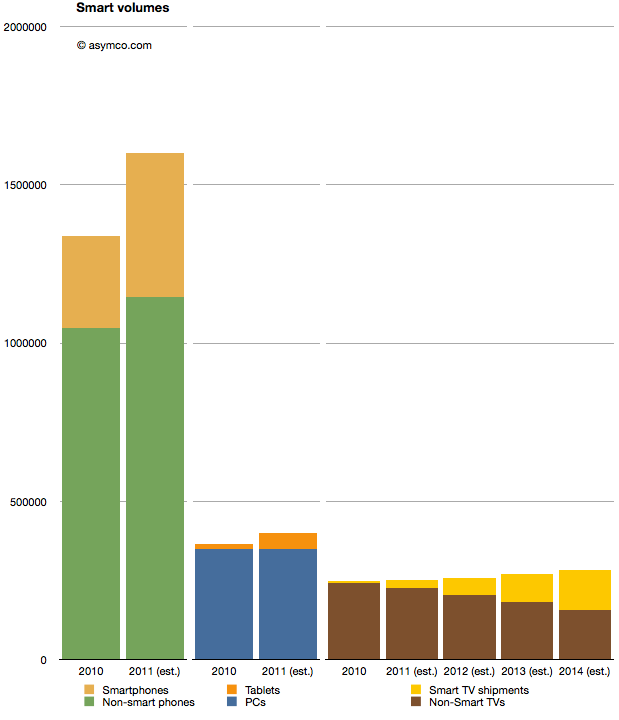
    I prepared the following chart showing the world-wide TV market with a highlighted subset of so-called "smart TVs" (source TRi). The market is shown from 2010 actuals through 2014 estimates. To make it more interesting I also added similar data for two other markets. Mobile phones and PCs with their own sub-categories of smartphones and tablets as equivalent "high growth" opportunities.

    When considering the opportunity, the Smart TV volumes are small relative to either tablets or smartphones. 2011 shipments are expected to be around 25 million Smart TVs, vs. 454 million smartphones and 51 million tablets. Looking forward, it seems that even by 2014,  smart TVs will be smaller volumes relative to either (projected) smartphones or tablets.

    A reason for this is that the TV market is not that big. It barely reaches 280 million units in 2014. Having reached saturation, the rate of growth is never assumed to be greater than 5%. The growth in the Smart TV business is assumed to be much higher however, being at least 100% in 2012, though off a low base.

    But the concept of what "smart" means in this forecast is troubling. Christina Bonnington at Wired highlights many of the failings of Smart TV.

    “In most cases consumers are buying a television with Internet connectivity as insurance. In other words, they are buying them just in case they need it in the future,” says Van Baker, a vice-president at the research firm Gartner. “Less than half of Internet connected televisions actually get connected to the Internet so clearly consumers don’t yet see this capability as a must have feature.”

    There is vast under-consumption even if the devices are being purchased. This looks eerily familiar to the smartphone market before they became usable by the vast majority through the transformative touch input method.

    So this market seems to be ripe for some serious re-definition. It may not be large today because there is nothing worth buying. Absent any innovation the forecasts can only foresee more of the same. If there is a breakthrough which "cracks" this puzzle then we might indeed witness unforeseen opportunity.

  8. Subscribe to Asymco One for full access to our research.

  9. The tipping hand of production: How Apple foreshadows iOS volumes

    Research · 74 comments

    Prior to the third quarter earnings report I discussed a part of Apple's balance sheet related to tangible assets (Plant, Property and Equipment). In a series of three posts I covered the Land and Buildings (data centers and campuses), Leasehold Improvements (store investments) and Machinery, equipment (tooling and factory equipment as well as servers.)

    The data shows that there is a consistent pattern of investment in pursuit of strategic goals: extending reach into distribution through stores, extending services through cloud infrastructure spending, and extending control over the supply chain. One story that still remains largely untold is how much does Apple know in advance what it will spend.

    In other words, can we tell if Apple can anticipate demand and does it plan its expansion well in advance?

    For an answer, the 10 K report comes in handy. Published only once a year, this document shows some data that is not present in any other public release. For example, Apple makes forecasts for capital spending.

    But first, an update.

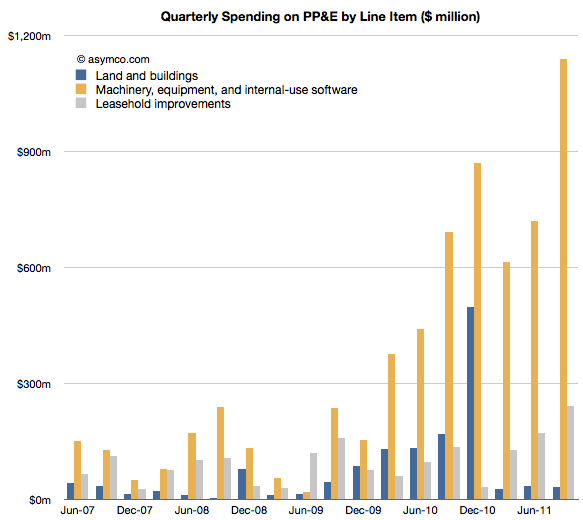
    Since the last discussion on PP&E, Apple reported third calendar quarter data. The 10K offers the details on how much was spent in the last quarter. Leasehold improvements increased by 240 million, a new record high. That might have gone into the 30 new stores opened in the quarter but it also signals more openings and renovations still to come.

    Land and buildings did not see any significant increase ($31 million).

    Machinery and Equipment growth was explosive. Over $1.1 billion was added to the value of those assets. The previous high was $868 million in Q1, presumably getting iPad and iPhone production ramped. The total for Q3 is about half of what was spent in all of 2010. The chart below shows the three items:

    The increase in M&E foreshadows increased device production so, while not very precise, it gives an idea that volumes are expected to be substantially higher in the following quarter. More about this when I make my forecast.

    Now I want to focus on Apple's ability to forecast its own production. As I mentioned, once a year, Apple predicts its CapEx. That prediction is broken down further by Retail expenditures and M&E+Real Estate. Let's look at Retail first.

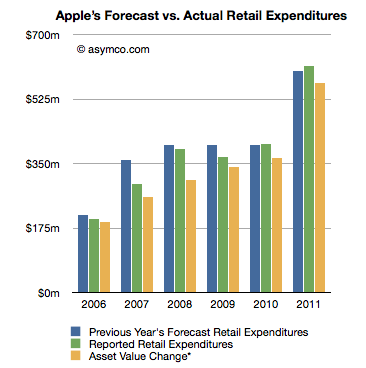
    The following chart shows three bars: a previous year's forecast (from the 10K), reported expenditure (from the next 10K) and my own running estimate based on asset value changes.

    If we consider the forecast as a "budget" for the next year, what can be observed is that the spending was closely "within budget".

    Going by reported expenditure, the company was within 1% of expected budged for store spending in 2010 and 2% in 2011. It underspent for the years 2006 through 2009, though again, but modest amounts.

    What this suggests to me is that store roll-outs are predictable for Apple. The costs involved are also quite predictable and things seem to be happening on schedule. The retail expansion is a steady slog.

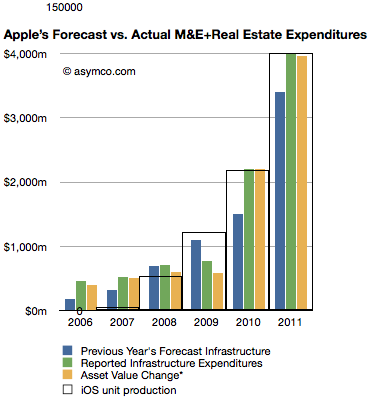
    The next chart does the same comparison but with Machinery and Equipment and Real Estate.

    Here the story is different. The company has typically over-spent what it forecast.

    Here are the "deficits" for this asset class by fiscal year:

    • 2006: 154%
    • 2007: 68%
    • 2008: 0%
    • 2009: -30% (surplus)
    • 2010: 47%
    • 2011: 18%

    This suggests that unlike retail, production for Apple has been far less predictable and that the predictions for spending were mostly lower than actuals. It might imply that production was higher than expected as well.

    What this analysis suggests overall is that although production (and spending) are increasing, the rate of increase is a bit higher than what Apple expects a year in advance. Some of that might be due to increased costs, but some may be due to changes in capacity.

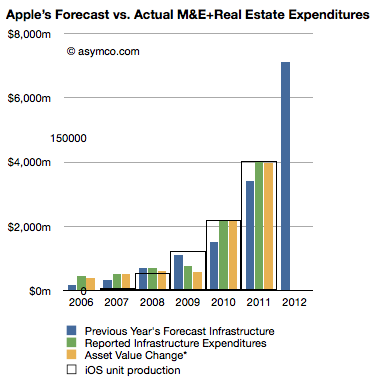
    Note the iOS unit production "wireframe" bar chart overlaid on the expenditure chart. As with quarterly data, the yearly (fiscal) production ramps remarkably consistently with M&E expansion.

    Looking forward, the company predicts $8 billion in PP&E, exactly twice what it forecast last year. Retail expansion is forecast at $900 million an increase of 50% and "Infrastructure" (M&E) increase of 110% to $7.1 billion.

    Knowing that Apple tends to over-spend on M&E, we can assume that they will at least double spending on machinery and equipment. Knowing further that increase in M&E spending correlates to iOS device production (see chart at left noting the inset scale marked with 150 million units), it implies that iOS device production is set to continue growing at the same rate it always has: 100%.

  10. Subscribe to Asymco One for full access to our research.

  11. 5by5 | The Critical Path #11: The Thermonuclear Option

    Podcast · 93 comments

    Episode #11 • October 26, 2011 at 12:00pm

    Dan and Horace talk about patents and litigation as a means of defending innovation. We go way back to the beginning of the last century and talk how patent wars have played out in the past and how they affected the fortunes and fates of innovators.

    This episode is sponsored by Squarespace and TinyLetter.

    ---


    IMPORTANT: I made an error in claiming that Mauser litigated for royalties during WWI. The litigation with Mauser preceded the war, but the bullet design used in the rifle was the subject of litigation before, during and after the war. The story of that patent fight is described here: The Tale of the Spitzer Bullet Patent Lawsuit | asymco

    To read more about the Wright Brothers patent war see: The Wright brothers patent war - Wikipedia, the free encyclopedia

  12. Subscribe to Asymco One for full access to our podcasts.

  13. The other tablets

    Research · 89 comments

    Analysts have to count things in order to measure value. It sounds easy but it can be tricky. As I pointed out with PCs vs. iPads, if you count an iPad as a PC you can get into a lot of trouble with your clients. But if you don't you end up directing them away from confronting an existential threat. Only very rarely is a market report published in contradiction to widely held sustaining beliefs. More often than not analysts bow to the source of their paychecks and in so doing show their rear end to the truth.

    This comes up again now with respect to how to count tablets. Consider that there is little difference in architecture, software or design between an iPhone and an iPad. They run the same OS, use the same microprocessors and have similar communication methods, inputs and sensors. However they are considered completely different products and counted as part of separate markets. The only physical attribute that differs is the screen size. So we have to conclude that the size of the screen is a huge determinant factor in deciding whether a product is a tablet but not a smartphone (or music player).

    But what about tablets themselves? Their screen sizes vary widely. A 10" screen is certainly a tablet device, but a 4" screen certainly isn't. Where is the boundary exactly? It seems that a 7" device is still a tablet but a 5" may not be. The Dell Streak 5 device is presumably not a tablet. The arguments then descend into an arbitrary definition of tablet based on whether it fits in one hand or in a bag of a certain size.

    This begins to sound academic. Why should it matter what size is or isn't a valid tablet? Buyers are not in the market for screen sizes. They are in the market for products that can be hired to do jobs or address pain in their lives. So as far as consumers are concerned, these categories are meaningless. If you want to design something you'd better segment according to jobs to be done.

    However, buyers are not the target audience for the analyst. Nor are product designers (hopefully anyway.) Part of the reasoning of offering market research is that it presumably helps ecosystem participants (vendors, developers, retailers, etc.) decide where to invest their time and money. They are the target audience. They don't spend their lives reading tech blogs. For them it's important to understand "which way the wind is blowing" and that's where an analyst should be helpful with data.

    But then if we are to measure ecosystems, we have more difficulties.

    The iOS ecosystem is pretty well understood. Apple publishes the number of devices it sells and the number of apps on its store and downloads, etc. We can assume Microsoft will do the same with Windows 8 as they do already for Windows in general.

    For Android, it's a challenge. Google measures activations, but that may not cover the actual units sold. Google admits that it does not know how many Android devices are sold or even how many are for sale. It's in the nature of open source that it's not controlled and hence not measurable.

    But analysts still try. Consider the estimate that about 27% of all "tablets" shipped are Android. That's not something Google helped with. Google can report the number of activations of a certain version of the OS, but they themselves don't know what the device looks like or what size screen it has. A device vendor can put any version of Android on a device of any size. To find out how many tablets run Android, you need to try to estimate "bottom up" by adding the output from various vendors.

    However, it's clear that a large number of these devices are not exactly Android. Consider what  Kevin C. Tofel writes for GigaOm:

    I asked Strategy Analytics to clarify both of those points and received the following email response from Neil Mawston, the analyst who wrote the report: ”Yes, the press release refers to shipments, not sales. All sub-versions of Android are included. Yes, the B&N Nook Color tablet is included in the tablet figures.”

    So the B&N Nook is counted as an Android tablet and part of the 27% share of Android. But Google itself does not count the B&N Nook as an Android tablet. It's not something that can even use the Android brand. From Google's own documentation:

    We define an "Android compatible" device as one that can run any application written by third-party developers using the Android SDK and NDK. We use this as a filter to separate devices that can participate in the Android app ecosystem, and those that cannot. Devices that are properly compatible can seek approval to use the Android trademark. Devices that are not compatible are merely derived from the Android source code and may not use the Android trademark.

    In other words, compatibility is a prerequisite to participate in the Android apps ecosystem. Anyone is welcome to use the Android source code, but if the device isn't compatible, it's not considered part of the Android ecosystem.

    So to summarize, whereas the Nook is counted as an "Android tablet" it...

    • cannot be called an Android device without violating the trademark
    • may or may not compatible with Android Apps
    • does not include Google Services like Google Maps
    • cannot license the Android Market client software or brand
    • is not considered to be a part of the Android ecosystem by Google

    All this is also true for the Amazon Kindle Fire and whatever Baidu, Alibaba and other Google competitors will be selling. Furthermore, Google can define compatibility and therefore what "being Android" means arbitrarily and can change that definition at will. It can even withdraw compatibility on the basis of business priorities.

    It matters because these devices might end up very popular (see Amazon's reporting of Fire's pre-orders in its quarterly earnings call) and in aggregate could even be the majority of "Android tablets".

    The result is that most analysis of the Android ecosystem (and by comparison, all mobile ecosystems) depends on classifying as Android devices those that compete with Google, and indeed, with Android. For the purpose of assessing value, growth and opportunity for third parties such reports fall short.

    So what should be done?

    The solution is simple: Count as Android devices those that are allowed to be called Android as per Google's own definition. It makes clear that developers can reliably sell their software through the Android Market. It makes clear that those devices are designed to use Google services and it makes clear that those devices are not designed to compete with Google.

    Those devices which are using "derived" Android source code and are not compatible (as per Google's definition) and are not allowed to be called Android by their vendor should be called something else. Maybe "Android-like" or "Android derivative" or "Non-Google Android" or just "Other".

  14. Subscribe to Asymco One for full access to our research.

  15. A tale of two disruptions

    Research · 58 comments

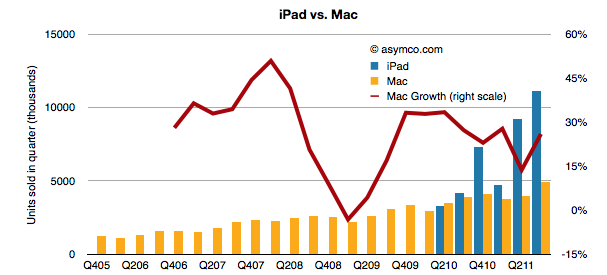
    Last quarter the iPad had unit growth of 166% with revenue growth of 146%. The iPad is selling more than twice the (also rapidly growing) Mac. The two product lines are shown below:

    A big reason the Mac is still growing is that it now consists of 74% portables and the MacBook Air and Pro products are still largely unmatched and have a near monopoly in their target price.

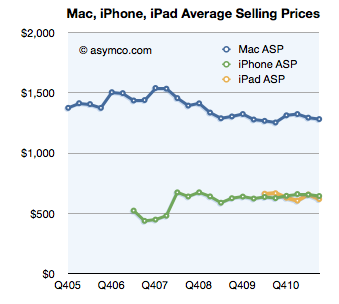
    The Mac's average selling price has remained remarkably steady for three years.

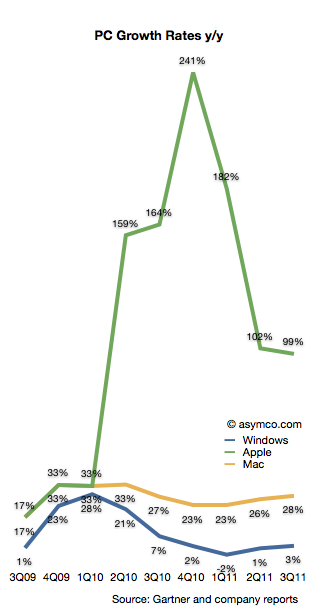
    But more importantly the iPad and the Mac both outgrew the PC market. Taken as OS X vs. Windows, the growth rates were 27.7% vs. 2.5%. If iOS is included along OS X, Apple grew its "computer" shipments at a rate of 99%.

    The following chart illustrates the growth rates for Windows, Mac and Apple as a combined OS X/iOS.

    The Windows platform still ran on 82% of PCs sold in the quarter with iOS taking second with 10.5%, OS X third with 4.7% and Android at about 3%.

    Even though Mac OS X grew faster than the overall PC market for 20+ quarters, its market share is still below 5%--lower than what the iPhone has been able to obtain in the far larger mobile phone market.

    That share has grown from 3.2% in the same quarter of 2008 but it's still a very slowly changing landscape.

    However, if we include the iPad, Apple begins to not only grow very rapidly, it moves up sharply in terms of ranking among PC vendors.

    Last quarter's 16 million OS X and iOS tablets brought it into second place behind the 16.6 million PCs that HP sold. That was enough to give Apple 15% share vs. 15.7% for HP. Over the last three years Apple has gained nearly 12 points of percentage of share.

    The other vendors mostly lost share but the most affected were the smaller OEMs. HP lost 2.6 points, Acer 3.9 and Dell 3.4. However "Other" lost 10.5 points. Lenovo is the only major vendor to gain share (+4.48 points).

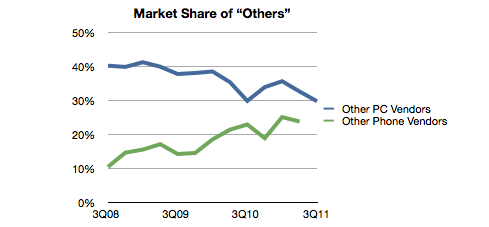
    What's interesting about this pattern is that whereas in the phone business "others" is a rapidly growing group of companies, in PCs the smaller vendors seem to be suffering. They still make up about 30% of the market but that's down from about 40% three years ago.

    In contrast, "Other" went from 15% to 24% of the phone market in the same time frame. Part of the explanation is that the entry of the iPad took the wind out of the "low end" netbooks and other cheap PCs. Consumers migrated low-end usage to a product re-built around those jobs.

    In the mobile phone market, the disruption is in the opposite direction: communication is moving rapidly up-market from real-time voice to latent messaging and from storage consumption to broadband consumption. The companies being rewarded today in the phone business are those who are leading the charge to new markets.

    In other words, on the PC, we are witnessing low-end disruption. On the mobile phone we are witnessing new market disruption. The irony is that the low end PC and the high-end mobile are very nearly the same thing but the industries, channels and incumbent business models are very different.

  16. Subscribe to Asymco One for full access to our research.

  17. Putting capital to work

    Research · 30 comments

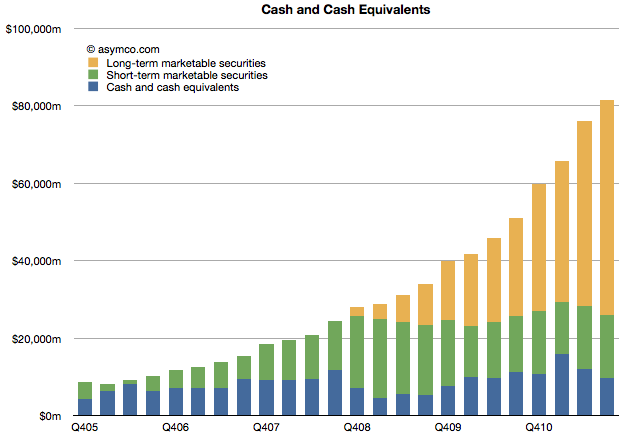
    Apple's Cash and Marketable Securities has been the focus of attention for many year now. It has now reached $81.6 billion equivalent to a value of $86.8 per diluted share. Currently each share is worth about $393 making the enterprise value $306/share or 11 times last twelve month's earnings.

    The division of liquid cash and cash equivalent asset types is shown in the following chart.

    The company added $5.4 billion to its cash reserves during the quarter and now keeps two thirds of that outside the US. Long-term securities (bonds mainly) are now also about two thirds of total. Both of these ratios have increased this year. Some of this shift may be explained by changes in the strategy employed by the CFO/treasurer, but there is another set of assets that has changed dramatically and may explain the change in cash allocation.

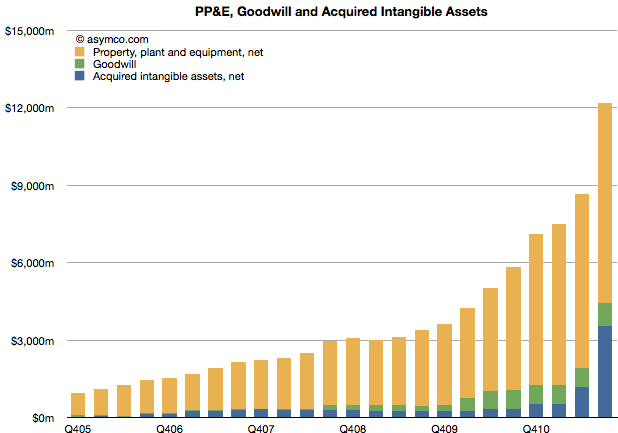
    I've written about the PP&E assets and their dramatic increase, but the "Acquired intangible assets" have also had a huge increase in the last quarter ($2.3 billion). Much of that is attributed to the acquisition of Nortel's patents.

    Unlike cash, these assets can be considered an "investment" by the company. They are expected to (but may not) return value to shareholders in excess of the average cost of capital. Therefore, they demonstrate that some of Apple's capital is being "put to work" rather than resting idle as many suggest. Apple is buying patents and companies and intellectual property. $12 billion worth so far.

    Whether they will be a good investment, we cannot tell, but the allocation of capital to non-cash assets is already significant and has grown more quickly than cash. They have, in fact, more than doubled in a year and quadrupled in two.

  18. Subscribe to Asymco One for full access to our research.

  19. The growth surprise in Apple retail

    Research · 58 comments

    In Apple: For What It’s Worth Jeff Matthews asks a question "about the most disturbing pattern coming out of Apple’s earning release: the measly 1% year/year revenue increase at Apple’s retail stores".

    He notes that prior to the drop, Apple stores were growing at 36%. Such a huge drop quarter on quarter seems suspicious and he thinks something is happening.

    Something is happening.

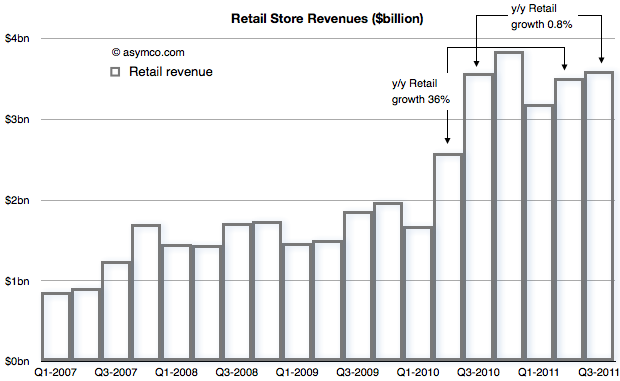
    To find out what, let's start with the revenue from Retail that Apple reports[1]


    The concern is with that low growth between calendar Q3 last year and this year. That is being contrasted with the growth in the previous quarter (Q2) of 36%.

    When seen as a chart, the explanation for a big change in growth is perhaps easier. The third quarter of last year was a boom for retail and the quarters that followed were more-or-less similar in sales level.

    With this perspective, it's clear that there was a surge in sales during the last year which did not repeat this year.

    But what's the cause for this pattern? If we know the cause can we predict if retail sales growth will increase or decrease?

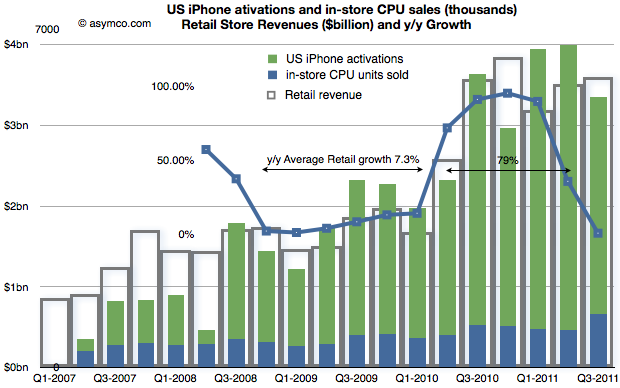
    Consider the following compound chart:

    The chart shows three different quantities.

    1. The original retail sales values in "hollow" bars
    2. The growth in those values year-on-year (in a line chart)
    3. A "proxy" candidate for retail growth explanation: the sum of US phone activations and in-store CPU units sold as a stacked bar chart.

    The choice of proxy includes the blue bars which Apple reports as in-store "CPU units" and the US phone activations[2] coming from AT&T and Verizon[3].

    We can see now that there is a strong relationship between iPhone sales growth and store sales growth. The Mac business is growing but not in the bursty way that iPhones are growing. The growth of US iPhones matches the growth in (US mostly) Apple retail. This should not be a surprise.

    The bursty nature of iPhone means that store growth varies just as dramatically. I highlighted that during the period of Q4 2008 to Q1 2010, Apple store revenue grew at an average of 7.3% but following the "big bang" of the iPhone 4 launch they grew at 79% over the subsequent five quarters (because the comps were easy).

    In the latest quarter the growth dropped as there was no launch of a new iPhone to top the big bang of a year earlier. Even so, store revenues actually increased by a slight amount.

    Knowing that the comp with the year before was so tough the surprise isn't that the growth slowed, it's that there was any growth at all.

    If iPhone as a cause for growth in retail is to be believed, then how hard can it be to forecast retail growth in the future?

    ---

    Notes:

    1. Apple does not submit this information to the SEC but reports it (exclusively I believe) during the earnings conference call. Transcripts are available on seekingalpha.com but fortunately they are recorded as well by Gary Allen at ifoapplestore.com.
    2. I used US data for the iPhone as most of Apple stores are in the US. The global pattern is similar.
    3. I had to estimate Verizon units used during the last quarter as they have not been reported yet. I used a similar ratio between AT&T and Verizon as for the last quarter.
  20. Subscribe to Asymco One for full access to our research.

  21. Are Apple’s investments in PP&E extraordinary?

    Research · 34 comments

    In his recent posts Horace took a look at Apple’s fixed assets and their development over the recent years. He also tested the hypotheses that Apple is making investments into machinery & equipment on which iOS devices are produced by overlaying iOS volumes with preceding changes in property, plant and equipment (PP&E).

    The question that has arisen is: Are Apple’s investments in PP&E extraordinary?

    To answer, I have compiled the capital expenditures (CapEx) for our previously established peer group [1].

    But first we need to clarify what CapEx include and not include. CapEx includes investment into property, plants, equipment, office furniture, larger IT hardware and in some cases patents; CapEx do not include investment into long-term marketable securities or other long-term financial instruments, acquisitions or capitalized R&D. Furthermore, CapEx are gross values and are not net of any sold equipment [2]. CapEx are largely depending on a company’s business model and strategy. For example if you are a manufacturer you need equipment to operate, if you are a software company or a retailer, your business will not be capital intensive.

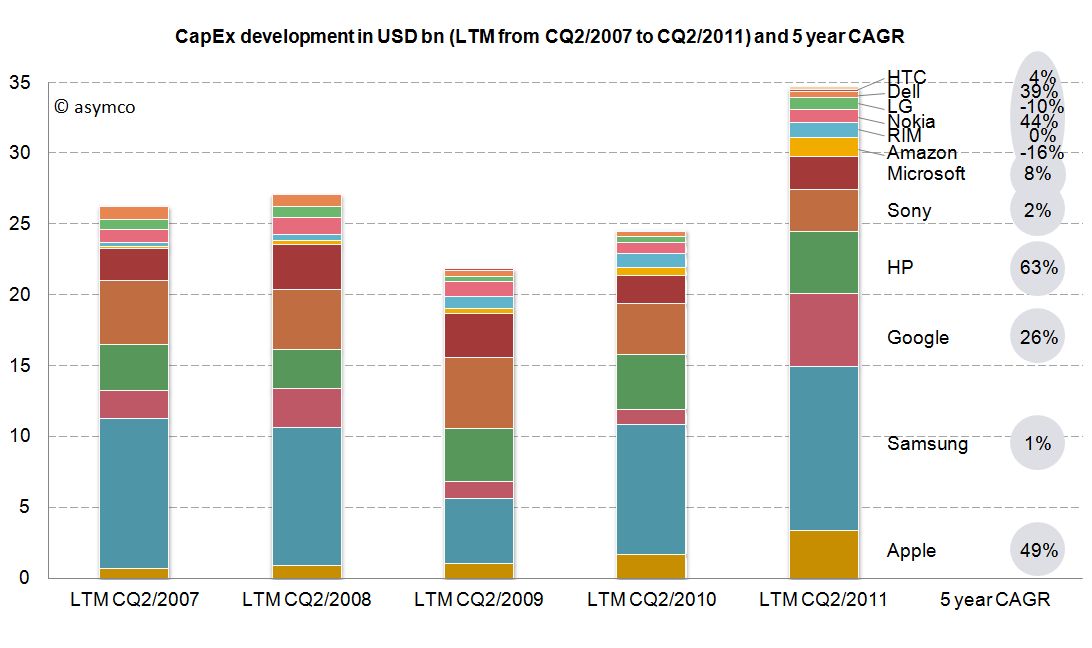
    As the second calendar quarter of 2011 is the latest quarter for which all companies have reported figures, we will take a look at last twelve months’ (LTM) figures from Q2/2011 backwards. The following stacked bar chart shows the combined CapEx of our peer group:


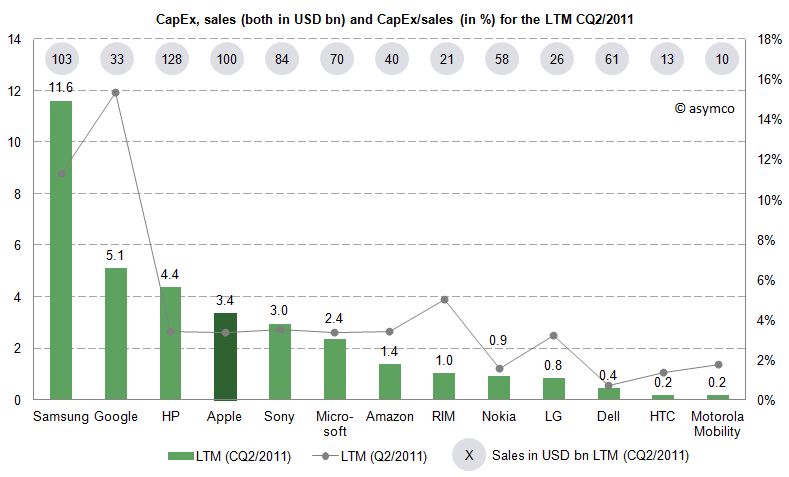
    The combined capital expenditures of our peer group for the LTM CQ2/2011 have outpaced even pre-crisis levels of investments and, combined, account for $34.7 billion. Samsung, a diversified manufacturer of IT hardware and other equipment, has invested more than $11.6bn with Google ($5.1bn), HP ($4.4bn) and Apple with $3.4bn following in line. While Google’s CapEx mostly account for its infrastructure of server farms and other IT hardware, HP’s CapEx mostly account for IT hardware it leases to its customers [3]. In absolute terms, Apple takes fourth place in CapEx spending for the last twelve months ending in CQ2.

    Since the business model and sales magnitude varies largely in our peer group, we can also take a look at a common measure to compare CapEx intensity by dividing CapEx by sales achieved in the same period. For the last twelve months we can depict the following chart:


    The average of the peer group accounts for 4.4% of CapEx over sales. Samsung’s and Google’s business model are clearly more capital intensive, while Apple’s CapEx ratio of 3.4% is below the peer group average but above some of its peers like Nokia, Dell, LG, HTC or Motorola Mobility. Interestingly, capital intensity of HP, Apple, Sony, Microsoft and Amazon is at a comparable level of around 3.4%.

    As noted before, business models and strategies are significantly different among companies in our peer group. However, while Apple’s CapEx intensity is not extraordinary, Apple’s CapEx in absolute terms are among the largest in it this peer group and have grown constantly throughout a five year period.

    Is this a good thing and why does it matter?

    CapEx by itself does not tell us much. We still do not know in what companies specifically invest as financial regulations do not require detailed CapEx accounts. We know that even if a company is not growing assets they need to be maintained, upgraded and replaced – this spending is also called "Maintenance CapEx". Everything else can be called "Expansion CapEx" associated with new product launches, entry to new business area or geographies or expansion of (manufacturing) capacity.

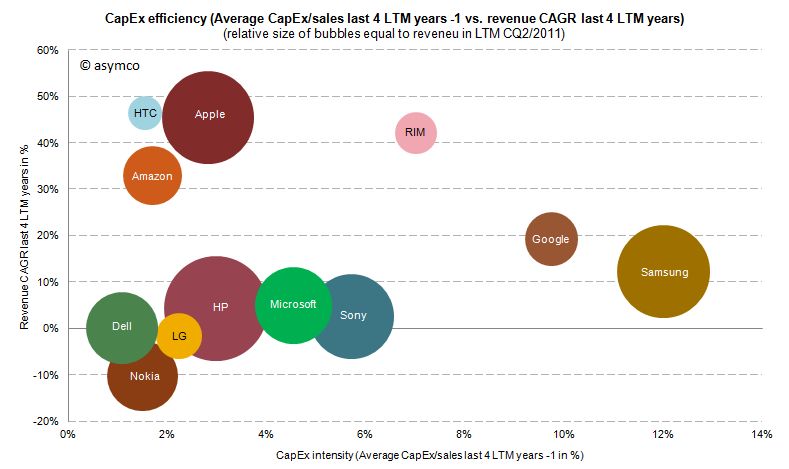
    Therefore, Expansion CapEx is closely linked to expected organic sales growth in the future. So let’s go ahead and link CapEx ratio of the previous years with the sales growth of the following year. The following chart shows the cumulative average growth rate (CAGR) over the last four years versus the average of CapEx/sales ratio of the four last preceding years:


    We can see that high CapEx efficiency has been achieved by Amazon, Apple and HTC with sales growth rates of 33-47%. RIM reached similar revenue growth but with higher CapEx intensity. Google and Samsung with high CapEx intensity have only reached modest growth rates. Dell, HP, Microsoft and Sony have not grown significantly but have close to average CapEx intensity.

    We cannot state that CapEx in absolute terms have been extraordinary for Apple, but we can witness that with below average CapEx/sales ratio Apple outgrew in absolute terms Dell, LG, Microsoft, Nokia and Sony and has grown close to the revenue size of Samsung and HP in the last four years.

    ---

    Notes:

    1. Excluding Lenovo (not reported) and Acer (extra-ordinary low numbers reported, to be investigated), Motorola Mobility figures only available for the last six quarters
    2. Minor differences may occur due to local Generally Accepted Accounting Principles (GAAP)
    3. HP assumes ownership of these assets and rents them to the customers who in turn have a smaller balance sheet and can run IT hardware CapEx through the income statement as lease expenses