Asymco

Asymmetric Intelligence

Latest from Asymco

  1. Visualizing the Steve Jobs era

    Research · 44 comments

    On October 4th, Tim Cook will take the stage at Apple’s fall event. With Steve Jobs’ transition to head the Board of Directors of Apple and after serving as CEO for fourteen years, it is time to take a look at his reign.

    Looking at his performance vs. peer companies from a capital market performance, I have composed the following two charts:

    Market capitalization of selected peer companies by calendar quarter in USD million sorted by most recent market capitalization (1997-2011)
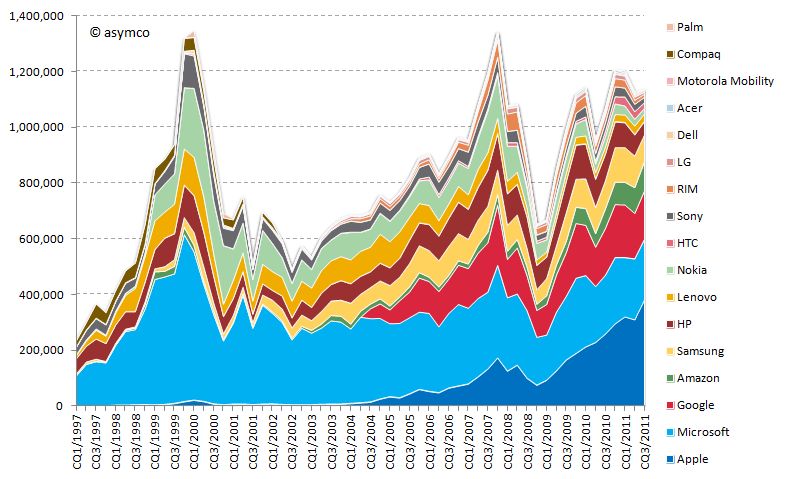
    Market capitalization of selected peer companies in USD million sorted by recent market capitalization (1997-2010)

    Market capitalization as share of combined market capitalization by calendar quarter sorted by most recent market capitalization (1997-2011)
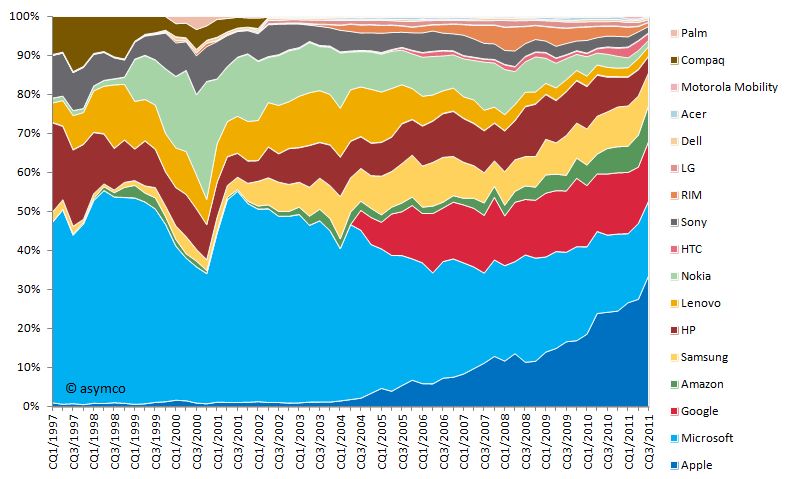
    Market capitalization as share of combined market capitalization sorted by recent market capitalization (1997-2010)

    You will note that I included more companies than in previous analysis. The new additions are:

    • Compaq (acquired by HP in 2002)
    • Palm (acquired by HP in 2010)
    • Amazon (a popular request by readers)

    I divided this era into three distinct periods:

    Restructuring of Apple 1997-2000

    In the beginning of 1997, Apple’s market capitalization was lower than almost all of its peers. In absolute terms the market capitalization moved only slightly upwards towards 1999 and the dent in 2000 is significantly lower compared to the market capitalization increase of other companies, first and foremost Microsoft's. Especially in the early part of this period restructuring and streamlining efforts took precedence. The introduction of iMac in 1998 and the iBook in 1999 set the tone in terms of design, quality and "thinking different" for many years to come.

    iTunes era 2001-2006

    With a stable core business and healthy profitability, Apple introduced the first iPod in October 2001 complementing the earlier introduced iTunes music player. Two years later, Apple introduced the iTunes Store offering downloadable music for the Mac and Windows operating systems. The venturing into the music and portable music player business and the halo effect for the Mac business is reflected in the market capitalization increasing significantly during the following years surpassing HP and Nokia.

    Mobile iOS devices 2007-2011

    Market capitalization further increased with the entry into the smart-phone market in 2007. Note that market capitalization of all selected companies combined at that time was as high as in the dot.com era of 2000. But this time Apple accounted for more than 10% of it. From 2008 to 2009 market capitalization of all companies declined severely due to the financial crisis. Rapid recovery followed during 2009 and early 2010. Apple introduced the iPad in March 2010 further fueling its rise to the top, surpassing Microsoft’s capitalization and topping Exxon Mobil as the world's most valuable listed company.

    During the time of Steve Jobs as CEO, Apple's market capitalization increased on average by 42% every year--an unprecedented track record. According to his own admission, Steve Jobs became CEO when Apple was 90 days away from bankruptcy. He resigned 14 years later after leading Apple to becoming the most valuable listed company in the world. From a value creation point of view, it's hard to think of a better performance from anyone, ever.
  2. Subscribe to Asymco One for full access to our research.

  3. When will Apple's share price reach $500?

    Research · 51 comments

    Apple's share price has recently hit a new all-time high, over $400 per share. As often happens there was no specific new information from the company to justify this increase. On the other hand there is usually no news to justify share price drops in Apple. In fact, the stock is up on what would be considered counter-indicative news: the resignation of a very important CEO.

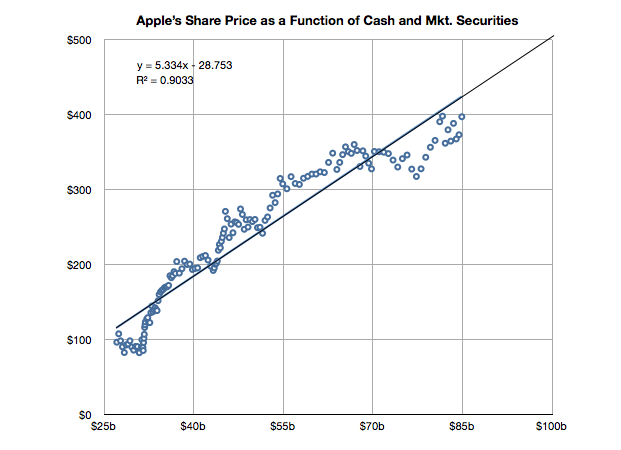
    But readers may recall that there is a measure of performance for Apple we can turn to that seems to show strong correlation to its stock price. It's not income and it's not growth in income but it's the strength of the balance sheet.

    I demonstrated this relationship last May with a post titled The market values Apple’s balance sheet, not its income statement.

    It's time to look at the data again to see if the relationship still holds. I added the data for Q2 and made some estimate about the cash position since July 25th (we will know this data with more accuracy when Q3 data is reported in a few weeks).

    The slope of the line above has decreased slightly but a strong correlation can still be observed. The old r-squared was 0.94 and it is now 0.90. I included the formula for the y variable (share price) as a function of x (cash).

    If you plug in $100 for x you get about $500 for y. So if this relationship continues[1], the answer to the question in the title would be "When the cash and cash equivalents reach $100 billion."

    ----

    Note:

    1. Note that whether the relationship holds (which it very well may not) depends on a strong correlation and "strong" is not well defined. The correlation has weakened slightly in the last six months.
  4. Subscribe to Asymco One for full access to our research.

  5. Decoding Steve Jobs: Select Commentary from HBR.org - Harvard Business Review

    Research · 2 comments

    Announcing a new HBS PRESS BOOK

    Decoding Steve Jobs: Select Commentary from HBR.org

    by Norm Smallwood, Kate Sweetman, Dave Ulrich, Rosabeth Moss Kanter, Jeffrey Pfeffer, Horace Dediu, James Allworth, Max Wessel, Rob Wheeler, Bill Taylor

    Source: Harvard Business Press Books

    14 pages.  Publication date: Sep 22, 2011. Prod. #: 10973-PDF-ENG

    "The news of Steve Jobs's retirement from Apple may be losing steam but observations on his legacy - and Apple's leadership future - are only beginning. In recent years, leading thinkers have contributed their thoughts on the Jobs phenomenon on HBR.org. We've compiled a few of the best here, and we invite you to read them through the lens of business lessons to be learned.' We've selected six pieces: two from after Jobs's August 2011 announcement and four from before. We hope you will enjoy them, learn from them, and continue to turn to HBR.org for ideas and inspiration.

    Available for download for $1.99 via Decoding Steve Jobs: Select Commentary from HBR.org - Harvard Business Review.

  6. Subscribe to Asymco One for full access to our research.

  7. Subscribe to Asymco One for full access to our podcasts.

  8. The perils of possession without utilization

    Research · 184 comments

    [Updated with new charts including data from StatCounter and not NetMarketshare]

    Generally speaking there is an equivalence drawn between iOS and Android as technologies and even as user experiences. However, as I've pointed out on several occasions there is a very clear nonequivalence in business models and thus the "fuel" which keeps each platform running. But does this difference in models lead to some difference in the way the products are "hired" to do what they do. Does it imply anything about how the products are likely to evolve?

    I collected into one place all the data I could find about utilization (how much of a service and how often it's used) and possession (both in terms of current ownership and new acquisitions) of iOS and Android.

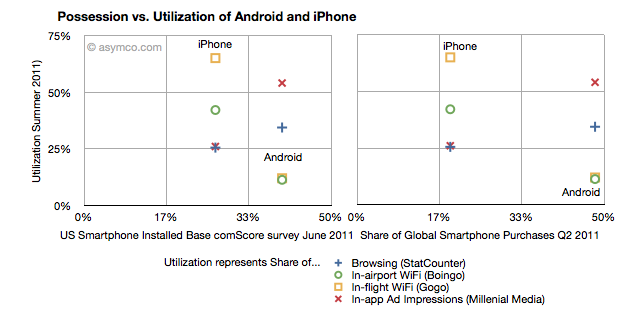
    Possession data comes from comScore survey data of share of US installed base of smartphones by platform at the end of June 2011 (first chart) and share of Global Smartphone Purchases as of Q2 2011 sourced from company reports and IDC (second chart).

    Utilization data (vertical axes) comes from August  2011 shares of mobile browsers (from StatCounter June 2011), in-airport WiFi associations from Boingo in June 2011 (iPhone vs. Android), in-flight Wifi associations from Gogo in June 2011,  and In-app Ad impressions from Millenial Media also in June.

    The charts are divided into nine sections corresponding roughly to "low", "medium" and "high" utilization vs. possession.

    The first chart compares a US-only population for possession vs. a mixture of global and US-only populations for utilization. The second chart compares a global population to the mix of US and global metrics.

    What I found interesting is that if we take ad impressions (red X) and browsing (blue +) data out, the two platforms are indeed quite distinct. iPhone has a medium level of possession with a high level of utilization of data services while Android has a high level of possession with a low level of utilization. The data is also nicely clustered.

    If we take just the ad impression or browser data then the platforms are quite similar: medium utilization for medium possession and high utilization for high possession. If the two platforms were to swap places in possession (i.e. market share) then they would probably also swap places in utilization (i.e. impressions).

    What the data seems to suggest therefore is that for data services the iPhone is a far more popular tool than Android. But for in-app ad impressions and browsing the products are used in a similar manner.

    The big difference is however that the services where iPhone utilization is high are those where users have to pay something. Most (if not all) of the ad impressions in apps are for free apps. So ad consumption scales with possession. But non-free services don't. This data seems to support the hypothesis that Android users are disproportionately less willing to spend money (note that the data does not say that users don't have money, but simply that they are not spending it). The other data which backs this hypothesis is that paid app sales on Android trail quite far behind the rate of purchase on iPhone. That could be due to payment problems in the Android marketplace but this data shows that there is some other effect as well.

    Why is this important?

    We can argue that Android is a low end product and that it disrupts and that this is consistent with that positioning. However it also indicates that the value is not in that ecosystem. And ecosystems are what sustain a platform in the long term. This debate will continue but I am reminded of other platforms which had similar patterns.

    Both the Blackberry and Symbian had high possession (in terms of share) with very low utilization. There were lots of surveys which showed that browsing, app downloads and "monetization" of services after the sale of the handset were low. Much was written about it being due to poor experiences. But learned observers today insist that the experience on Android is as good as on the iPhone.

    So why is there less economic participation from Android users? It's not just about these proxy services, but all manner of activities which enrich an ecosystem. Possession without utilization implies a product that does not do its job. Its features are not being absorbed. Why would that be?


  9. Subscribe to Asymco One for full access to our research.

  10. The tell-tale signs suggesting a platform's demise

    Research · 74 comments

    In the post on OS turning circles, I used the concept of a radius of turning as an analogy for agility. One problem with the analogy is that turning in circles implies a return to a starting point or at least a closing of the loop. The idea is that there is lifecycle repetition. However, in reality, this does not apply to the world of operating systems.

    An OS, as a platform, usually has a finite life. It is born, grows and usually reaches a point where it is no longer supported. Sometimes, a new platform is born to take its place from the original owner but more often a replacement comes from a new challenger company.

    So rather than circles, the analogy of OS lifetimes may be more accurate.

    If we do think of platforms as finite, then the natural question is what causes an end? We need to look for patterns which may indicate when a platform is reaching end of life.

    The difference in this analysis is that the measure of "age" of a platform I use is not time per se but versioning. The logic is that each major version is a meaningful and significant improvement in a platform which needs to be delineated, marketed and celebrated. It embodies the business logic as well as the engineering logic of the platform custodian.

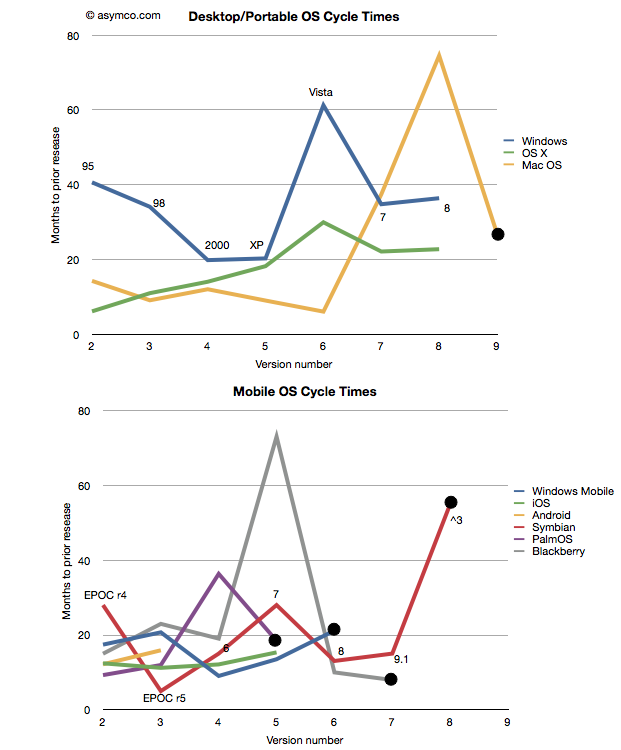
    Taking the data from the last post I added a few more platforms: Symbian[1], PalmOS and Blackberry OS[2] to seek out patterns. I also separated the desktop/portable OS's from Mobile OS's and plotted these version-demarcated lifespans.

    One thing to observe is that the scales of the two charts are comparable. There are examples of short- and long-term version updates and the number of iterations (lifespan) can be similar. I noted also that there were several platforms which have reached end-of-life[3][4]. Those platforms have a big black dot at the end of the line.

    That leads to another observation. The end of a platform seems to be indicated not by simple age (the shortest lived was six years and the longest lived was 16) nor by the number of versions (PalmOS lived for five while MacOS lived for nine). Instead the end of life is most clearly visible as a lengthening of the development cycle.

    Note that each platform that ended was preceded by a spike into the vertical--a significant delay in the release of a version. The data is one thing, but it's anecdotally supported by observation. Industry observers note that delays in improving the product are symptoms of some fundamental architectural or marketing roadblock. In the case of Mac OS, Apple struggled to bring modernity to its "Classic" OS. It need memory management, more reliability and a better file system to support the move to networking and media hub use that defined the consumer expectations of a PC.

    There was a change in the basis of competition, away from pure productivity and more toward entertainment that turned out to be more demanding in new ways. Apple had to move away from Mac OS and lost time with its internal Copland effort before punting with NextSTEP. Similar transitions are visible with Palm (from PalmOS to WebOS), Microsoft (from Windows Mobile to Windows Phone) and Nokia (from Symbian to MeeGo) and RIM (from Blackberry OS to QNX). In fact, survival of a transition is relatively rare and never without significant pain and loss of value or share.

    This is also understandable through the lens of disruption theory. As a product reached the point of being good enough, "breakthroughs" are harder to come by. Engineers and marketers struggle to push the product into increasingly rarefied strata of performance. The old architecture does not fit the new demands but it's crammed into them anyway. This last big push is then followed by a stall and ultimate demise. Meanwhile, an entrant gains lift in the rich atmosphere of new bases of competition with an architecture that's built specifically for it. The process then repeats.

    And so the charts relate the same story of sustaining improvements followed by inevitable last gasps that Clayton Christensen first illustrated[5] in The Innovator's Dilemma. A book that came out just as the first mobile platforms cataloged in these charts began their ascent.

    ---

    Notes:

    1. Versions of Symbian do not match easily to integer values. I used the versions as recorded by pdadb.net. The sequence is as follows: EPOC Release 3: "1", Release 4: "2", Release 5: "3", Symbian OS 6.0: "4", OS 7.0: "5",  OS 8.0: "6", OS 9.1: "7" (9.0 was deproductized), Symbian ^3: "8". Symbian ^4 has been cancelled. These original version numbers are noted on the chart.
    2. The times recorded are for "general availability of product" which in the case of mobile OS's means the time when a device using that OS was released.


      Symbian
      PalmOS
      Blackberry
      Jun-97
      Jun-96
      Jan-99
      Oct-99
      Mar-97
      Apr-00
      Mar-00
      Mar-98
      Mar-02
      Jun-01
      Mar-01
      Oct-03
      Oct-03
      Oct-02
      Nov-09
      Nov-04
      Sep-10
      Feb-06
      May-11
      Sep-10
    3. End of life is defined as the last version generally available. In some cases (e.g. PalmOS 6) newer versions are built but they may not be released into a working complete product.
    4. Windows Mobile is treated differently here than in the previous post. I chose to declare it EOL after version 6 and consider Windows Phone as a separate OS. This is because the name change is indicative of a break with the past. As before, I defer decisions about continuity to the developers and/or marketers who choose the naming conventions.
    5. See slides 3 and 5 here
  11. Subscribe to Asymco One for full access to our research.

  12. OS turning circles: Questioning Windows' maneuverability

    Podcast · 137 comments

    [Updated with Mac OS versions. See footnote 3.]

    I'm glad Windows 8 is named the way it is. With Windows 7 Microsoft went to a numbering system which is much more rational than the mixed naming of the past. The number 8 actually corresponds to the actual sequential number of major versions of Windows released to date.

    Windows proper actually did not start with what was called "Windows 1.0". Windows actually started in April 1992 when Windows 3.1 was released. It was the first Windows which was an operating environment onto itself, apart from DOS. It was followed by Windows 95 (which we can call "2"), Windows 98 ("3"), Windows 2000 ("4"), Windows XP ("5"), Windows Vista ("6"), Windows 7 and now Windows 8.

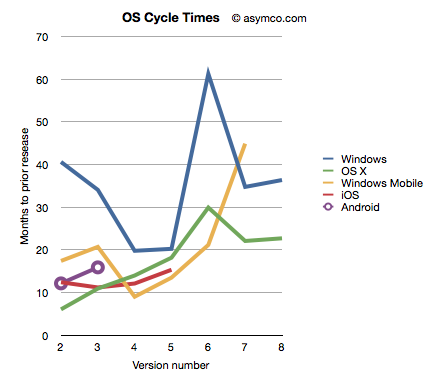
    Given this nomenclature and the dates of general availability of said versions, we can derive a measure of the frequency of upgrades. For example Windows "2" followed about 41 months after "1" and "3" took 34 months after "2". If we continue this for all the versions, and assume "8" will launch by October next year, we can plot the cycle times of new Windows versions.

    To make the story more interesting I added the same data for other OS platforms. OS X, iOS and Android have version numbers which correspond to the sequential order in which they were released. I am assuming that the numbering system (1.0, 2.0, 3.0 etc.) are meaningful and that major releases are given a new integer value.[1]

    I also added Windows Mobile which suffered from the same confused numbering that Windows suffered until the current Windows Phone 7. To create a map to integer values I used the following: Pocket PC 2000 is "1", Pocket PC 2002 is "2", WinMo 2003 is "3", WinMo 2003 SE is "4", WinMo 5 is "5", WinMo 6 is "6" and Windows Phone 7 is "7". There is no clarity when and what Windows Phone 8 will be so that is left off the chart.

    The chart above does give a clue that Windows is a bit slower (more months between releases) than alternatives. However, the point I want to convey is that this cycle time can be a strategic advantage. A faster upgrade cycle means more rapid adoption of improvements, not to mention more revenues. Rather than a line chart, the better way to visualize it is as a turning circle.

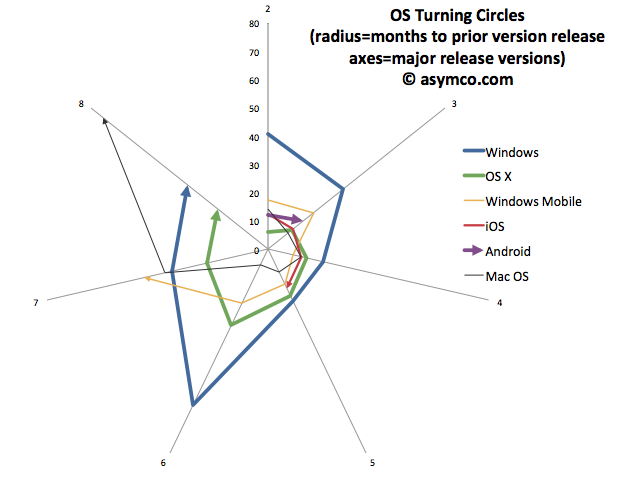
    The analogy is from aerial combat where a plane that can "turn inside" an opponent can get into a firing position. The tightness of turning circles also means that a competitor can iterate more quickly and thus move up the trajectory of improvements necessary to remain competitive more rapidly. To that end, I re-plotted the data above with radial axes.

    The chart clearly shows how among desktops, OS X has been tighter than Windows[3]. Furthermore, mobile OS's have been, typically, more agile than desktop OS's. The exception being Windows Mobile which had significant architectural and business model challenges. It will be interesting to watch the radius of Android. So far it seems to be tight, but as tablet functionality has been added, the speed of change has slowed slightly.

    However, the big contrast is between mobile and desktop. Microsoft tries with Windows 8 to merge the two. But these are different ecosystems. Buyers, OEMs, users, all have different behavioral patterns (jobs-to-be-done) for mobile OS vs. desktop/portables. Will the cycle time for Windows 9 and Windows 10 tighten up? Can Microsoft operate its OS division at this new cycle time?

    What is even more bad news is that the most important customers for Microsoft, enterprises, actually upgrade every other version. The Windows "radius" is nominally averaging about 35 months but large account adoption is closer to 60 months.

    The contrast is then striking: Consumerized devices with over-the-air updates on a 12 month cycle are five times more agile than a traditional corporate Windows desktop. Another way to look at this is that for every change in a corporate desktop environment, the average user will change their device experience five times. Although Microsoft might find comfort in Enterprises' leisurely pace of change[2], those are the wrong customers to keep happy going forward.

    The implications are left as an exercise to the reader, but I would argue that along with the asymmetry in business model around pricing that I highlighted in the last Critical Path podcast, Microsoft has a significant operational asymmetry with devices as a new class of computers.

    ---

    Notes:

    1. The dates of general availability of various versions of operating systems.


      Version
      Windows
      OS X
      Windows Mobile
      iOS
      Android
      1
      4/6/92
      3/24/01
      4/19/00
      6/29/07
      10/21/08
      2
      8/24/95
      9/25/01
      10/1/01
      7/11/08
      10/26/09
      3
      6/25/98
      8/24/02
      6/23/03
      6/17/09
      2/22/11
      4
      2/17/00
      10/24/03
      3/24/04
      6/21/10
      5
      10/25/01
      4/29/05
      5/9/05
      10/1/11
      6
      11/30/06
      10/26/07
      2/12/07
      7
      10/22/09
      8/28/09
      11/8/10
      8
      11/1/12
      7/20/11
       
    2. While at Nokia's Enterprise Solutions I was witness to this difference between the cycle time of devices and the pace of adoption of Enterprises. The fundamental disconnect was that the sales cycle for a "solution" was longer than the shelf life of a device upon which that solution was predicated. Needless to say, Nokia Enterprise Solutions did not last long. Nor do we see today any significant Enterprise-focused mobile device businesses (RIM itself moved to consumerize its products years ago.)
    3. I added Mac OS data to the second chart to also illustrate that no company is immune from spinning out of control. Mac OS clearly went spun out after version 6 with increasing delays leading to its demise and replacement. You can also note that its replacement (OS X) was able to straighten-up and fly right. The lesson may be perhaps that ditching and starting over is a viable option.
  13. Subscribe to Asymco One for full access to our podcasts.

  14. RIM and the lamentation of the analyst

    Research · 83 comments

    RIM shipped 10.6 million Blackberries and 200,000 PlayBooks in the last quarter. Management noted that their sell-through was significantly higher for Blackberry (13.7 million) but seems to be very weak for PlayBook as the prior quarter saw 500k units shipped. Additional PlayBook units this quarter probably mostly went into new channels in Asia and there were no additional sales into North America or Europe.

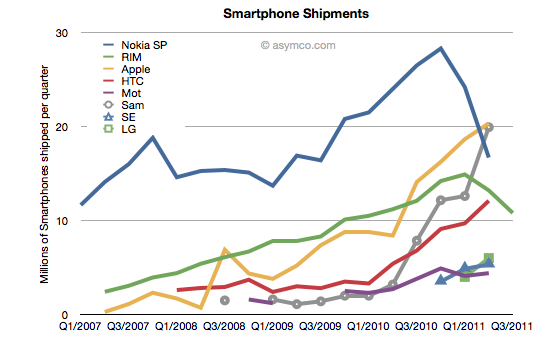
    The figures for units are very poor. How poor depends on the frame of reference. Consider the shipment chart below:

    In terms of the competition, 10.6 million units is less than half what Apple or Samsung sold in its prior quarter. It's also less than what HTC sold. RIM's volume rank will likely go to fifth place as a smartphone vendor.

    In terms of its performance relative to its own history, the Blackberry volume dropped by 11% year-on-year and 18% sequentially. This is the second quarter that shipments shrank.

    In terms of market share, we'll have to wait for the competitor data over the next six weeks but the market has been growing at an average of 77% for four quarters so any continuation of this trend would imply RIM's share dropping to single digits.

    Finally, the biggest shock has been the decline in profitability. It seems that operating margin dropped from 21% to 13%. The company did incur some one-time charges for recent layoffs, but even without that charge, the margins would be around 16%. This is most alarming. The reason for such drops is that as volumes decrease fixed costs don't decrease as rapidly or at all. The company still needs to keep sales, administration and engineering staff around and they become a larger part of the operating expenses (vs. the component costs which vary with volume of goods sold).

    This effect is well understood by financial analysts and the stock price shows it with a huge drop.

    But stepping back to look at the picture above, there is a clear turning point in the company. You can see the elbow in the curve for volumes whose effect is felt so deeply. What's curious is why the pivot occurred when it did. We can point the finger to competition as the cause. But why was there no effect in the company's fortunes when the competition actually emerged. It's been years since the iPhone and even Android entered the market. Yet we see an impact on Nokia and RIM individually at apparently arbitrary points of time.

    This is the lament of the analyst: you can clearly and accurately state what will happen but when remains a mystery. It's the elasticity between obvious causes and their effects that makes this an inexact science or not a science at all. In retrospect, you can say that Nokia's pivot was triggered by its public execution of Symbian, but that assumes that it was preventable--which we know is not the case. But what caused RIM's change of growth, exactly? Why did it happen this past spring? Why didn't the company volumes begin to decline as iPhone and Android boomed in 2009 or 2010? For quite some time RIM seemed immune to competitive pressure. We all were made fools as we called its imminent demise. Then, as Steve Jobs would say, boom!

    ---

    Footnote:

    Piecing together RIM's performance is becoming more difficult each quarter. The data being presented is increasingly obfuscated by irrelevant detail while major information is omitted. This last management presentation was full of holes, namely:

    • We have no idea of device pricing. Valiant efforts have to be made to piece together that aspect of the business. Matt Richman does a good job but it still requires some guesswork regarding PlayBook pricing to back out Blackberry pricing.
    • Management detailed where Blackberries were selling-out but only detailed sell-in for the PlayBook. Obvious spin.
    • They are cherry picking the data they present and each quarter it's a different story making pattern recognition impossible.

    This leads to an erosion of trust. Observers are faced with the problem of increasingly guessing what is happening each quarter. For instance, regarding pricing I prefer to include service revenues in the analysis of device sales because device+service is what is being bought by the user and vendors which can offer services as part of the device get a justifiably higher value for the product--value that I think needs to be considered as advantageous. Nokia and Apple also account for services (though not apps) as part of device sales and it makes it more convenient to compare these businesses.

    Given RIM's smokescreen, this quarter I decided to stop trying to guess Blackberry pricing and used Operating Income/Units sold as the average selling price.


  15. Subscribe to Asymco One for full access to our research.

  16. Mobile Impossible

    Research · 25 comments

    In yesterday's post about the "biggest mobile loser" I covered the exodus of users from non-smart devices in the US and EU5. I also said that what happens in those regions tends to happen in other regions with a time shift. In some regions it happens quicker but in most it happens more slowly.

    But can we be sure that there isn't vast non-smartphone growth in other regions? Well, no, we can't be sure. At least not without access to reliable data.

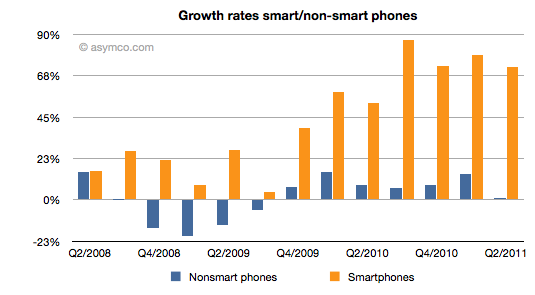
    But what we can track is the overall non-smart phone market and compare it to the smartphone market. Here are the growth rates of the two sub-markets:

    The difference is plain to see. We can also note that the non-smart market may be heading into a contraction--something noted by some analysts close to the market--but no real sign of that happening in smartphones.

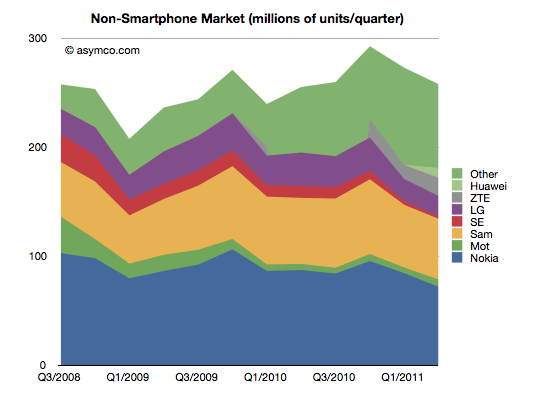
    Beside growth, we can also see actuals and the split of various vendors' volumes in the market.

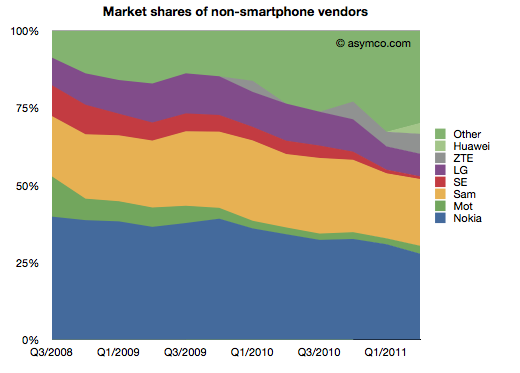
    It's also clear that the top line has not moved much in the last few years. Next, the shares of the vendors.

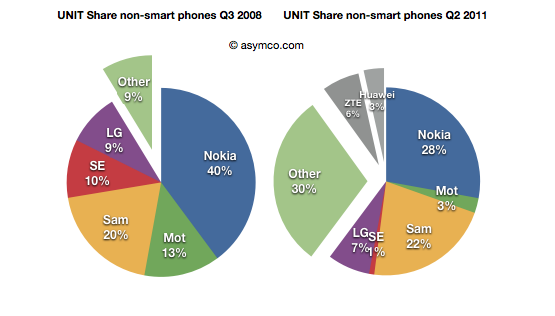
    Finally, the before-and-after share pies.

    We can see that the growth story, if there is one, is coming from low-end entrants. In late 2008 the main brands had 90% share. They now have about 60% (in a flat market.) The growth is all from "Other".

    What seems to be happening is that buyers in mature markets are swapping (or upgrading) from non-smart to smart and adopting new smartphone brands. At the same time, new users in emerging markets are increasingly adopting new non-smartphone brands.

    So the question for the incumbent vendors is extremely important: Facing them are low-end and smartphone entrants engaged in a pincer movement, with obvious success; can the old brands survive?

    The answer, as always, depends on whether the competition is symmetric or not. Low end competitors are usually structured around low cost structures. High-end competitors are exploiting new markets and new business models. For an incumbent to survive and fight on both fronts they'd have to adopt both of these models for themselves, simultaneously and quickly.

    We can see that Sony-Ericsson and Motorola (Google) have thrown in the towel on the low end. The question of dual-front strategy is mainly relevant only for Nokia, Samsung and LG. LG is on the ropes and may actually be ready to exit the market so that really means Nokia and Samsung. Nokia has signaled continuing interest in the non-smart market (citing "the next billion users"). Samsung also seems to be hanging in there. Can they do it?

    I cannot stress how difficult this is or how rarely it has been achieved. The two approaches are if not opposites then at least orthogonal. It's like Mission Impossible. You can't be a low cost global vendor while investing in R&D for differentiated platform-based devices. These are shaping up to be businesses requiring completely different skill sets. Few have the ability to host these skills inside one company. I can think only of one example.

  17. Subscribe to Asymco One for full access to our research.

  18. Subscribe to Asymco One for full access to our podcasts.

  19. Biggest mobile loser? The non-smart phone

    Research · 19 comments

    Yesterday comScore published survey results for EU5 (France, Germany, Italy, Spain, UK) on smartphone use and installed base. The headline is very similar to what would be written about the US: Android had phenomenal growth over the last twelve months. I also noted that the apparent growth of Google (16.2% share change) seemed to be matched by an apparent decline of Symbian (-16.1% share change.) However the reading of the data is not so simple.

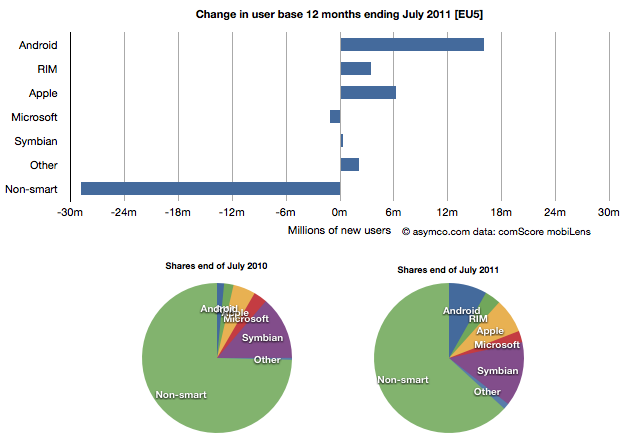
    In order to understand what has happened to usage, it's much more valuable to look at consumption and the actual number of users rather than change in share of a subset of the market. Consider the following charts:

    The bar chart shows that three platforms gained users in the last year (ending July) and that there were negligible losses in users by others. Negligible except for non-smart phones. A remarkable 29 million users moved from non-smart phones to smartphones. Those switchers switched into Android (16 million), iPhones (6.3 million) and RIM (3.4 million). Symbian even gained about 330k users. Microsoft lost about 1 million but its platform has not been actively promoted in that time.

    When seen as a pie chart, you can see how the usage shifted from non-smart to smart even more clearly. It does not appear that Android took share from Symbian at all. Android took share from non-smartphones. The table in the link from comScore leads one to conclude otherwise.

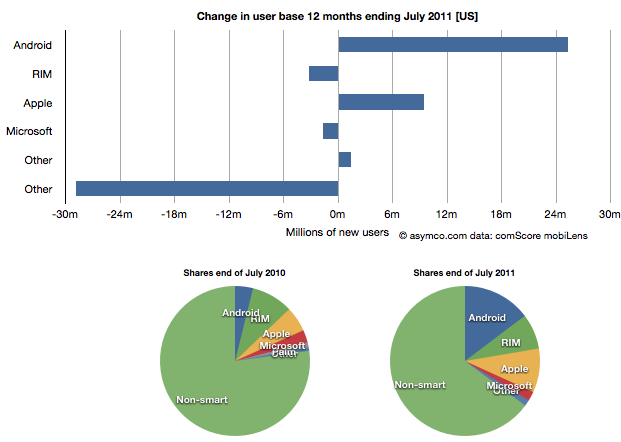
    I took the same approach to look at the US data (also from comScore). It shows a similar pattern.

    In the US, RIM was a net usage loser but its losses also paled to the losses of non-smart devices. In comparing with EU5 the pattern is very similar.

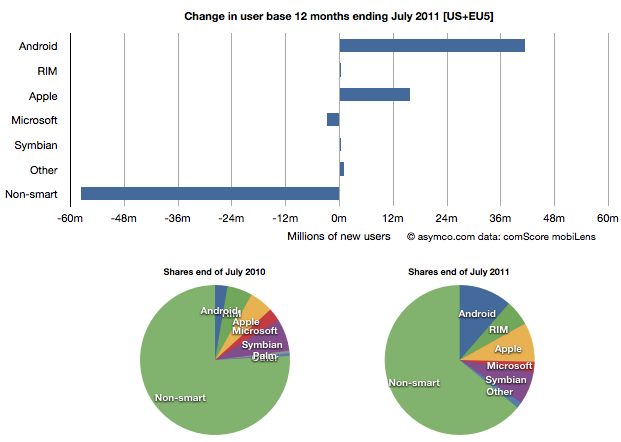
    I then combined the EU5 and US data and provided a view into the combined markets (note scale change from previous two charts.)

    This shows the change in platform phones more or less being from non-smart to Android and iPhones. The total population is 470 million people--not insignificant. The total number of non-smart devices abandoned is nearly 60 million in one year, which equals the total number of new smartphone users. That's 12% of most of the developed world switching in one year. If this keeps up, the "tipping point" when smartphones will outnumber non-smart phones in use in these large markets will be in another year.

    In terms of sales rate, the tipping point has already happened. Sales of smartphones crossed over in the US and Europe several quarters ago (November 2010 in EU5) and the trend is accelerating. Furthermore, if patterns of mobile technology adoption repeat as they have for the last two decades, emerging markets will follow in two to three years.

    This tipping point observation has been repeated on this site a number of times when reflecting on the data in the US. Now it's becoming clear that the same pattern has been underway in Europe as well.

    The big picture from the survey data is just how vast the demand for smartphones is. Some platforms are benefiting more than others in terms of share of growth, but the biggest mobile loser is clearly the non-smart phone. Not only is it an unprofitable product for almost every vendor, it is also being increasingly shunned by buyers.

    At the same time, at 450 million users we're still only looking at less than 10% of the market. As this pattern spreads globally the platform install bases will be measured in the billions of users.