Asymco

Asymmetric Intelligence

Latest from Asymco

  1. How did I get the iPhone number so wrong?

    Research · 64 comments

    Here were my predictions for the third fiscal (second calendar) quarter from April 25th.

    Estimates for Apple’s third fiscal quarter (ending June) | asymco

    Later in the quarter I updated them for submission to Philip Elmer-Dewitt's blog at Fortune. The original and updated figures are shown in the following table (with actuals).
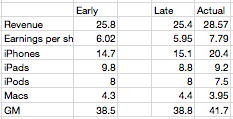
    The changes were not significant except in a reduction of iPads. Three items were better in the early call and three were better in the late with one item equal. Using a simple method for scoring the results I gave myself the following report card:
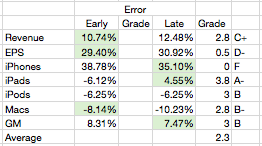
     

    As the Revenue and EPS figures are dependent on the other line items, the most significant error is clearly the iPhone where the error was over 30% (and hence deserves an F). The other figures were not very close either  so the overall grade point average is a very mediocre C (2.3).

    So, as in previous quarters, nailing the iPhone number is everything. Having failed to guess correctly, the whole performance fell apart.

    So how did I manage to get the iPhone number so wrong?

    My forecasts depend on a few theories:

    1. Overall production capacity is increasing at approximately 100%/yr.
    2. There is significant seasonality due to production ramps as the product is updated on a yearly cycle. These cycles are tuned to reach maximum throughput during the US holiday period. I discussed this theory here.
    3. Demand is practically unlimited and is throttled by both production schedule and distribution agreements

    I successfully applied these theories to the iPhone for over three years and it has always yielded very good (above average at least) results. However, when we reach a point of failure we need forensically consider where the theories failed.

    What I suspect happened is that the second theory no longer holds. What I expected was that as the iPhone 4 was reaching the end of its cycle, growth would moderate (as it did last year with the 3GS and we ended up with 61% growth into the last quarter). The reason growth would moderate was that Apple slowed production of the old model in order to switch out to the new model--we saw the same thing happen with the slowdown in iPad 1 and transition to iPad 2.

    Instead, what Apple did this year was open the taps on production of the iPhone 4 as it extended its lifetime beyond the traditional 12 months. In other words, the pipeline was not "drained" ahead of a new ramp. Distribution was also boosted with a burst of new operator deals which actually enlarged the pipeline.

    So we are witnessing a pivotal moment in the product's strategy. By slightly lifting off the gas in terms of product cycle, Apple actually set the iPhone loose. The imposition of a yearly cycle on the product coupled with unlimited demand caused it to be artificially constrained.

    So I can only reach a conclusion dripping with irony: by stepping off the gas the product actually accelerated.

    This phenomenon will allow the company to unleash a wave of unprecedented growth which might claim another theory as victim. Namely, is the limit of 100% growth about to be breached?

    ----

    Footnote:

    A theory approach to forecasting means that you have to stay true to the theory even if there is anecdotal evidence that may suggest you are wrong. If you bend to the anecdotes then you will not learn from failure. If you stick with the theory and ask where it went wrong, you will build a better theory.

  2. Subscribe to Asymco One for full access to our research.

  3. Apple's growth scorecard for second quarter 2011

    Research · 83 comments

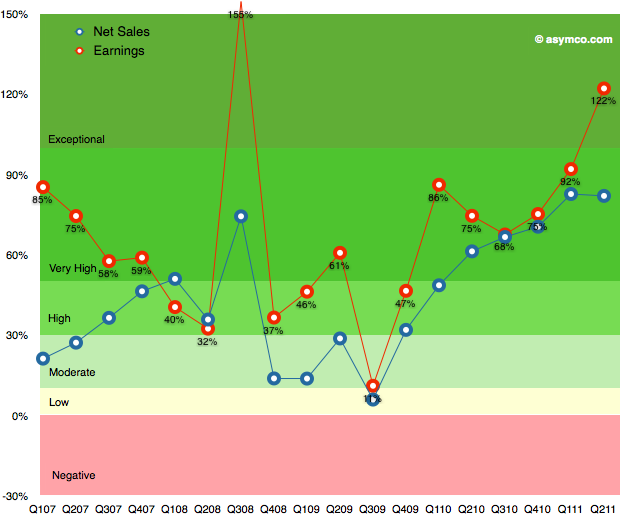
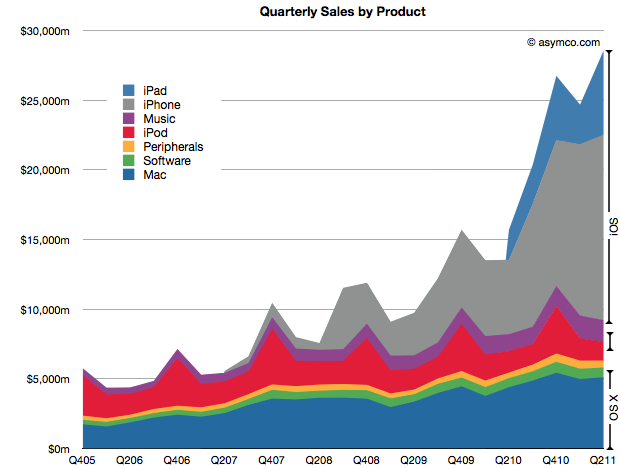
    Apple's second calendar quarter was a record breaking performance. This is surprising because it shows super-seasonal performance. For as long as I can remember the fourth calendar quarter (i.e. holiday) was always the strongest quarter, by a large margin. This quarter was higher than the last holiday quarter. A glance at the following chart shows the anomalous performance:

    iOS products make up 71% of sales (and at least 78% of profits) which makes the following growth scorecard a bit moot.

    The growth in iPhone sales of 150% is hard to understand given the previous product cycle, but more about this later. The 122% growth in profits is (nearly) unprecedented. The growth in Q3 2008 was due to the launch of the iPhone 3GS and since there was no iPhone launch this quarter the growth shatters existing assumptions about the franchise.

    The pattern in the table above is shown in the following chart:

    This performance needs to be digested and contemplated a bit longer but I will make one early conclusion: One of the most common themes during the last year was that Apple's growth rate was unsustainable. The theory cited was one of the "law of large numbers". Apple's performance shows it to be nonsense.

    Instead of decelerating, Apple's growth is accelerating.


  4. Subscribe to Asymco One for full access to our research.

  5. A new way to value Apple

    Research · 38 comments

    Almost all valuation models for Apple assume it's a hardware company. The modeling algorithm for hardware is simple:

    • For each year in near future
    • For each product line
    • Compute contribution
    • Determine company value by summing contributions and multiplying by a P/E ratio

    The major difficulty is in predicting the growth of each product line. This is difficult because buyers can be fickle. Companies employs all sorts of tools in order to secure repeat customers but if switching costs are low, the company can crash in value. For this reason, analysts pick various ways to predict device  sales. Some choose to index each product on production (channel checks), demand (customer surveys,)  or even on a top-down share of total (market research on growth of whole market and assumptions of share).

    Although simple and convenient, this model does not probably match the way Apple is managed. The company does not build hardware products to sell and forget. It builds platforms which are best seen as sources of recurring revenues. Users are incentivized to continue buying devices. iCloud, iTunes and other Apple properties are expressly designed to that goal--and they are not cheap to run. So, the company must see the world through a different set of lenses than the default model shown above.

    To think about the business like they do, we need to put the data through a similar set of lenses. I began with a modest proposal last month to value each user as a source of recurring revenue. Now it's time to expand on this method.

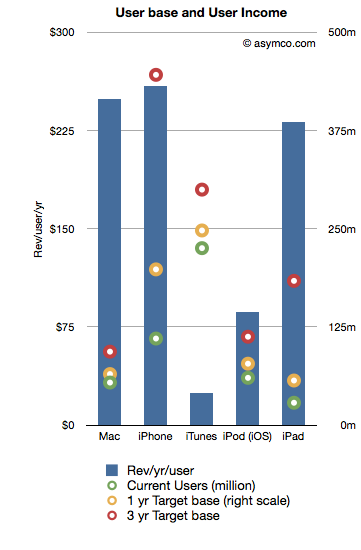
    The following chart shows the recurring revenues per user by product and the current and possible future size of user bases.[2]

    Revenues/yr/user are bars with the left axis and the User bases are various colored circles indexed with the right axis.

    The assumptions that went into the data are as follows:

    1. Device life span is as per previous article linked above
    2. User base growth for 1 year is: Mac 20%, iPhone 80%, iTunes 10%, iPod 30%, iPad 100%
    3. User base growth for 2nd and 3rd years (recurring): Mac 20%, iPhone 50%, iTunes 10%, iPod 20%, iPad 80%.
    4. The Revenue per user is assumed constant

    Note that the user base growth figures are lower than the product growth levels seen historically. Obviously, the model is highly sensitive to these growth assumptions so they need to be scrutinized and tested rigorously.

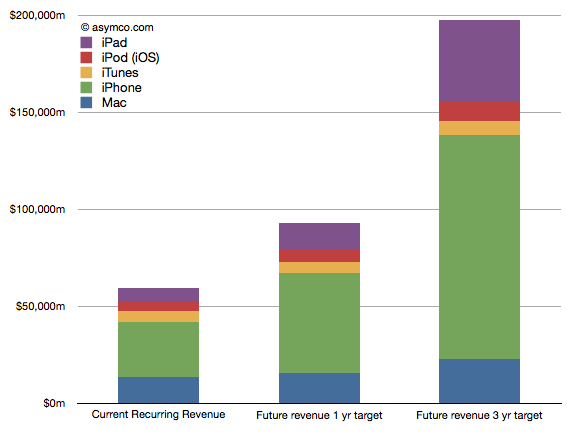
    Nevertheless, as a straw-man proposal,  the recurring revenues for all these products[1] is shown in the following chart:

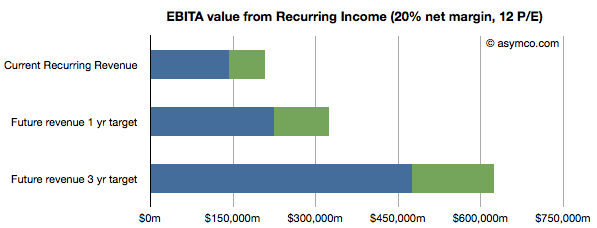
    Once the income is estimated, we can take that value and assume a profit margin (net) and then multiply the earnings by a multiple. Using a 20% net margin and 12x P/E yields the following chart.

    (I added an assumed level of cash in green.)

    This model would imply that the company today could be valued at $208 billion on the basis of its installed base alone. That value would be about $323 billion in one year and $620 billion in three years. Dividing by the number of shares outstanding (935m this year increasing at 2% a year) yields a share price of $222, $339 and $629 by mid 2014.

    These values can be considered "lower bounds" on valuation since they assume income from previously secured customers. The speculative part of investment would be based on what the future bases will look like (so, for example, if one believes these assumptions, the $629 figure could be considered a target to be discounted to today).

    ---

    Notes:

    1. Excludes Software, Peripherals, non-iOS devices, and any other service revenue.
    2. Compare this char to social media companies (MIT Technology Review)
  6. Subscribe to Asymco One for full access to our research.

  7. The Frontiers of Platform Adoption

    Research · 46 comments

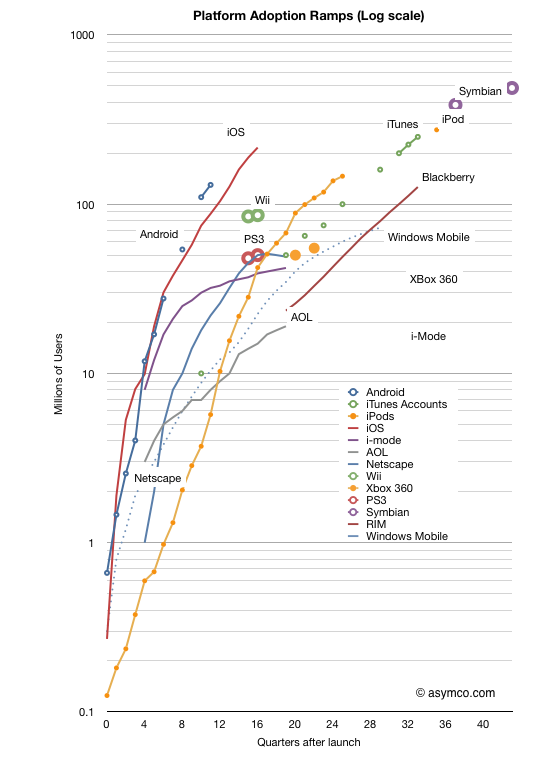
    In the last two weeks we received two more data points which allow an update to the "race to a billion" platform growth trajectories. Android reached 130 million active users and iOS reached 200 million.

    The updated picture looks like this:

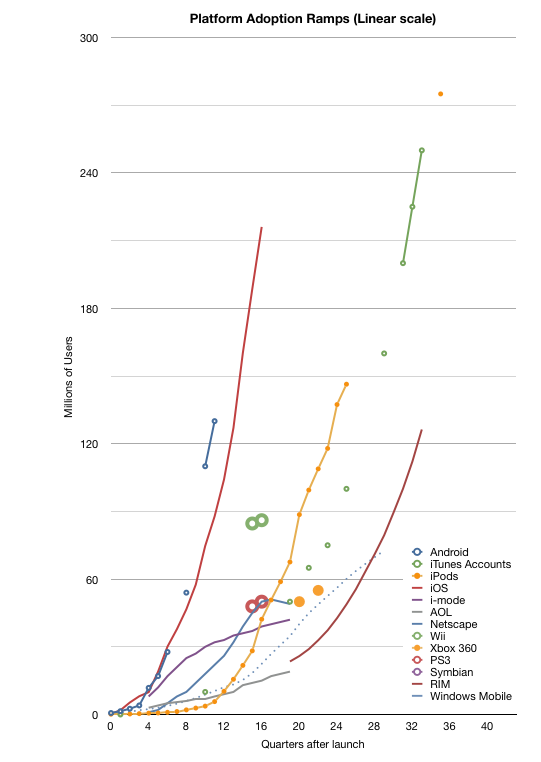
    Note again that this is a log scale graph. Every major horizontal gridline is an order of magnitude (10x) larger than the one below. It's a busy graph. The linear version follows:

    For the detail-minded, it makes for some interesting comparisons, but I want to create a more compelling visualization. One where each platform can be judged for potential and impact at a glance.

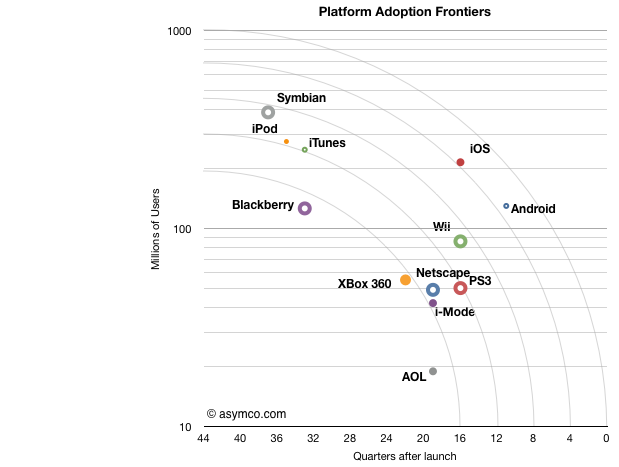
    To that end I came up with something I call the platform "adoption frontier" view. Based loosely on the Pareto efficiency concept the chart is reduced to show the latest known figure of (users,time) and overlay concentric arcs centered on 10 million/10 years and radii of unit years (x-axis).

    Note that the time axis is reversed from the chart above. This was to allow the best performers to be shown at the upper-right of the chart.

    The way to read this is as follows:

    • Each platform is represented by a point which shows its currently known peak in users and time to reach that number of users.[1]
    • The arcs (frontiers) represent possible performance classes.
    • The lowest frontier spans "four years to reach 10 million" to "10 years to reach 200 million". The highest frontier spans "<1 year to reach 10 million users" to "10 years to reach 1 billion users". Each frontier can be read in a similar way.
    • The main assumption is that a platform can reach more users but it takes time. Better performance is when a platform moves toward a frontier further from the origin.[2]
    • I chose the limits of the chart specifically: 10 years is roughly the limit of most platforms[3] in the current cycle time of technology disruption; One billion users is an upper bound set by Windows.

    One thing you can read from the chart is to say that "from a growth point of view, Blackberry is weaker than any of the other platforms." Sitting below the lowest frontier with fewer users than Android which has been in the market for less than a third of the time it seems to be less impressive. It is, however, in a similar band of growth as Xbox 360, which, by some measures, is a success story. So the performance standard is relative.

    One can also see the rough equivalence in growth between iPod and Symbian, both having crossed the second frontier. But iOS and Android are in a different league. They sit alone beyond the fourth frontier. The fifth frontier is the "billion user in a decade" potential and it seems within reach for both.

    What this view also offers is an answer to the question of competitiveness. Although platforms can co-exist and don't necessarily overlap, the question of becoming overwhelmed with "good enough" by widespread low end alternatives looms for the specialized platforms. For example, game consoles look very vulnerable because they simply do not have the potential to cross high frontiers and orders of magnitude of casual gamers (with potential TV connected devices) might orphan the consoles.

    I've also included some platforms that have peaked and faded (AOL and i-Mode and Netscape) as a warning. The frontiers illustrate of how hard it is to reach the upper limits of growth. Each level is exponentially more difficult than the last and achieving it with paying customers is a remarkable story of value creation.

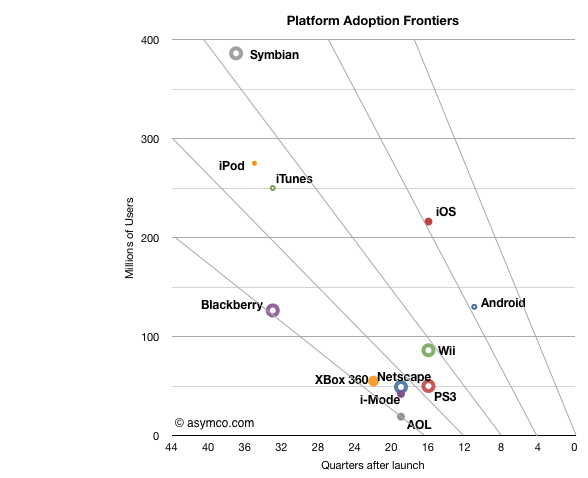
    [UPDATE]

    I add below the frontier chart with a linear vertical axis. Note that the frontier lines are not equivalent to the frontier arcs in terms of coverage.

    ---

    Note:

    1. The data I have is for platforms where users have to pay something to participate. I exclude platforms where users are the only merchandise being sold (i.e. social networks or email provision).
    2. I only include the initial ramps not upgrades. Windows is anomalous because it is so old. During its first decade (1985 to 1995) it reached over 17 million users but placing it on this chart does not do it justice given the growth occurred in its second decade.
    3. See Symbian and Windows Mobile. However again, Windows which is nearly 30 years old, is an exception.


  8. Subscribe to Asymco One for full access to our research.

  9. Is the tablet computer a new PC or post-PC?

    Research · 60 comments

    Steve Ballmer stated and Andy Lees confirmed that Microsoft views iPad and other tablets as "just PCs". From a market measurement point of view Canalys agrees. IDC and Gartner don't, calling the new devices "media tablets."

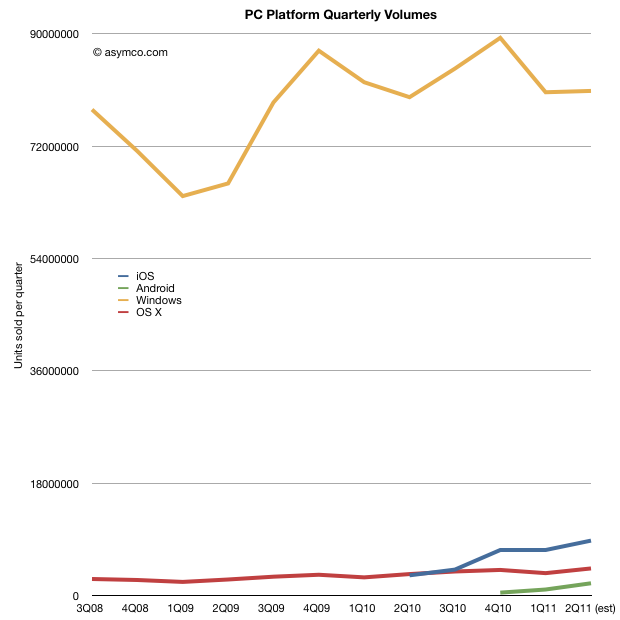
    Before deciding whether tablets belong with PCs in market metrics, it would be interesting to look at what the data shows. When seen as a combined market, the focus should be on platforms. The following chart shows the four main PC+tablet platform volumes since late 2008 [1].

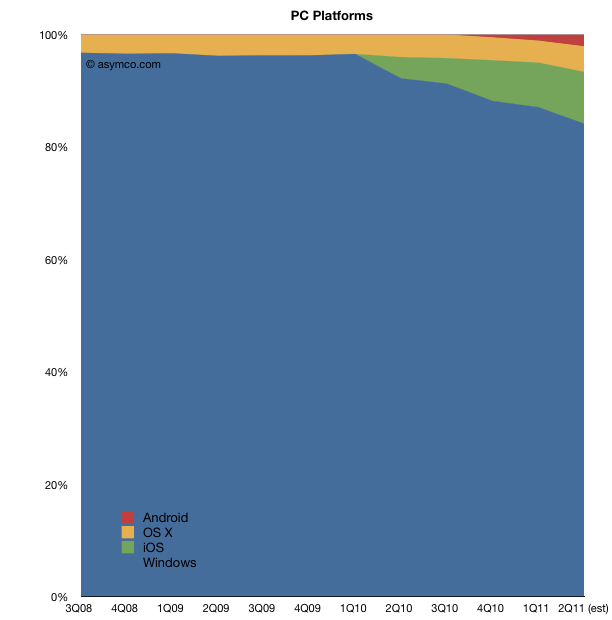
    The second chart shows the same data as share of total market:

    This comparison allows for some fresh observations:

    1. Excluding iPads, Apple is very close to being 5th largest global PC vendor. Global share likely to be above 5%. Including iPads, Apple would be 2nd.
    2. Platform year-on-year growth was Windows: +1.3%, OS X: +26%, iOS: +170%. Android growth cannot yet be measured since Android tablets have not been on the market for more than 1 year.
    3. In Q2 2011 one million more Windows PCs were sold than in Q2 2010. In same time, 903k more OS X PCs and 5.5 million more iPads.
    4. Excluding tablets, nearly 50% of the global PC growth was due to the Mac. Including iPad, Apple was responsible for ~70% of the growth in the PC market in Q2.

    The picture that emerges is that while Windows continues to be dominant with 84% of units sold in the last quarter, the growth belongs to tablets which captured about 90% of it. If Windows remains marginal on tablets, the "PC market" will likely tip away from Microsoft in two years (depending on how quickly Apple can build iPads.)

    Microsoft is making the commitment to move Windows to a tablet form factor but they are doing it while retaining the user interaction model of a desktop. This may or may not work but they are also conceding that a separate experience is also necessary. By rejecting the notion that a mobile OS alone can do the job, they are essentially building a "hybrid" tablet/laptop/desktop product which may be challenging to use but preserve their presence in the form factor.

    Whether Microsoft succeeds or not will depend on whether the new form factor is disruptive in more than user experience. In other words whether this is just a "new PC" or a "post-PC". The argument comes down to business model changes. For example the new model comes with different cycle time of product development (deep, integrated, yearly changes), different ecosystem (apps), different cost structures (high R&D in hardware), vast scale (device economics, components, ramps), and potentially new distribution (operators in the channel mix.)

    Summed up, the real challenge for Microsoft is whether they can keep their business model (selling OS licenses to hardware vendors) as PCs become more device-like. Not only is iOS setting the benchmark for performance but Android is potentially ready to take share if the market turns slightly more modular. Microsoft's differentiation looks to be primarily its legacy of PC software.

    It may also seem that much remains to be discovered in this market but I think the main bets have already been made. The PC market as we know it is in the end game.

    ---

    Notes:

    1. I used Gartner data for overall world-wide PC market and merged it with Mac and iPad data from Apple. Android data is estimated.
  10. Subscribe to Asymco One for full access to our research.

  11. iTunes app total downloads (finally) overtook song downloads

    Research · 29 comments

    It was only a few weeks ago (at WWDC) that we had an update on the app store growth rates. The data was presented here.

    One of the data points from the event was that iTunes hit 15 billion song downloads. Last week we heard that iTunes also hit 15 billion app downloads.

    The milestones were reached within less than a month so it's a fairly safe assumption that apps have overtaken songs. I had originally guessed that the cross-over would take place at 13 billion at the end of 2010.

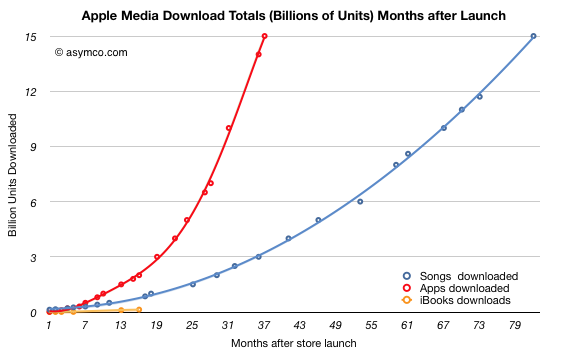
    The actual performance is shown below (total downloads indexed to same starting date):

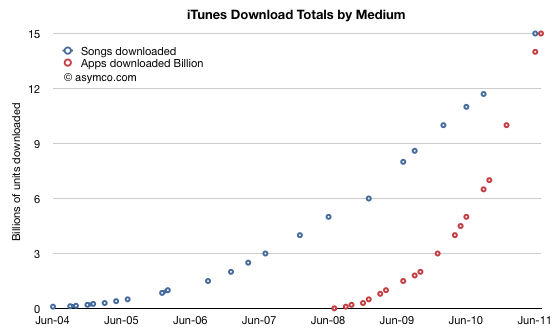
    The 15 billion app threshold was passed within exactly three years while the 15 billion song threshold was passed in six years and 10 months. Shown on the actual time scale, the chart looks as follows:

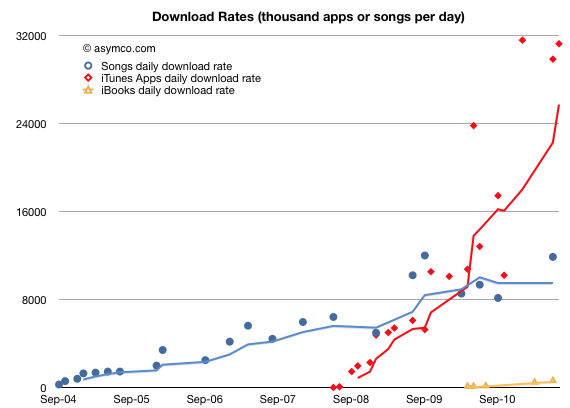
    Download rates for songs had a minor rebound in the last six months.

    The app download rate is now at least 31 million per day while the song download rate is about 12 million per month. Including books (but excluding video content), the App Store in now delivering at least 44 million new content downloads per month.

    My prediction of cross-over was off by seven months. This was due to three factors:

    1. Song downloads increased unexpectedly. There was a rebound in the last six months where daily downloads went from about 8m/day to about 12m/day which is a new high. I had expected download rates to have peaked mid 2010.
    2. App download rates proved to be more volatile than expected. As the last chart above shows, the download rates fluctuate quite a bit. The 4-period trend line is a bit more stable, but there are kinks.
    3. Polynomial curve fitting is always sensitive.

    When dealing with polynomial growth, predictions can be very dangerous. Nevertheless, I think the overall performance of the App Store is phenomenal.


  12. Subscribe to Asymco One for full access to our research.

  13. Measuring Mobile Platform Churn in the US Market

    Research · 48 comments

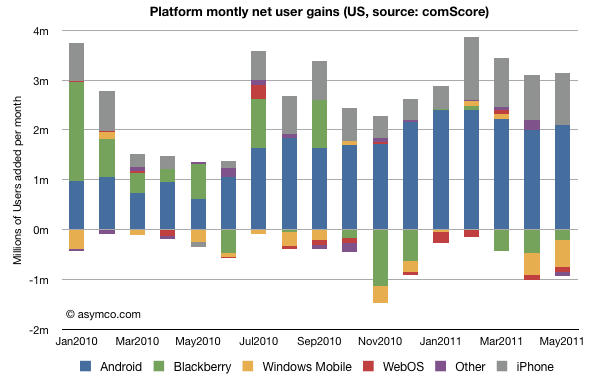
    The following chart shows the net gains in users for the major mobile platforms in the US. The data is derived from comScore's MobiLens report.

    The raw numbers for the last period (ending May) are:

    1. Android gained 2.1 million users
    2. iPhone gained 1.0 million users
    3. WebOS/PalmOS lost 96k users
    4. Blackberry lost 202k users
    5. "Other" lost about 95k users

    The "churn" or percent of smartphone users who switched platforms is 1.22%/month  of the overall users (assuming users to left one platform moved to another rather than to non-smart devices.)

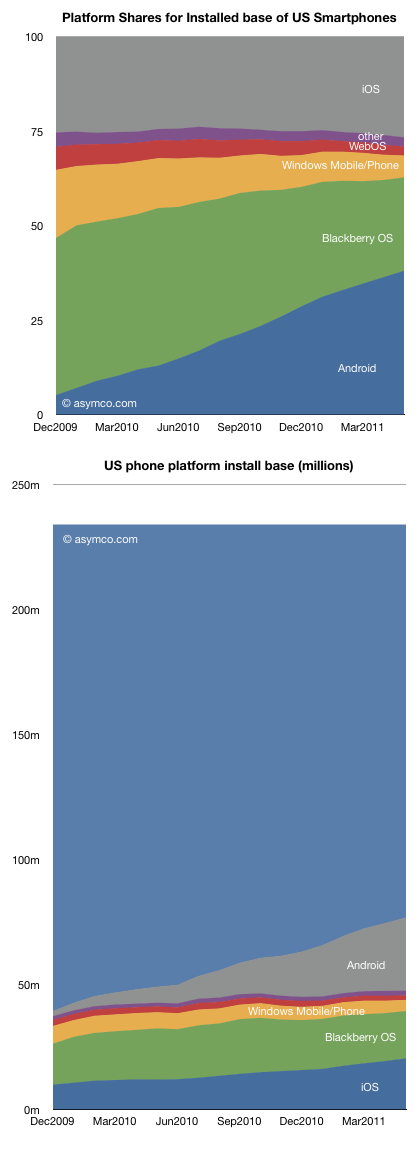
    The share of the platforms and the overall composition of users is shown in the following two charts:

    As usual, caution should be exercised when looking at share (top chart) outside the context of overall growth. The second chart may be more illustrative of what is happening. The light blue area on top is the smartphone non-consuming population.

    Android has been a tremendous accelerant of smartphone adoption while iOS has grown as well but share has not grown significantly. iPhone growth has kept up with market growth. This cannot be said for the other platforms which have been "squeezed" between these two entrants.

    So although the main competition is with non-consuming users and smartphones are winning in general, the loss of users by some of the incumbents is unsettling.

    Microsoft lost just over 2 million users in the US last year while RIM lost a net of 1.5 million. Palm lost about half a million. Contrast this with 8.5 million iPhone additions and 23 million new Android users.

    In particular, Windows Mobile/Phone is down to 5.8 million users (down from 18m in December 2009). With a loss of half a million per month, and share down to 4.5%, a lot is riding on the new platform.

    I've argued that the post-PC era will be a multi-platform era. Although it may seem that the situation in the US is rapidly moving toward a duopoly, it may not end up that way. Note how much non-consumption still exists.

    Note the time frame of the charts is only 18 months. The rapidity with which platforms gain ground could allow for continuing platform churn.

  14. Subscribe to Asymco One for full access to our research.

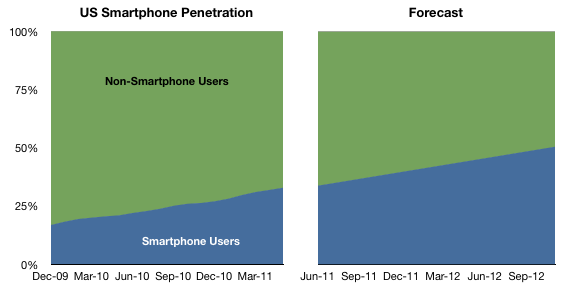
  15. Switching rates for US smartphone users suggest 50% penetration by August 2012

    Research · 21 comments

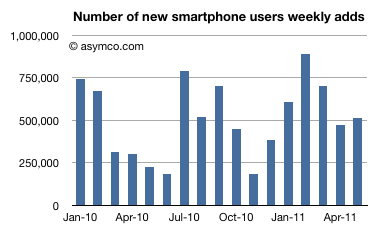
    The latest comScore MobiLens is out and it allows an update to the picture of the US phone using population. Through the three month period ending May 2011, smartphones were in use by 76.8 million or about one in three US phone users. Here are some other highlights:

    • A total of 513k users switched into using a smartphone every week during the period, a rate of switching consistent with the last 17 periods (average of 510k/wk).
    • Penetration of smartphones increased by 940 basis points, slightly higher than the 900 bp increase in the last period but consistent with average.
    • Using a four-period trailing average and linear extrapolation, 50% penetration will be reached by August 2012. "Summer 2012" seems a safe bet as that target has not changed much.

    I've updated the countdown counter (Phone Tipping point at top of right column on this page) to reflect the new date.

    The following charts show the penetration and switching rates.


  16. Subscribe to Asymco One for full access to our research.

  17. Subscribe to Asymco One for full access to our research.

  18. The Post-PC era will be a multi-platform era

    Research · 104 comments

    Windows Phone Marketplace has reached 25,000 apps. That's an impressive figure given that so few devices have actually been sold. Compared with Android which is activating half a million devices per day, Windows Phone seems like a rounding error. According to Gartner, 3.6 million smartphones using a Microsoft mobile OS were sold in the first quarter of 2011, of which 1.6 million were Windows Phone 7. That implies a daily activation rate of 17,500 per day or one WP device for every 28 Android devices.

    And yet the number of apps on Windows Phone is more than 10% of the number of Android apps and Android Apps are about half of iPhone apps. As far as Windows Phone is concerned, apps are being added faster than users. Why is this?

    If we take the point of view that mobile platforms behave like the computing platforms of years gone by (i.e. Windows vs. Mac) then this is inexplicable. Developers should not be bothering with a distant third. This would be like betting on the Amiga in the era of Windows.

    But we're not in the PC era any more. That era had very high software development costs. It had very difficult software distribution channels (retail box sales typically) and very few categories of software with high price points. It was also dominated by institutional buyers which did not give quarter to small vendors. It was also a time when there were orders of magnitude fewer users and even fewer buyers.

    The post-PC era is characterized by an explosion of ideas and application of new talent to software. It's an era of immediate gratification and painless, one click distribution. App production is a cottage industry not something entrusted to only a few experts or those who can raise venture capital. It allows the small to distribute widely and get a shot at stardom. It has been (thankfully) avoided by enterprise buyers. The result is an explosion of apps: well over half a million new apps have been built in three years on three platforms that did not exist three years ago.

    So the very reasons which are driving developers to spread their bets across all and any new platforms should indicate the potential for new platforms and the sustainability of small platforms. The thesis that one dominant platform wins the mobile "war" is naive. The post-PC era will be a multi-platform era. Developers already understand this. Platform vendors know this. It's time to unlearn the lessons of the PC era.

  19. Subscribe to Asymco One for full access to our research.