Asymco

Asymmetric Intelligence

Latest from Asymco

  1. Apparel is next

    Podcast · 81 comments

    If software can be injected into an industry's product it will bend to the will of the software writers.

    This theory expands on Marc Andreessen's observation that "software is eating the world". The evidence is that software, coupled with microprocessors, sensors, batteries and networking becomes applicable to an increasingly larger set of problems to be solved ((Or, put another way, is eligible to be hired to perform an increasingly large set of jobs)). Software has "eaten" large portions of entertainment (e.g. Pixar, iTunes, video games), telecommunications (iPhone, Android, Messaging), various professions including journalism, management and law, and is entering transportation, energy and health care and poised over banking, finance and government.

    As entry happens, asymmetries are enabled and disruption follows. This is the bending to the will of the writers--who tend not to be incumbents. The incumbents can't embrace the changes in business models enabled by software without destroying their core businesses and thus, invariably, they disappear.

    The pattern is easily observed but the speed and timing of it is difficult to predict and hence investment success is not certain. ((Which, ironically, means that the jobs of venture capitalists are still safe. At least until the theory develops to the point where it can predict with more accuracy winners and losers.)) There are many entrants who try and few succeed and there are many incumbents who will survive longer than a prophet can stay hungry.

    Nevertheless, this process of software-induced turnover in wealth--and, incidentally, vast, additional wealth creation--is inevitable.

    But can we predict anything other than timing? For example, can we predict the next industry to succumb to this force?

    There is hope because the last big disruption was predictable. When looking at what caused telecom to become a domino, the pattern of development of hardware pointed the way. It was clear in the late 1990s that computers would become small enough to fit in one hand. The first instances were PDAs (mid-1990s) and once they proved valuable in solving many jobs it was easy to plot their evolution into phones.

    So if we follow the "packaging" constraint, it's clear that computers are becoming small enough to be worn. Many prototypes exist and even small companies can build them.

    All that is needed is a new user interface and a new platform will be born. Once a platform is born, the creativity of millions can be unleashed to expand the problem set that can be solved. The process then repeats.

    So it's obvious that as a computer becomes wearable it will affect the industry that currently is hired to also be worn: apparel.

    Apparel is the word describing every garment, shoe and accessory product sold and amounts to about $1.2 trillion/yr. ((The US is about $331 billion or 28%.)) ((The Telecom industry is slightly larger at about $1.3 trillion)) This amount of money is not spent only to protect the wearer from the elements--any more than the money spent on telecommunications is spent to convey vital information. Most of the value in apparel, perhaps 80%, is spent on solving psychological needs.

    And therein lies the opportunity. As the value is beyond functional, substitution of psychological jobs by new products is a matter of engineering better solutions. Consider the behavior of US teens: anecdotally, their spending on apparel is fading as the solution to feeling good about themselves increasingly relies on a device and service. Already, in this context, apparel retail is in crisis while buying shifts to devices.

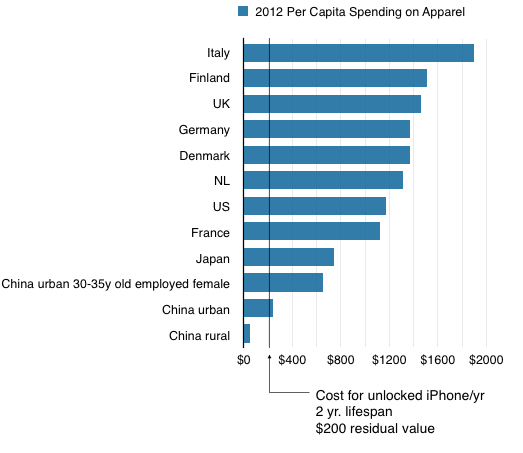
    While looking at the spending, it's also easy to see how much there is to divert from a non-functional to a functional/service bundle:
    Screen Shot 2014-08-28 at 8-28-1.01.40 PM

    In many markets individuals spend more on apparel than on personal technology. And as personal technology increasingly competes for the same jobs to be done, that spending will transfer to the entrants.

    To know who's already planning for this you can follow the trade news on the hiring of talent.
  2. Interview With Horace Dediu: What To Expect When Apple's Expecting

    Research · 24 comments

    My thanks to Eric Jackson for his thought-out questions on Apple. As published in Forbes, here is his Interview With Horace Dediu: What To Expect When Apples Expecting.

    A few excerpts:

    Q: Do you expect to see a sapphire cover on the new iPhone(s)? Is that material significant?

    I expect Sapphire will become a signature feature across many products. I don’t know if they will have capacity to deploy on iPhone this year but on a watch it’s essential. Here’s a clue: if the screen has any curvature, especially around edges, it needs to be sapphire as glass can’t take strain in that shape. The scope of the plant they are building with GT implies that they will have massive volume potential with at least one major iPhone model using the material. It’s a significant material because it allows design freedom in new directions, especially curved (concave) touch surfaces that retain a jewel-like feel. This has Jony Ive all over it.

    Q: Is it fair to conclude now based on the 5C and 5S that Apple will never launch a “cheap iPhone”?

    Oscar Wilde said a cynic is someone who knows the price of everything and the value of nothing. When I see the word “cheap” I never know if it refers to price or value. And even when we talk about price, an iPhone is cheaper than buying all the things it replaces so it’s always been a low end disruptor in my mind. (I saw a tweet with an image of a Radio Shack ad from the 1980s and every single item available on that page is now a part of the iPhone. It would have cost thousands to buy all those things back then–and dollars were worth a lot more.) Furthermore, I think Apple holds a black belt in pricing. They seem to define their position in the market by anchoring certain prices and “owning” them. Given all that I would say that Apple is not going to move their price points much. They will expand the portfolio and offer some iPhones at $300 but they will be older models. The average selling price (ASP) I expect to remain constant on a year-long average.

    Q: In the past, Apple critics were quick to dismiss the new iPad and 5C iPhone as failures upon their introduction.  You never judge. You just report the facts and data.  That said, is there anything about past new Apple products launches that we should look at as a predictor of how a new iWatch might be received by customers?

    When the iPad was imminent the great debate was over whether it would run iOS or OS X. Many imagined a touch-based Mac rather than the “big screen iPod touch”. It was a tough call and one which Microsoft could not and still does not make. Therefore, the interesting question for me with respect to iWatch is: What OS it will run? I will be shocked to the core if it does not run iOS. It is my opinion that making iOS work on it is the entire reason Apple is sweating this segment. They are in it because they are trying to make a platform product with a novel user experience and all the power of an ecosystem run on a wrist. It’s as big a problem as getting a phone-sized device to run a touch UI was in 2007. That is the crucial contribution that Apple is making to this next generation of computing. Now you might ask what users are asking for in this segment. The answer is nothing. Nobody is asking for this. As nobody asked for the iPhone (or the Mac or the iPad). It’s a new computer form factor and how it will be used will be determined by the apps written for it. But it will work and be magical out of the box in version 1. This is in contrast to the single purpose or accessory model of wearables we see to date.

    Q: As a student of disruption, where is Apple most vulnerable to being disrupted?

    Apple is a new market disruptor but much of what is put forward as a threat to it is low-end disruption. I think Apple knows enough about how that happens that it can manage its way around it. The strategy they employ is one of attrition. If you wait long enough a low-end threat tends to wear itself out as it starves of profit and is constantly gnawed-at by alternatives. (You see, if the disruptor cannot manage a profit then they cannot climb up the trajectory to get on top of the incumbent. Being profitable is a key requirement for successful disruption in the long term.) The attrition strategy works as long as you have the fortitude to hold out and the deep pockets to keep improving your product as alternatives flame out. It is my belief that Jobs made sure that thinking is inculcated in the company. So if not low-end is the company vulnerable to new-market disruptors? This is more subtle and the threat here is what Google/FaceBook/Amazon and the other ecosystems are all about. It’s creating new usage models and shifting where consumers place brand value. I think this is more what keeps Apple’s management awake at night. They are not standing still however. iTunes and Software and Services (now with Beats on board) is the way they are staying on top of that threat.

    Lots more here.

  3. Asymcar 17: 27 Quadrillion BTUs

    Research · 2 comments

    Part I is a review of the “automotive stack” and note how there is no singular event that seems to affect disruptive change. From changing jobs to be done, modular design and manufacturing processes, powertrain evolution, urbanization, environmental interests, regulation and taxation.

    Part II is a review of a framework of analysis based on sources and uses of energy.  Inputs, efficiency/losses, network effects and inertia, what can change and what can’t change.

    For a shot of theory, Horace reflects on the dichotomy of efficiency vs. efficacy when it comes to predicting change in the sector.

    via Asymcar 17: 27 Quadrillion BTUs | Asymcar.

  4. Cash exceptionalism

    Research · 13 comments

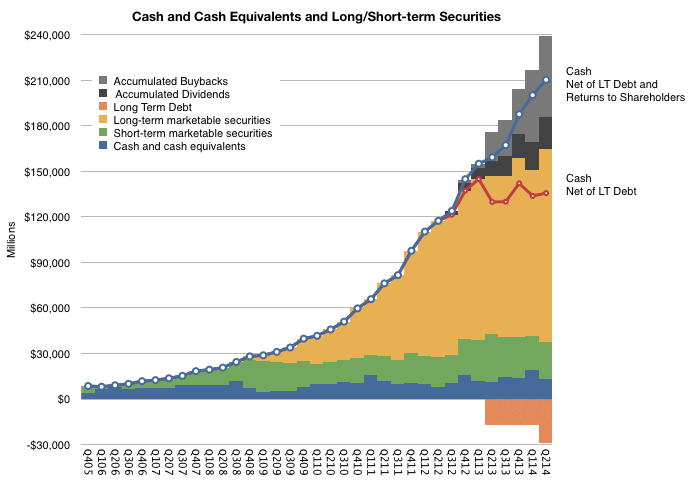
    Prior to implementing a dividend and share buyback plan, Apple had accumulated about $120 billion in cash and marketable securities. In the eight quarters since implementing the cash return plan, Apple has paid about $21.5 billion in dividends and spent another $53 billion of its shareholder's money buying its own shares and retiring them. That's $74.5 billion in cash that's been removed from its balance sheet.

    To avoid some repatriation taxes it also borrowed about $29 billion.

    Of course, in the meantime, it also generated cash from operations.

    Before the plan's implementation, eyeing the cash allowed for easy tracking of the accumulation of retained earnings. After the plan it's become a bit more complicated. The following graph shows all the quantities involved:

    Screen Shot 2014-08-18 at 8-18-2.09.00 PM

    The graph lets us answer the question "What would have happened if Apple had not paid any dividends, bought back shares and taken on debt?" ((The grey and black area of the last column is the total "cash returned to shareholders" and sums up to the $74.5 billion mentioned earlier. The grey area is only theoretically valuable as it depends on the outstanding (i.e. not retired) shares retaining their value. In this case, the value of the shares grew, making this an actual gain for shareholders))

    The answer is in the blue line. It would be about $210 billion today. There are about a dozen companies other than Apple worth more than that amount.

    As the company is not growing as quickly as it used to, the slope of the blue line is constant (i.e. it's nearly linear.) Though that might be seen as evidence of failure, it's more useful to treat this vast quantity as a recognition of past successes. The company's beleaguered status needs to be carefully preserved.

  5. Beleaguered

    Research · 94 comments

    Amazon's recent disputes with publishers (Hachette and Disney) shows a degree of market power that is closer to monopsony than to monopoly but this power is nevertheless real. It may not not be something that requires intervention, regulation or even scrutiny but market power is evident in both how companies operate and in how they are valued.

    If you look at the following graph, it's easy to spot those with "monopoly" power. The graph shows a short history of revenues/operating income and P/E ratios. Modest or no growth in earnings coupled with extraordinary high P/E ratios indicate that the market understands the business is not threatened by competition.

    Screen Shot 2014-08-14 at 8-14-1.40.47 PM

    In contrast, "beleaguered" companies include those with great sales growth but no perceived long term prospects. This perception is evidenced by a low P/E ratio. It indicates how long the company can maintain its present level of profitability. I've highlighted Apple's continuing, and indeed perpetual, beleaguered state. Excluding its existing capital base, Apple rarely gets votes for a life span longer than 10 years. One can see the same status in many Asian companies. Samsung is even more beleaguered than Apple by this measure.

    The underlying implication is axiomatic as far as investments are concerned.: Being under threat all the time is undesirable.

    But is this true?

    One of the issues with monopoly/monopsony is that it leads to business practices and strategic priorities that are tainted by hubris. In contrast, the stress of competition leads to "paranoia" and to a sense of urgency which is blessed by innovative insight.

    This is a corollary of Grove's "only the paranoid survive" or Jobs' rant on why Microsoft was unable to come up with breakthroughs. Grove and Jobs looked at dominance of a market (as either buyer or seller) and saw a curse. Their understanding of the human condition went beyond what the arithmetic of markets would suggest. Running a business and managing people who are asked to create things leads to this insight. Peering at spreadsheets doesn't.

    The observation to be made is that those who invest in companies haven't caught on.

  6. On Capital Allocation

    Research · 8 comments

    One of the paradoxes of the "post-industrial" era is the aversion to application of capital to growth opportunities. Generally speaking, capital has become trapped in bank accounts as opposed to equipment which could be used to produce value. This aversion is rooted in many dysfunctions, chief among them being the misunderstanding of the purpose of the firm.

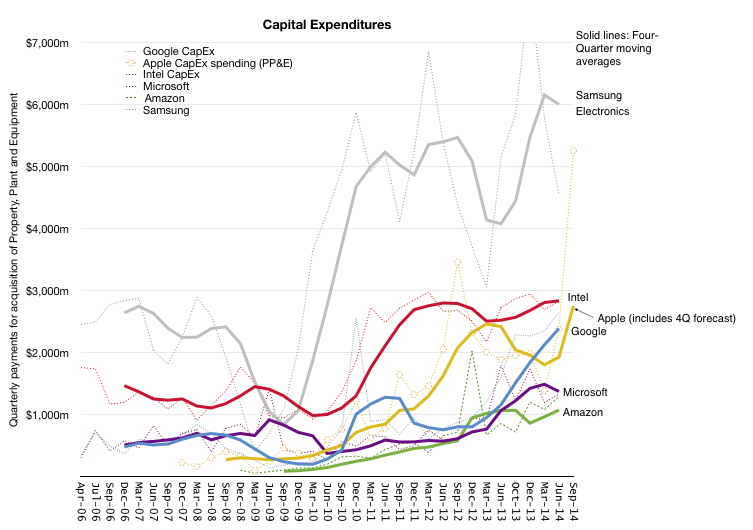
    But there are exceptions. Illustrated below are the patterns of spending in property plant and equipment (capital expenditures) by companies that still recognize that there are opportunities to be obtained by investment in the means of production.

    Screen Shot 2014-08-13 at 11.36.03 AM

    The highest spenders in this cohort are Samsung and Intel, both of whom spend mainly on semiconductor production equipment. Apple has been a big spender on production equipment and, to a lesser degree, on data center infrastructure. As the graph shows, Apple's spending has been nearly at the same level of Intel but with recent volatility, suggesting shifts in production processes ((I'm assuming that the 5S/5 required a surge in spending followed by a throttling back for the 5C with the iPad processes wild cards)).

    Companies such as Microsoft and Amazon have been increasing their spending but since their assets are mostly data centers ((Amazon also accounts for its distribution warehouses and web site development costs as capex)) they have been considerably below the "manufacturing" investment level.

    The interesting story emerging is Google. Its spending must include data centers primarily but the level is now reaching that of Intel and Apple. It actually spent more than Apple for the last four quarters. There might be a lot more need for infrastructure to support its users, but the revenues have not risen as rapidly as this line item

    The question of what Google spends on is interesting. There are many projects which require capital including announced fiber networks but nearly $10 billion/yr. in capex is a staggering amount and I'm curious if its explainable as sustaining their current strategy or something emergent.

  7. Best guess for how many iOS devices will ship in 2014

    Research · 19 comments

    In October 2013, at the end of its last fiscal quarter, Apple stated:

    The Company’s capital expenditures were $7.0 billion during 2013, consisting of $499 million for retail store facilities and $6.5 billion for other capital expenditures, including product tooling and manufacturing process equipment, and other corporate facilities and infrastructure. The Company’s actual cash payments for capital expenditures during 2013 were $8.2 billion.

    The Company anticipates utilizing approximately $11.0 billion for capital expenditures during 2014, including approximately $550 million for retail store facilities and approximately $10.5 billion for other capital expenditures, including product tooling and manufacturing process equipment, and corporate facilities and infrastructure, including information systems hardware, software and enhancements.

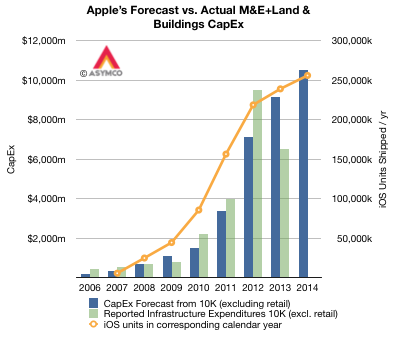
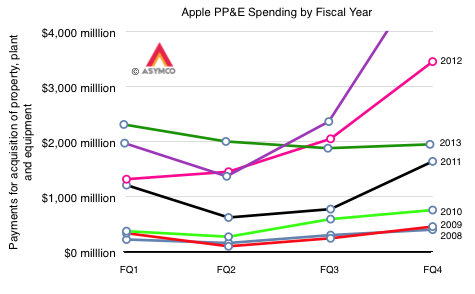
    These 10K (fiscal year annual) forecast figures for capital expenditures are shown in the following graph. Note that they also include the fiscal years from 2006 to 2012. Note also that the graph includes the actual expenditures (in green).

    Screen Shot 2014-08-12 at 5.37.57 PM

    From 2006 through 2013 the sum of the forecasts was $23.445 billion while the sum of the expenditures were $24.662 billion. With the exception of a carry-forward in 2012, the forecasts are broadly in-line with expenditures, with about 5% more spent than forecast.

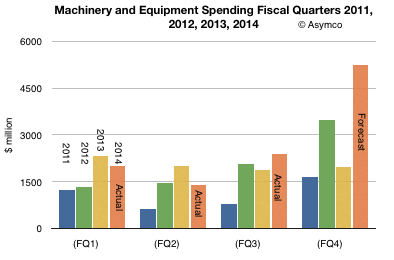
    This pattern of accuracy in spending makes a $10.5 billion expenditure during the current fiscal year believable. In other words, taking the forecast at face value, and given that three quarters of the fiscal year have already passed, what does it imply for the current and last quarter? The following graph shows what Q3 spending should be relative to previous quarters (and 2011, 2012 and 2013).

    Screen Shot 2014-08-12 at 5.38.27 PM

    The FQ4 (CQ3) "budget" for PP&E should therefore be $5.255 billion. This would be the most Apple has ever spent on PP&E in a single quarter.

    Shown another way, each fiscal year's spending from 2008 to present looks like this:

    Screen Shot 2014-08-12 at 5.46.27 PM

    2014 is shaping up to be a bigger "ramp" in spending than any previous year. We have also noted how iOS device shipments correspond to these CapEx figure.

    The relationship is shown in the first graph. I super-imposed iOS unit shipments for the calendar years because capital expenditures tend to result in production in the following quarter and Apple's fiscal year is shifted one quarter earlier than the calendar year. The iOS units shown for 2014 is based on shipments to date and a forecast of shipments for Q3 that is in-line with company guidance ((37.2 million iPhones, 14 million iPads, 1.9 million iPods touch which result in net sales of $40.18 billion and corresponds to the top of the guidance range of $37 to $40 billion)) and a modest forecast for Q4.

    The metric of Capital Expenditures (excluding retail) is a good "rule-of-thumb" for predicting iOS growth, but it's not perfect. Obviously we've seen issues between forecasts and actual spending on a quarterly basis, but there is an overall relationship which makes sense: Apple spends on tooling and infrastructure in terms of data centers to support iOS growth. So far, a growth in CapEx has resulted in a growth in iOS.

    It's therefore reasonable to assume that calendar 2014 will see at least 250 million iOS devices sold. How much that figure will vary will depend to some degree on the confluence and substance of product announcements this fall. ((My best guess is now 255.8 million.))


  8. Open always wins

    Research · 54 comments

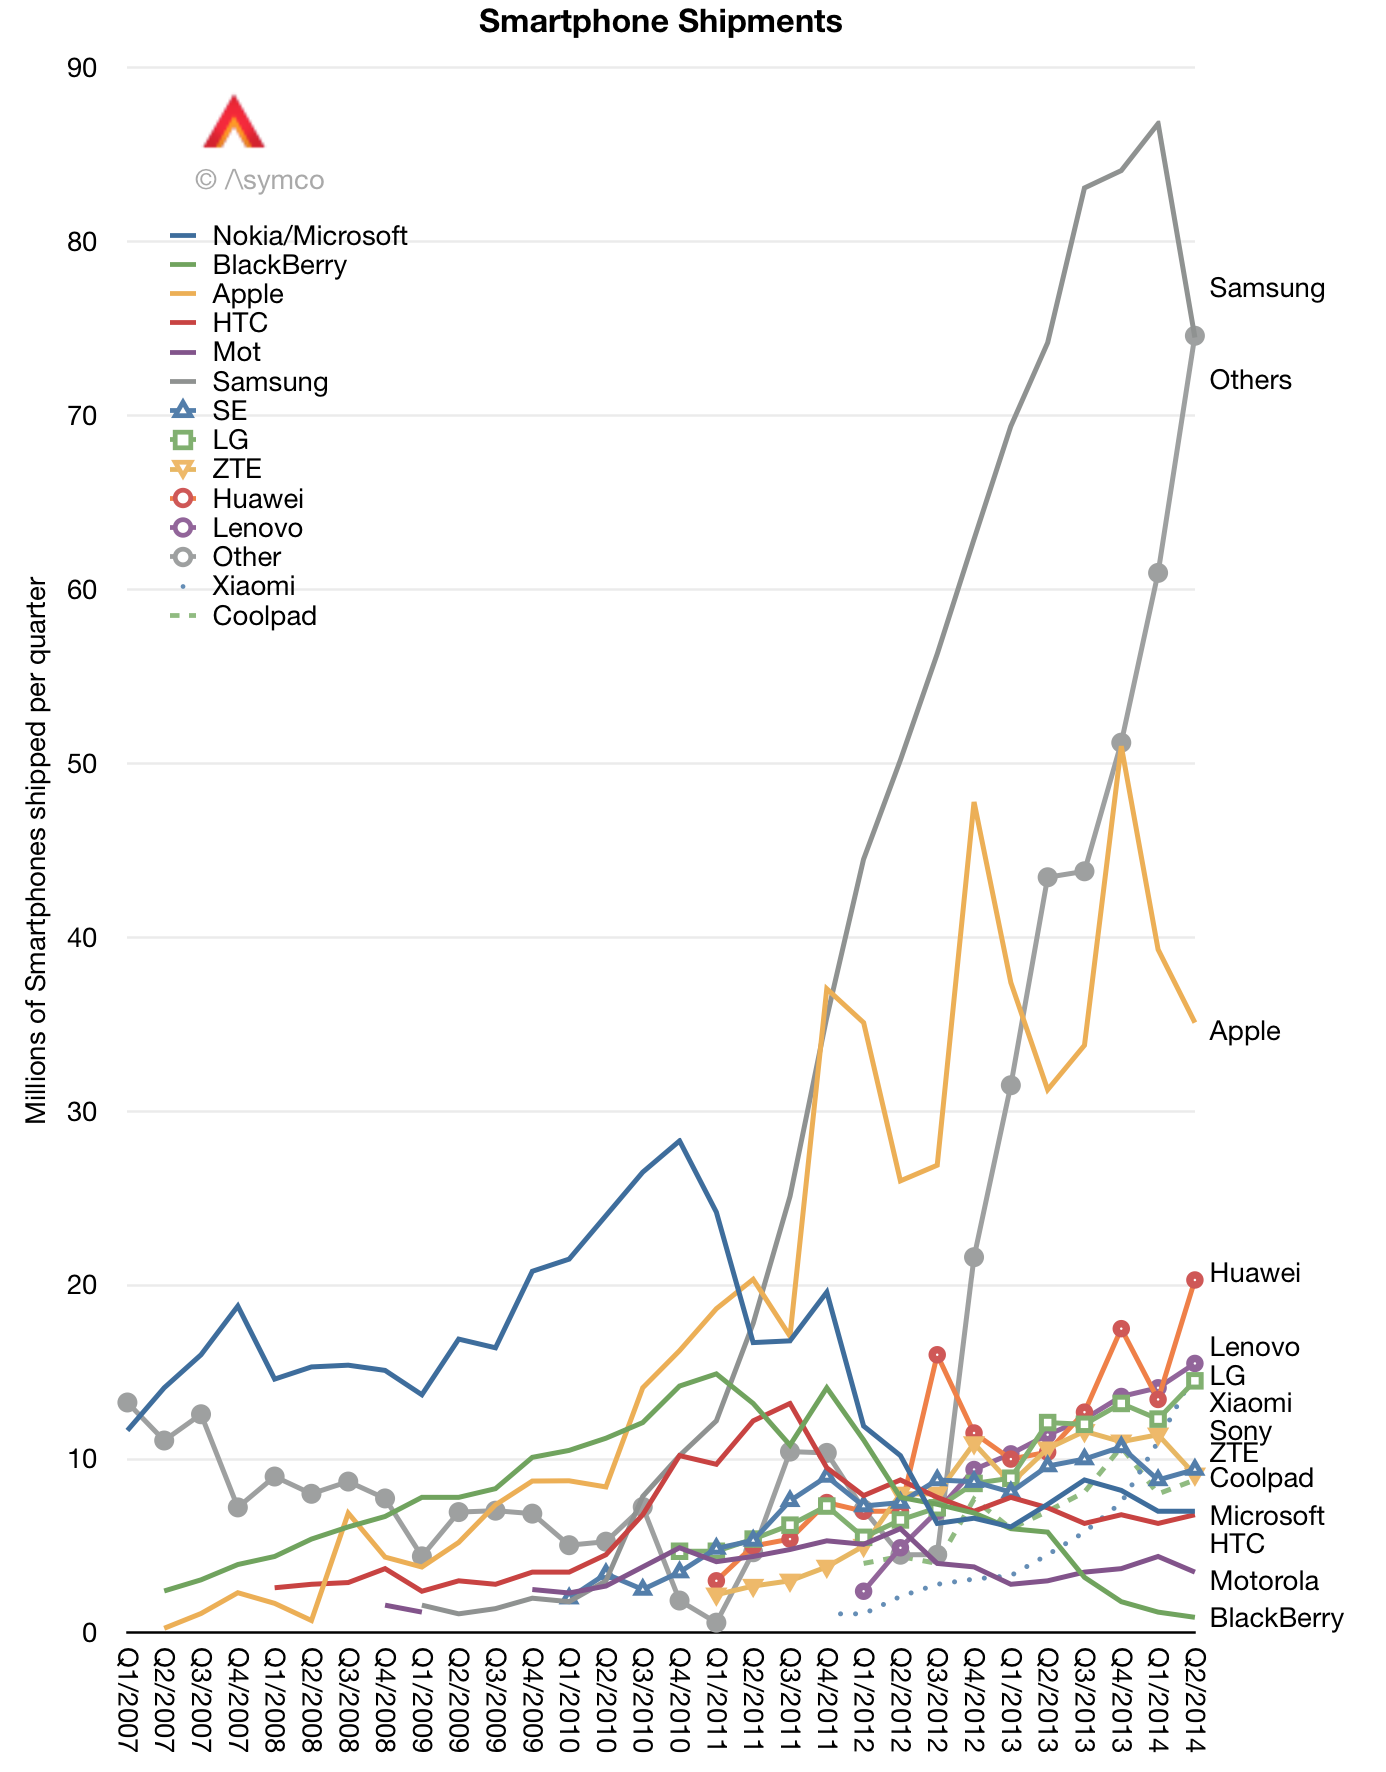
    ABI Research estimates that AOSP (or forked Android) is the fastest growing mobile operating system with a total share of units shipped of about 20%. This is not surprising considering that most Chinese vendors don't include standard Android into their products. Indeed the current leader in China, Xiaomi has its own take on Android and includes a unique UI and set of services. This is also not a new pattern, Amazon's fork of Android has been in development for many years and powers the second most used tablet in the US.

    If one looks at the volumes of smartphones shipped by vendor, the most rapidly growing (Huawei, Lenovo, Xiaomi, ZTE, Coolpad and "others") are likely to be using forked versions of Android.

    Screen Shot 2014-08-07 at 7.06.09 PM

    The reasons for this are many: a reluctance to deal with Google's obligations,  Microsoft's IP licensing costs ((which even Samsung seems to be eschewing)) , potential litigation, politics (including bans on Google services in certain markets), etc. But the most likely reason is flexibility. Vendors competing on price and localization are looking to move quickly against each other and can't wait for blessings from above. Belonging to some "Alliance" and all that it entails is just too much to ask for companies that are, so to say, delicate.

    The result is that the "more open" version of Android is beginning to threaten the "less open" version of Android. China is already lost to OHA but India where penetration is still very low is up for grabs. Into this fray Google launched "One" a more low-end friendly version of sanctioned Android, hoping to retain opportunity.

    The value of a singular Android version is not just being Google-friendly but also being better managed and more BOM-friendly. Google is trying to solve the control issue with ease of use, but still retaining control There will be alternatives however which are both easy and "open" ((or Free as in speech)). It seems that there is an opportunity for a hardware-independent vendor to take AOSP and provide a complete solution to local phone brands so they don't need to expend efforts on integration. A non-Google One, so to speak.

    Why it's likely is that openness in software makes sense when parts of the stack become commoditized. Google took advantage of the commoditization of operating systems (i.e. Linux) to deliver non-open services on top. However, it's inevitable that some of those very services will also be commoditized and therefore that the portions of the stack which sustain Google will be forked as well.

  9. How big is Apple's Ecosystem?

    Research · 38 comments

    iTunes/Software/Services revenues grew at 12%. This was the second fastest segment growth last quarter, with the Mac growing at a slightly faster 13% rate. Apple mentioned in the quarterly earnings conference call the for the first nine months of its fiscal year (i.e. since September) the line item iTunes/Software/Services has been the fastest growing part of the business. The following graph shows the growth scorecard for Apple's line items and it shows how the iTunes store is the only line that has been consistently green (growing above 10% for at least seven years.

    Screen Shot 2014-07-29 at 8.58.53 PM

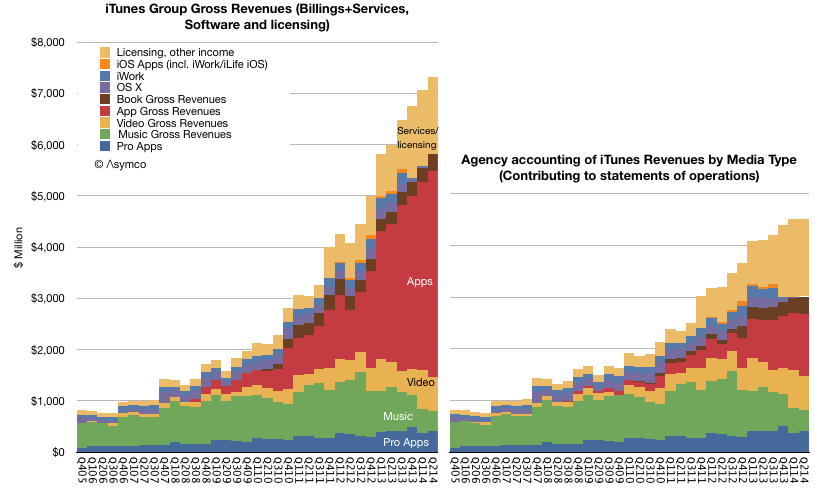
    In addition to its revenues, iTunes can also be measured in terms of billings (or gross revenues). The billings growth rate is even higher at more than 25%. This is mostly to the more rapid growth of apps relative to a decline in music. As Apple only records the 30% it keeps as "revenue" for apps the overall growth in apps is less visible in its accounts.

    The relative performance of billings vs. reported revenues is shown in the following graphs:

    Screen Shot 2014-07-29 at 9.02.13 PM

    Note the estimated split between media types and software and services. The software and services portion of the business had sales of $1.9 billion while the revenues from third party content/apps sales reached $2.6 billion.

    The value of this data is that it encompasses an almost complete view of the Apple ecosystem. As almost all content and transactions are tracked and reported and one can get a very precise view of the economic value of the ecosystem. ((In addition to iTunes/Software/Services Accessories could also be considered as part of the ecosystem. The value of Accessories and licensing as Apple reports it adds another $6 billion to iTunes/S/S)) (( What is missing are ad revenues through apps which don't use iAd )) (( What is also worth asking is what is the size of alternate ecosystems such as those of Microsoft, Google etc. ))

    From the launch of the iPhone the value of Apple's ecosystem has grown more than 600% which is faster than overall sales growth (approximately 400%). If ecosystem value grows more rapidly than underlying hardware sales the question that emerges is when would the ecosystem transaction value exceed that of the business is supposedly supports.

    Today the iTunes/S/S ecosystem is about $20 billion/yr. iPod, iPhone, iPad and Mac sales are about $150 billion/yr. It does not seem likely that the former will overtake the latter. If that were the case then one wonders why build a business entirely predicated on retailing and services without the support of hardware revenues. Something along the lines of Amazon.

  10. A Dollar a Day

    Research · 136 comments

    There are 80 million Mac users. The last 12 months saw sales of 18 million Macs.

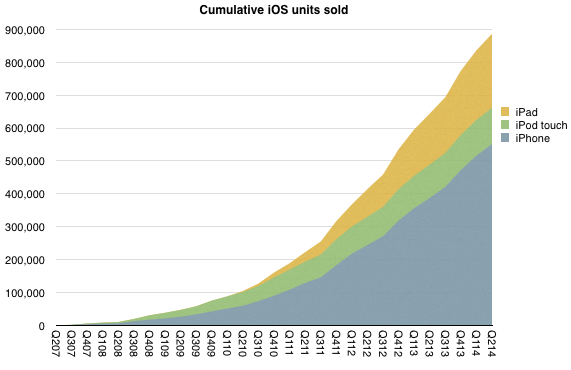
    As of the end of June there were 886,580,000 iOS devices sold. As of today the total is well over 900 million. One billion sold will happen well before this year is out. Estimates of current iOS users vary but they are probably at least 500 million and could be 600 million.

    Screen Shot 2014-07-25 at 7-25-2.44.06 PM

    Apple claims 800 million iTunes accounts.

    Therefore, in terms of revenues:

    • Mac User = $289/yr
    • iOS User = $262/yr
    • iTunes User = $25/yr (( Measured from billings ))

    Adding iTunes usage to either Mac or iOS yields

    • One Mac owner = $323/yr or 89c/day
    • One iOS device owner = $287/yr or 79c/day (( This conforms well to the rule of thumb that, after taxes and accessories/services, one Apple device is worth about $1/day ))

    This should make valuing Apple easy.

    80 million Mac Users and 500 million iOS users add up to about $169.3 billion in sales per year. If we assume that the number of Mac users grows to 90 million  and 600 million for iOS then next year Apple should get another $200 billion from its population of users.

    So over the next 30 months Apple sales should easily be higher than its current enterprise value. (( Enterprise Value = Market Capitalization - Cash + Debt = $585 billion - $164.5 billion + $29 billion = $449.5 billion ))

    This would be the forward price to sales ratio of about 2.5. Each sale yields a certain net profit, which for Apple is on average 21%. Multiplying 2.5 by (1/.21) gives 12 which is about the P/E ex cash.

    This exercise summarizes Apple's valuation nicely: Apple is expected to keep its current customers for about a decade and then disappear.