The Critical Path #85: Achilles' Heel
An update on Airshow, the state of Apple retail, and beginning dialogue on the open question of what is Google's greatest weakness
An update on Airshow, the state of Apple retail, and beginning dialogue on the open question of what is Google's greatest weakness
Research #Industry · 42 comments
In the US, on a sales per square foot basis, Apple retail continues to perform twice as well as Tiffany & Co., the second best retailer, and three times as well as lululemon athletica, the third best retailer.
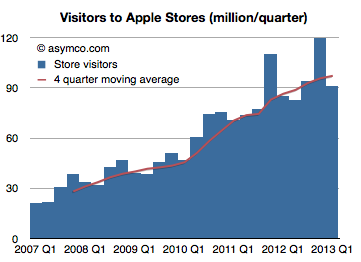
The latest quarter showed a 7% growth in visitors and a new record revenue of $57.6 per visitor.
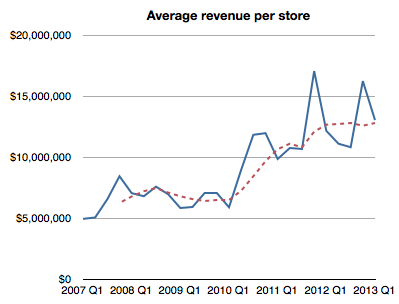
As a result, the average revenue per Apple store per quarter reached $13 million, the highest level for a non-holiday quarter.
Here are some additional metrics:
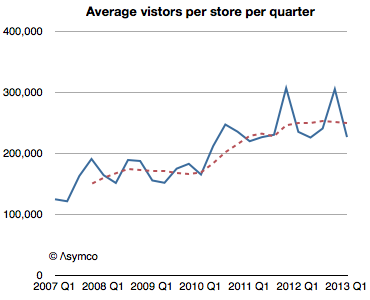
Average visitors per store has steadied to 250,000 per store per quarter (average for trailing 12 months). This is a quantum increase from about 170,000 per store per quarter in the twelve months ending Q1 2010. The reason for this might be the increase in floor space of newer stores and the renovation of older stores. The new store throughput rate might be an upper bound due to fire regulations.
Employment has steadied at about 110 per store. This is a remarkable increase from less than half this level in 2007.
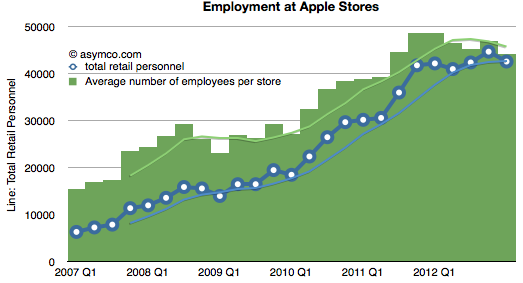
Hiring remains closely correlated with visits with visitors per employee per quarter holding to slightly more than 2000.
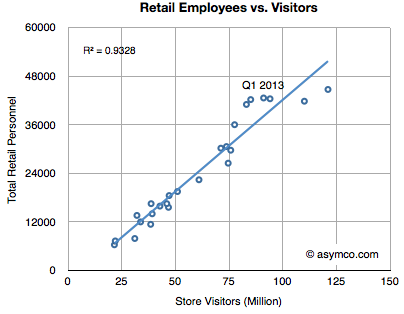
Profit per visitor also holding steady at about $12/quarter.
Retail performance remains constrained by store size (hence maximum number of visitors) and the number of stores. The strategy seems to be expanding US stores while opening new stores outside the US.
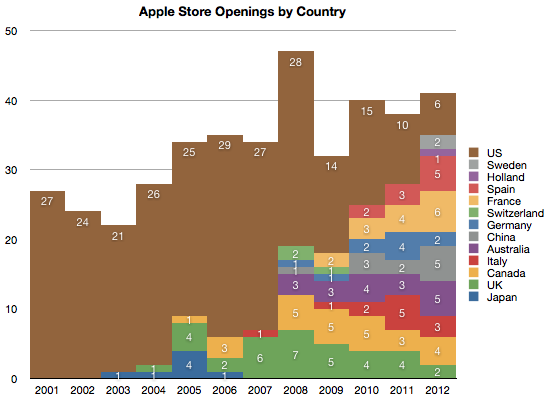
That would allow growth in visitors and hence in achieving the primary purpose of the stores: maintaining the brand's relationship with customers.
Research #Industry #Market #Theory · 130 comments
My estimate of last quarter's iTunes gross revenues suggested a spending rate of $40 per iTunes account. It would make sense to consider how that figure changed over time. The following graph shows the pattern:
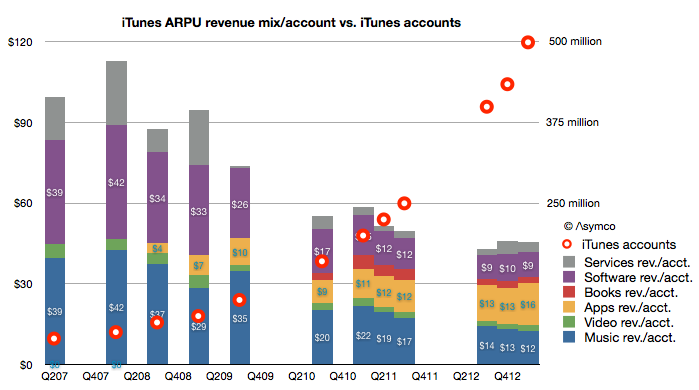
You can read each bar in the graph as the total "ARPU" or average revenue per iTunes user[1].
I overlaid a graph showing the total number of accounts as reported by Apple to the (retroactively) estimated revenue structure. Account totals are measured with the right axis and ARPU with the left. Note that I also broke down each component of iTunes as currently defined (Music, Video, Apps, Books, Software and Services.)[2]
The time frame covered is from Q2 2007, or the quarter prior to the iPhone launch. A few patterns emerge:
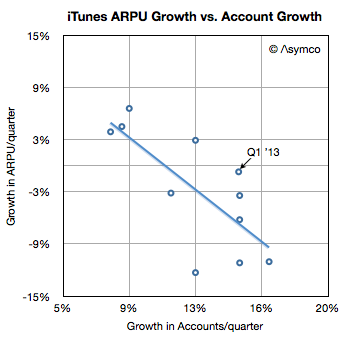
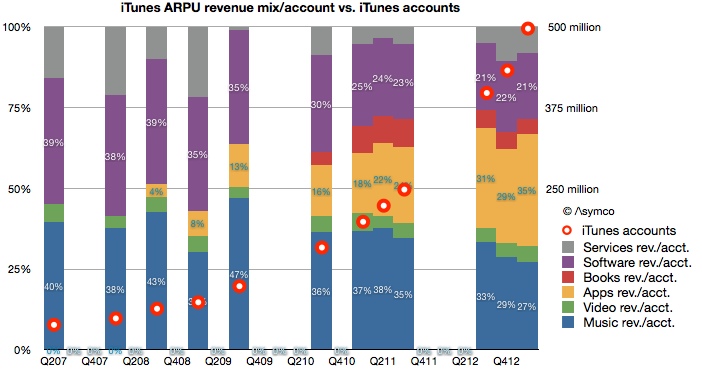
As apps have grown to consume more and more of users' time it stands to reason that they should consume more and more of users' wallets.
And as accounts reach one billion, we can begin to think about the disruptive impact on other media types. Whereas video, books and music are targeted to smaller user bases, apps are broadly consumed. Developers like Rovio or Supercell can offer their products to billions while TV producers can only hope for millions. Apps are becoming the universal medium for entertainment and iTunes the universal distributor.
Talent is catching on to this faster than those who manage and distribute their work. The inevitable result will be a mass migration of talent away from the established content industries. Old media won't fade due to a loss of users. It will fade due to a loss of talent.
--
Notes:
A new theory of device-enabled presentations; the iTunes ARPU average revenue per user and its putative erosion; a definition of smart devices, the cycles of computing as a continuum.
Research #Industry · 75 comments
In the latest quarter the iTunes top line grew by 32%. Additional newly reported items:
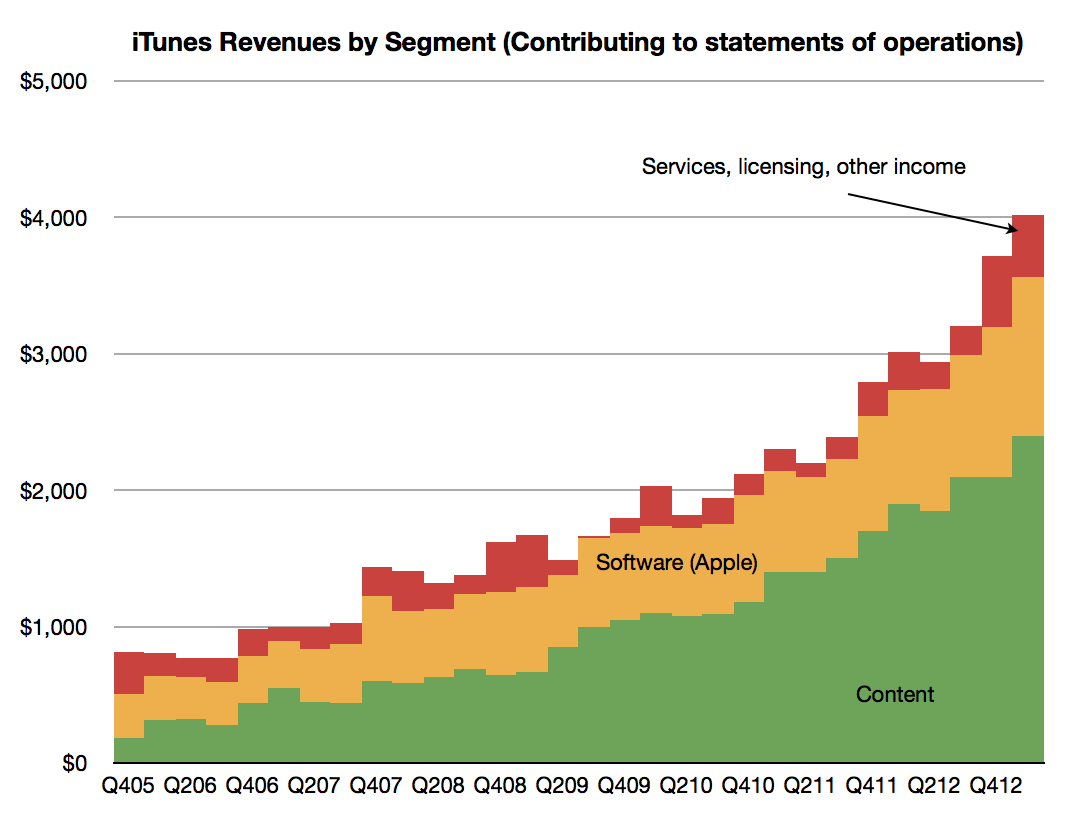
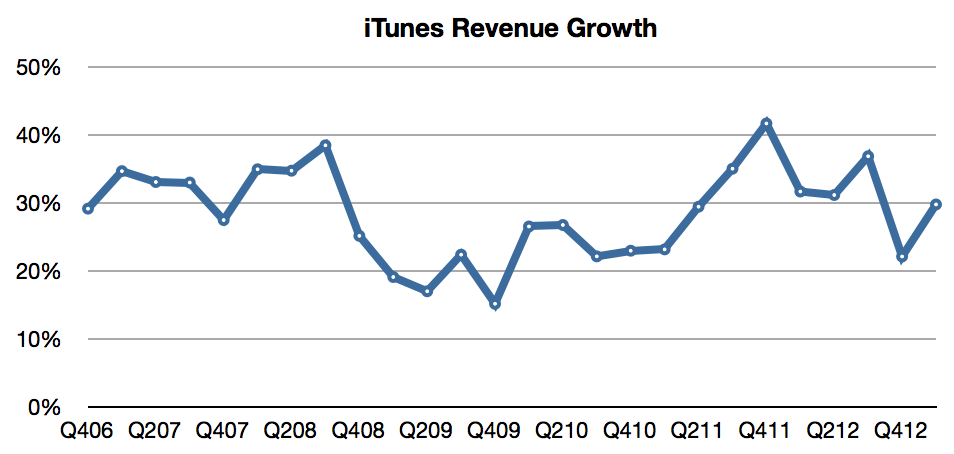
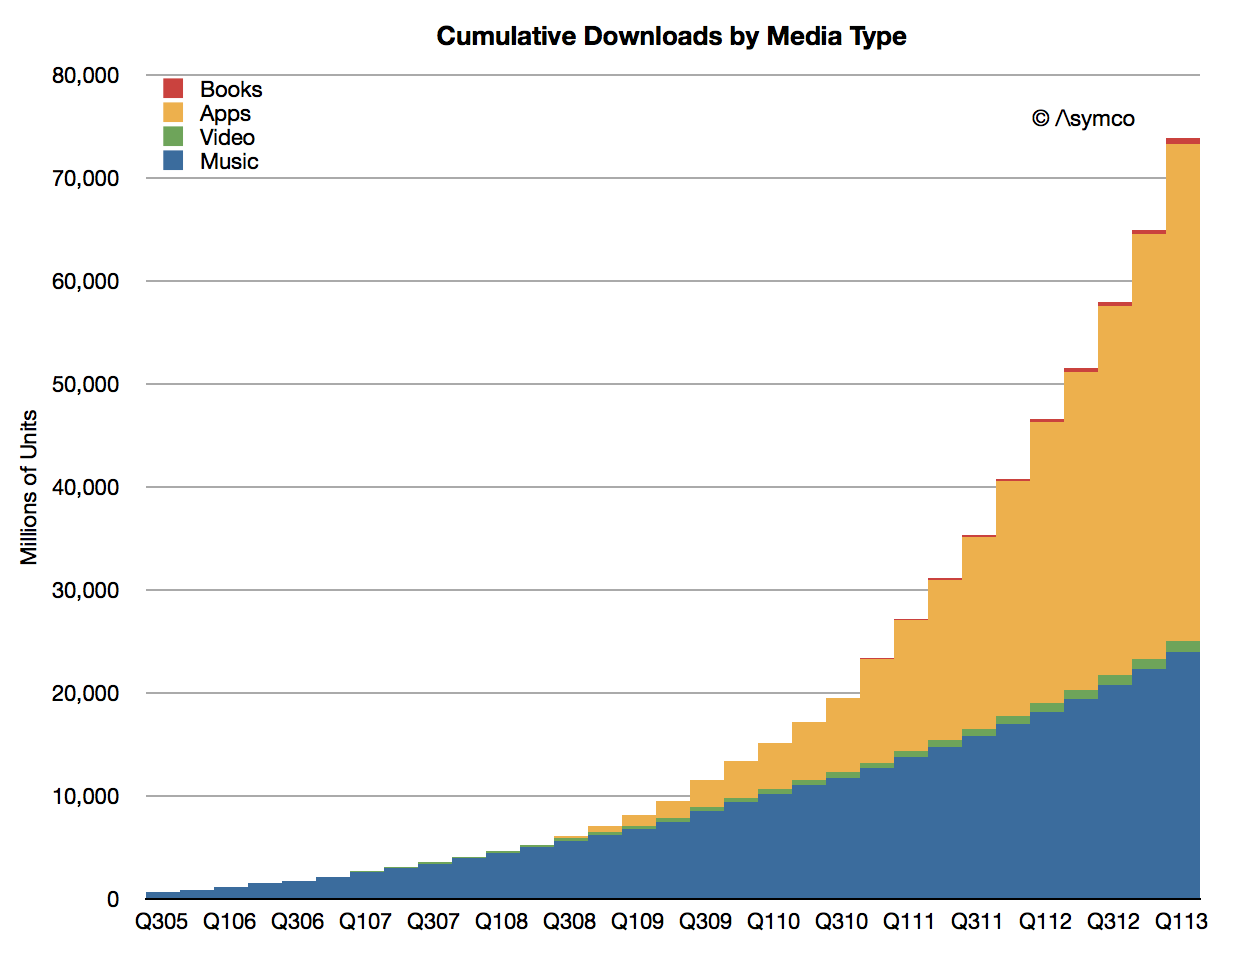
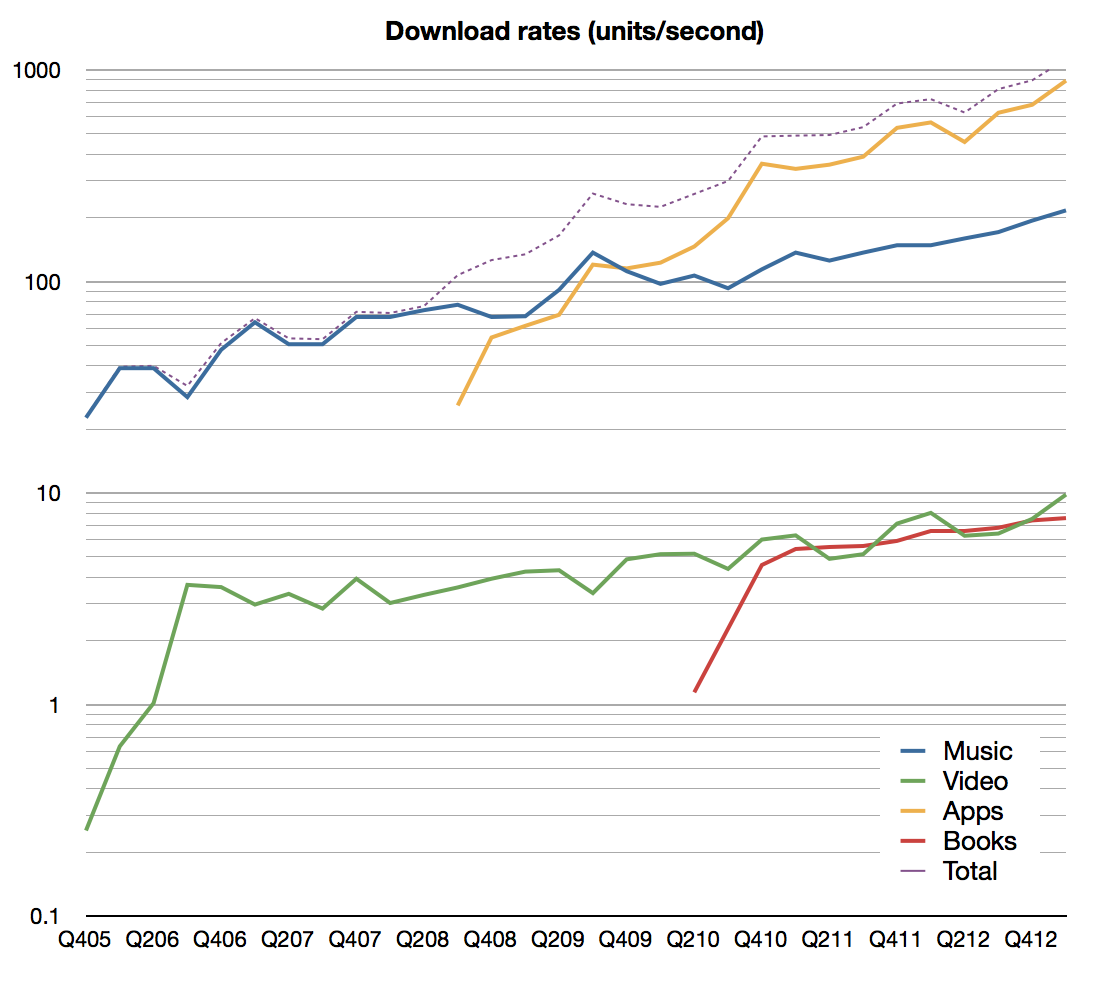
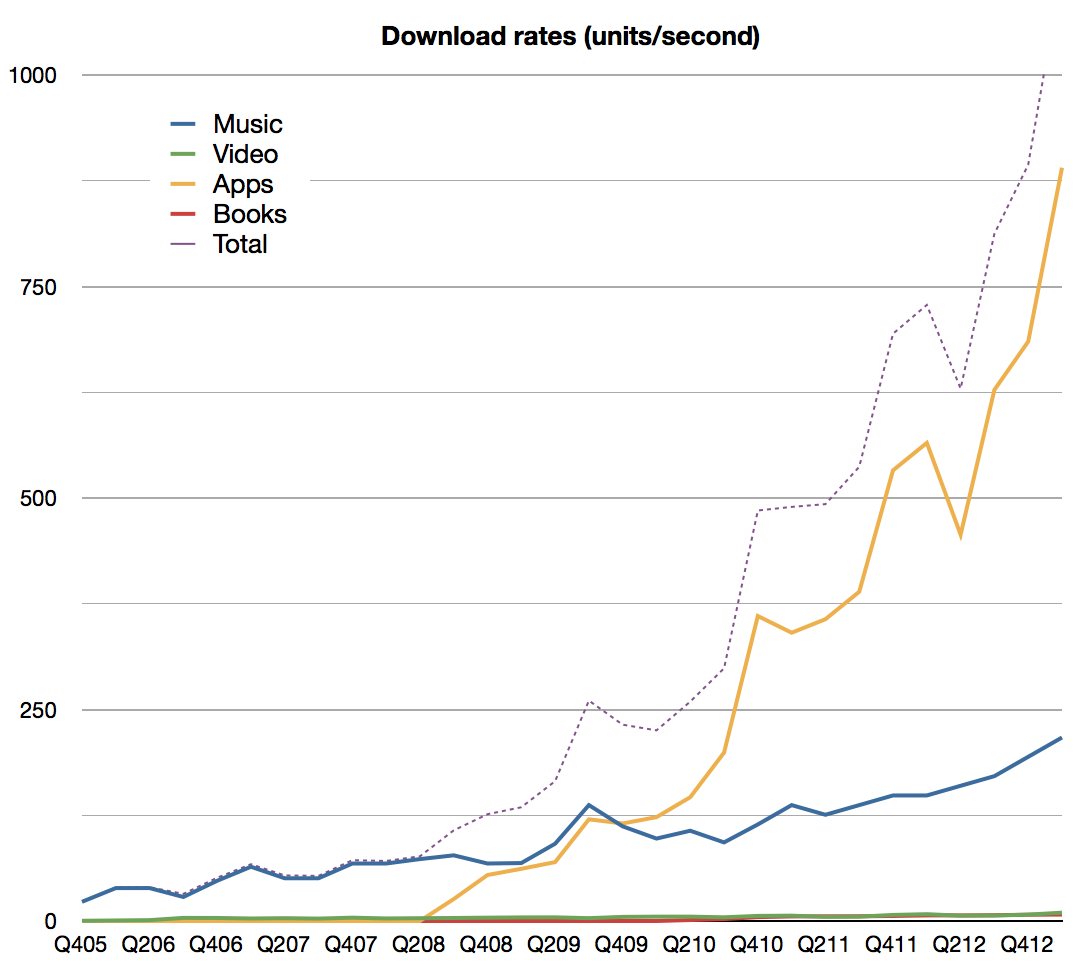
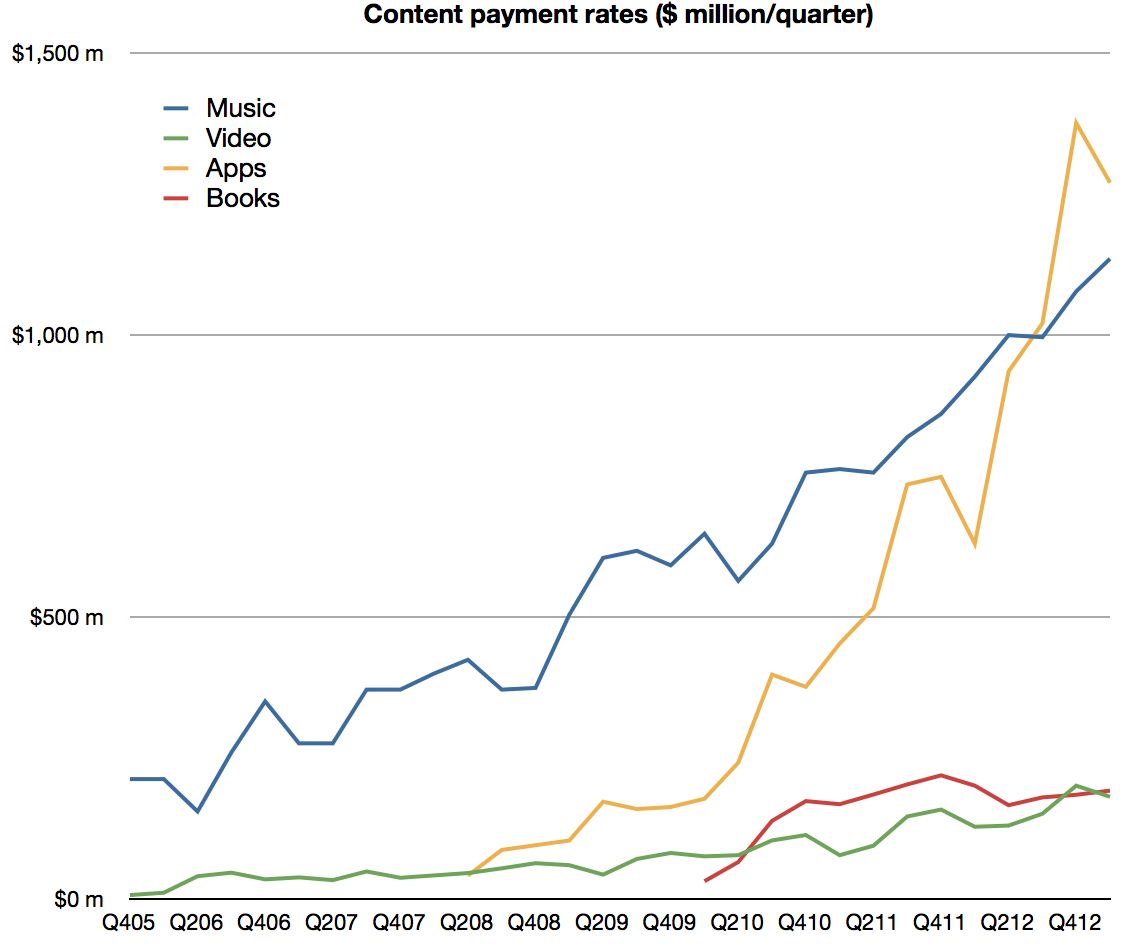
Including all (gross[1]) content revenues, the sales rate is now nearly $5 billion per quarter ($4.94 billion). Including services, the iTunes consolidated business cleared over $5.5 billion.
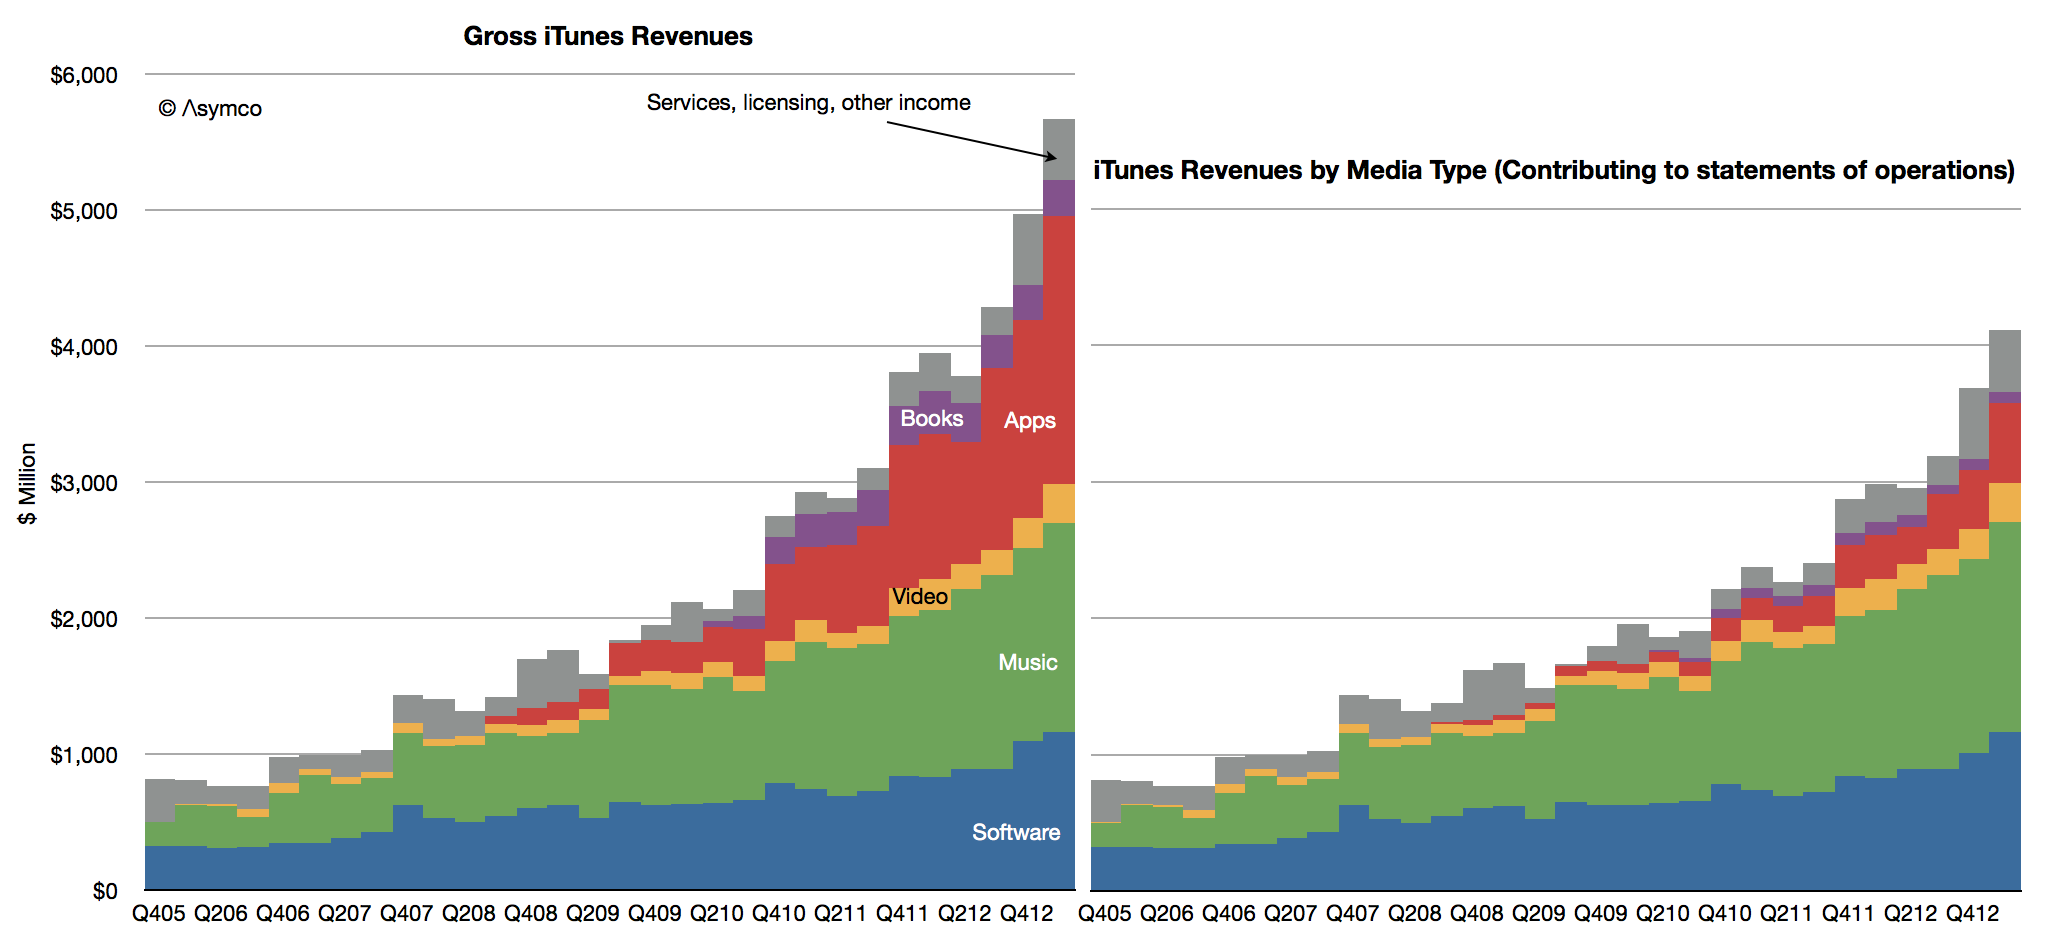
In March Apple reported that they have 500 million iTunes so one way to think about the iTunes business is to say that iTunes users purchase content and services at the rate of about $40 per year.[2]
Bless them.
---
Notes:
Conference #Theory · 5 comments

I join forces with Pixxa, makers of Perspective, to present a workshop on the future of presentation.
After giving dozens of talks in the last year using an iPad with Perspective I've learned a few things. Having also spent years using Powerpoint to try to do the same thing, I've experienced first hand how slideware has gotten in the way of great storytelling.
So we teamed up to understand how stories come alive using data and drew inspiration from Aristotle, Welles, Tufte and Rosling to build a new theory of presentation.
We believe that we have summoned up enough cohesion in the theory to put it forward to an audience and tell the story of storytelling; practicing what we preach, so to speak.
Here are some of the questions we are putting forward:
At a minimum, the workshop is designed to recruit and equip a new cadre (no more than 50) with a new algorithm of presentation built on rhetorical, theatrical and cinematic foundations.
We call the workshop Airshow. June 9th, 10am to 4pm, the day before WWDC, in San Francisco. Sign up here.
Horace proposes a classification of analysts and their motives and how to think about the value of commentary. We delve into how Apple executives obtain and preserve authority and talk about the disruptive impact of Nintendo. Also a hint about a new Perspective presentation before WWDC.
Research #Industry · 33 comments
The latest comScore data shows consistent growth in US smartphone penetration. The rate is now 58.4% of adult consumers who own phones. This is up from 20% only three years ago. The rate of growth remains a remarkable 1.2% per month. That's 700,000 new-to-smartphone users every week. The historic average over 3 years has been 1.07%/month This after having crossed over 50% on schedule in August 2012. There appears to be no slowing.
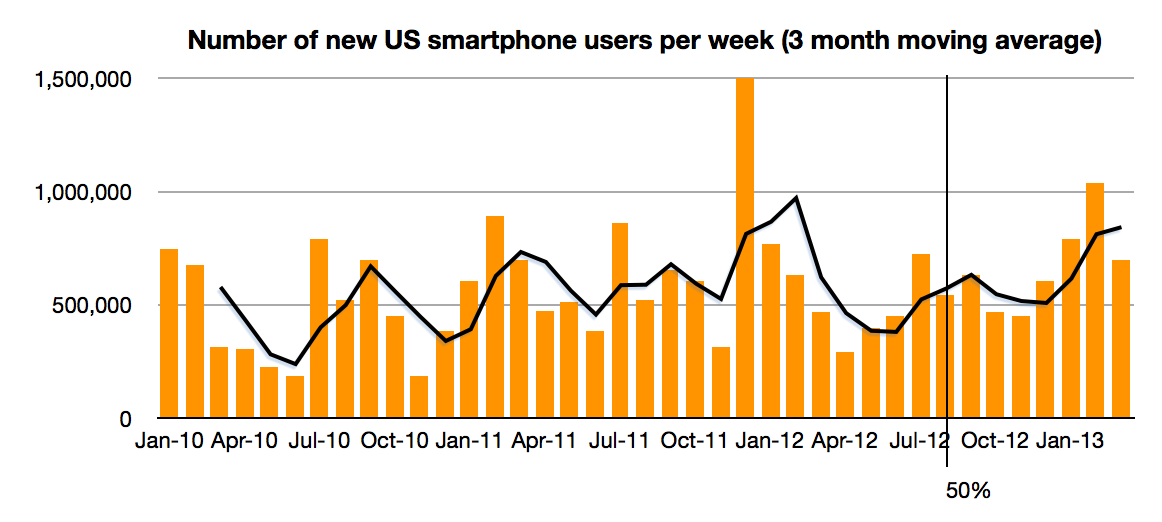
The next milestone I have pencilled in is the 80% mark which I extrapolate to be achieved by October 2014. 80% could be considered "saturation" which would signify a rapid slowing of new user addition. However, that might still not happen until 100%, depending on the availability (or lack thereof) of non-smartphones to buy.
This time frame is important because it would imply that essentially all mobile users in the US (some 234 million) would be a part of one ecosystem in about 2 more years. That's less than the life cycle of the typical mobile contract (and thus the life of one phone). Put another way, by the time a new buyer today is ready to buy the replacement to their phone the market will be saturated.
This implies the mode of competition will be changing to smartphone replacement rather than smartphone adoption. To some degree this is already happening but as the net user gains data shows only BlackBerry and Windows platforms have had any net user declines in the last two years. "Platform churn" is still a relatively rare phenomenon.
How that will change post-saturation will be a crucial determinant to platform growth. The data today points to a higher degree of loyalty for iOS users and potential erosion in the Android user base as a result. There are ways of forecasting this on the basis of survey data as Carl Howe did. However, the data from comScore has already begun to show that Android may have peaked around 54% share. Android share is now at the same level it was in July while iPhone share has grown by more than 6 points since then.
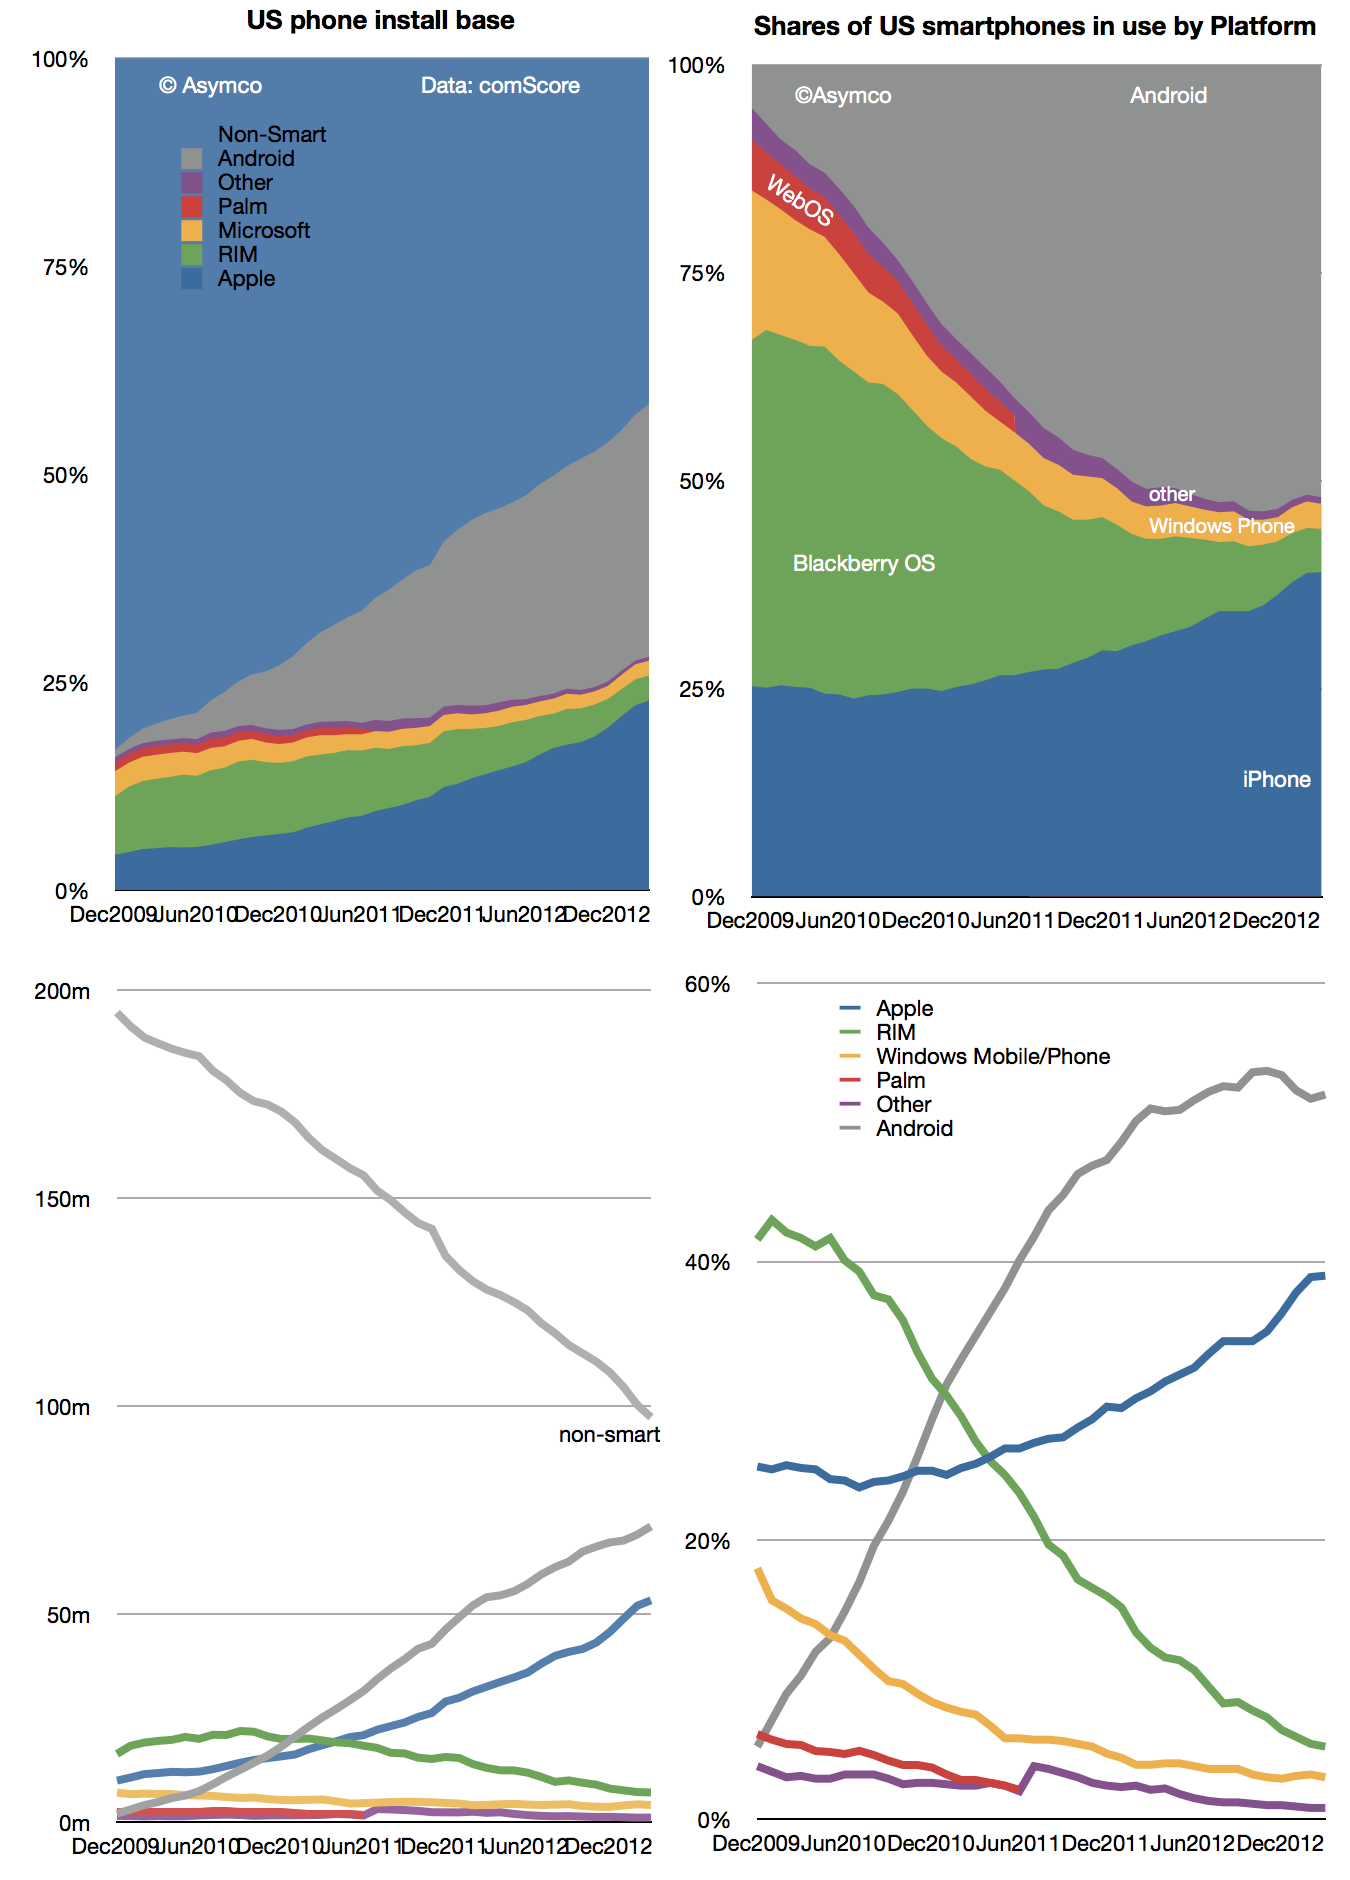
There is a pattern of higher growth into the end of the year and an iPhone plateau into the first quarter, undoubtedly due to holiday buying favoring the iPhone. I don't want to discount the possibility of some change in this pattern but so far there seems to be a plausible reason for it: with iPhone pricing and availability in the US offering no advantages to alternatives, Apple's product is the most popular. Nearly more popular even than all the other competitors combined.
Research #Theory · 22 comments
"So paradoxically, the opinion of those who are highly paid should be treated with suspicion while the opinion of those subject to peer review should be treated with respect. It brings to mind the difference between highly paid fortune tellers and pundits whose methods are obscure vs. poorly paid graduate students whose methods are open to all. Whose opinion is worth more?”
To read more see Horace Dediu on the bad habits of Apple analysts and why Tim Cook shouldn’t be fired - The Next Web
Research #Industry · 34 comments
According to Strategy Analytics 3 million Windows-based tablets shipped in Q1. That is not inconsequential. It would add 4% to the total Windows-based computers and reduce the decline in Windows PC growth to -8% (from -11%). You can see the effect of those units on share in the following graphs.
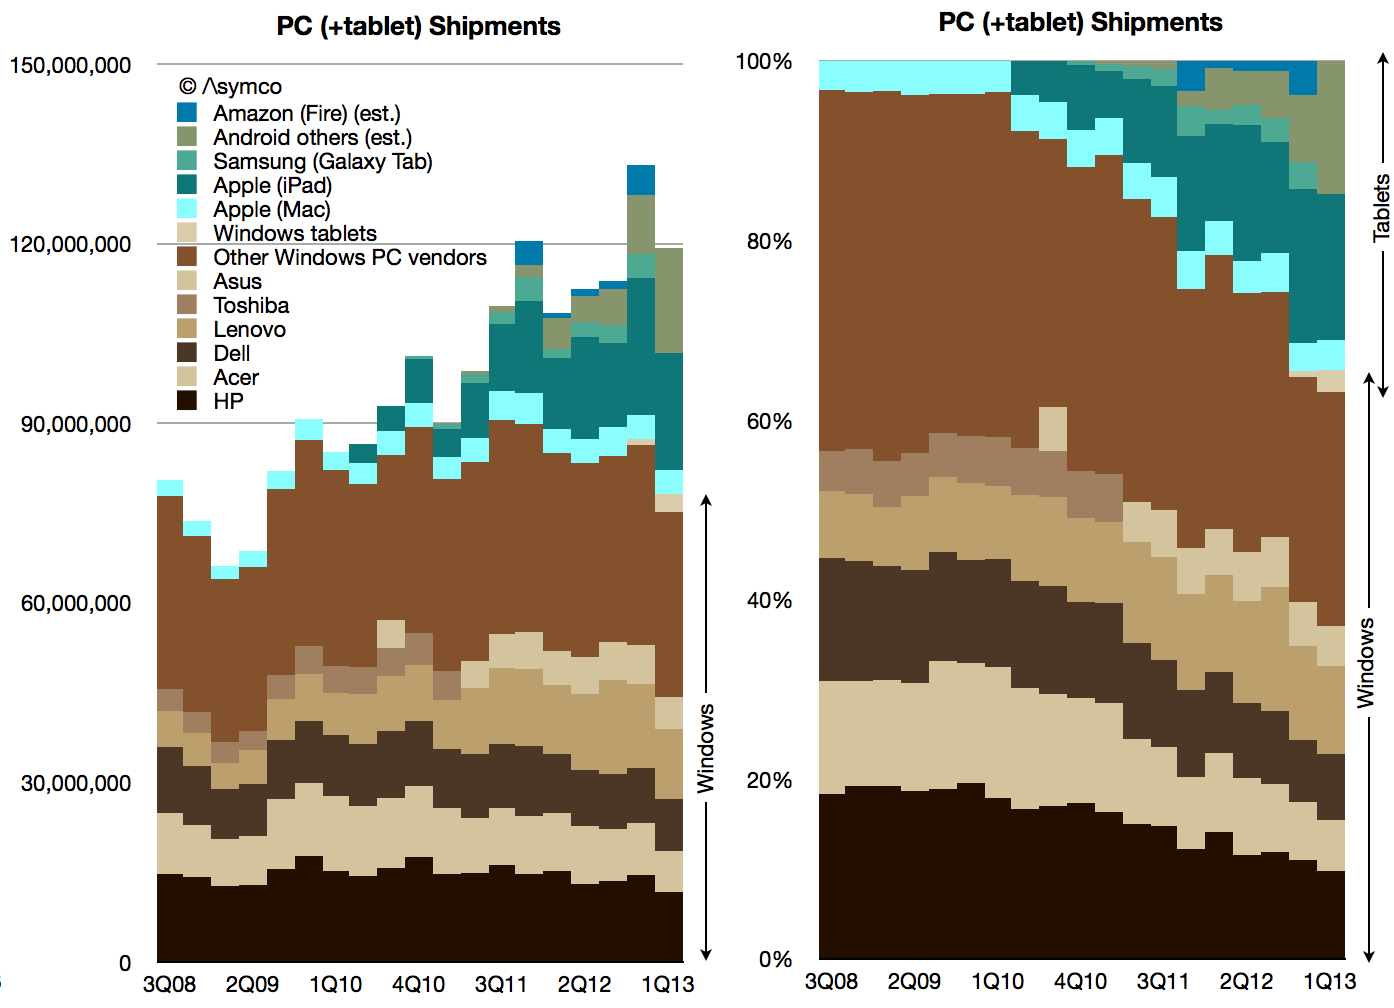
Note the "boundary layer" of pale blue Macs between the brown-hued Windows and the green-hued tablets.
Including tablets of all kinds, here is the market share growth in Windows PCs.
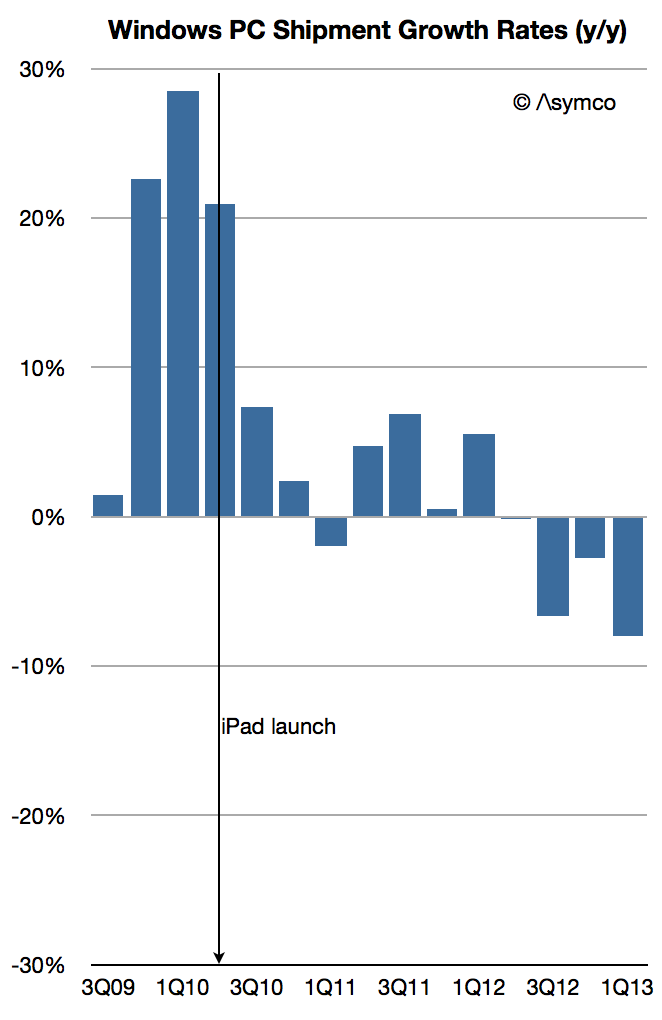
As the post-PC disruption evolves, Microsoft has made an effort to shift its business model. I discussed this some time ago and there remain quite a few questions about the sustainability of the strategy.
However, there might already be evidence that it's working. The clue is in the growth in Windows revenues at a time when PC shipments (at least traditional ones) are declining rapidly. Some of that might be due to deferrals and software assurance revenues which are insensitive to shipments. However some have to be due to the Surface.
Remember that Surface launched with an RT version priced starting at $499 (which did not sell well) but received a boost in Q1 with the Pro version priced at $899 to $999. If we assume a 80:20 mix of Pro to RT and an average price of $950 for the Pro and $550 for RT, 3 million units would generate at least $2.5 billion in gross revenues. Accounting for retail margins of 20%, Microsoft could still be recognizing $2 billion in revenues. That's a significant portion of $5.7 billion in Windows revenue.
We can back into this figure from another direction: Prior to Surface launch, the Windows revenue per PC shipped (combining Microsoft's revenues and Gartner's estimates) was about $50. After the Surface Pro shipped the revenue climbed to $73/PC.
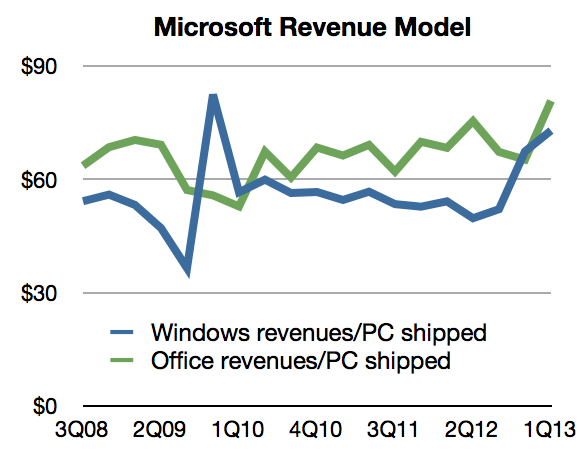
Assuming the same pre-Surface revenue/PC and given the shipment figures for Q1 we would get about $3.7 billion for Windows. The difference to actual revenues is about $2 billion.
So the extrapolation of Windows royalties approach yields $2 billion in Surface sales and the Price x Units estimate also yields $ 2billion. It would suggest that Surface has had a significant impact already: More than a third of Windows revenues depend on it.
[UPDATE: I've been informed that not all the Windows tablet sales reported by Strategy Analytics are Surface products. As many as 1 million might not be. That would reduce the revenues as calculated to about $1.4 billion. In addition, not all Windows revenues are current with much of that deferred. Actual revenues were $4.6 billion. With both of these adjustments considered, the impact of Surface might be only 30%.)
The Apple Q1 financial performance review with a short look at the impact of warranties on gross margins. The growth question: why financial analysis cannot offer insights into new product creation, and why makers of things think different. Finally, a new installment into Asymcar: why the process of car making is over-integrated, over-serving, and over-concentrated.
5by5 | The Critical Path #82: Adding Rows.