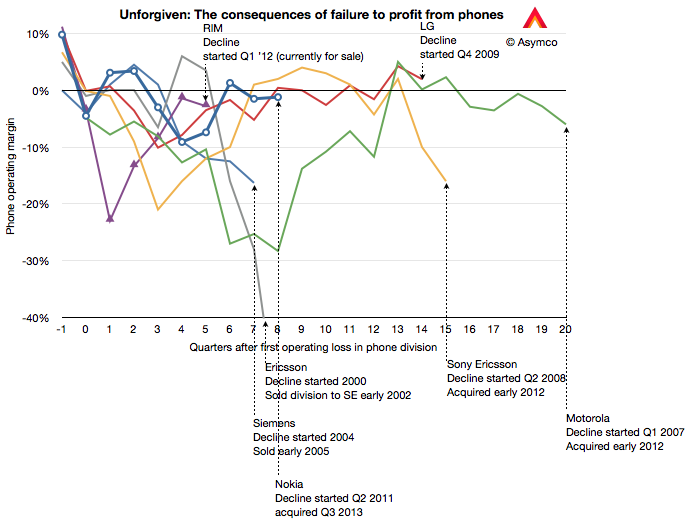
In June of 2011 I asked "Does the phone market forgive failure?" Not much time has passed since but the answer still seems to be no. The trigger I was using for this point of no return when the vendor began making losses.
The list at the time consisted of 13 phone vendors who either merged, were liquidated or acquired after this trigger point was reached. There were no examples of vendors who recovered. Since then two more vendors reached the threshold (Nokia and RIM) and a third will do so this quarter (HTC). One vendor (LG) may be recovering but Nokia has just been acquired and RIM has put itself up for sale. Some Japanese vendors like Panasonic have also called it quits since then. So the score so far is about 18 triggers, 15 exits and three pending.
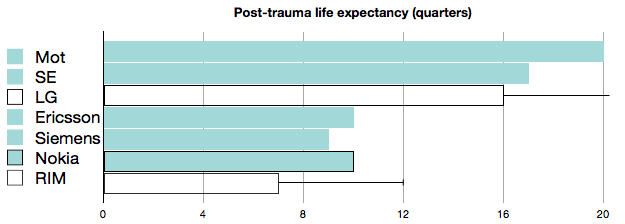
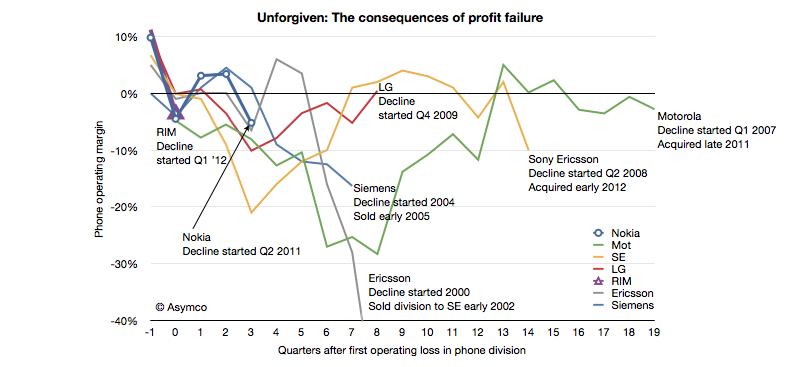
Some of this data is summarized in the following graph:
It shows that post-trauma life expectancy is now running at about 2.5 years. As RIM is only in its second year, one could perhaps expect another 6 to 9 months of independence. HTC could go on until 2015 but the smaller the company, the more vulnerable, so HTC's exit time should be shorter.
The exception might be LG which seems to be recovering. As a conglomerate, LG is much less vulnerable and might have the resources internally to sustain the phone business indefinitely.
Although discussions related to how Apple will "use its cash" center on acquisitions of companies, Apple's has been busy acquiring, just not companies. It has been buying capital equipment. Capital meaning (in the original sense of the word[1]) the means of production.
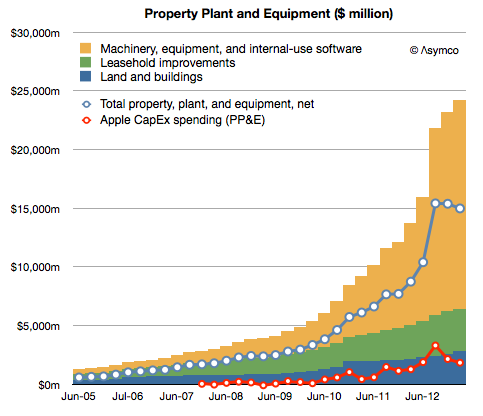
Since the launch of the iPhone Apple has spent $21.1 billion on the acquisition of property, plant and equipment. The company has already stated that they will spend another $10 billion or so for the current fiscal year. This has been mostly machinery and equipment used in manufacturing.
The result in asset value is shown below:
[The Net value, shown as a blue line, is after accumulated depreciation. The red line represents spending as reported on the cash flow statement.)
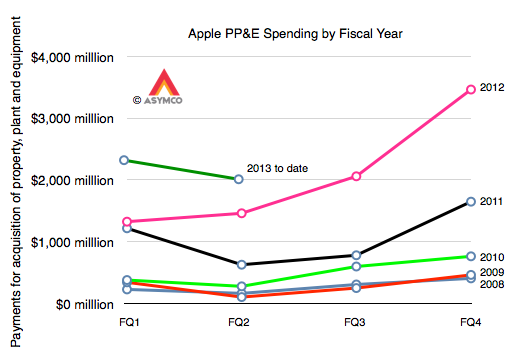
The change in spending year/year (fiscal) is shown in the following graph:
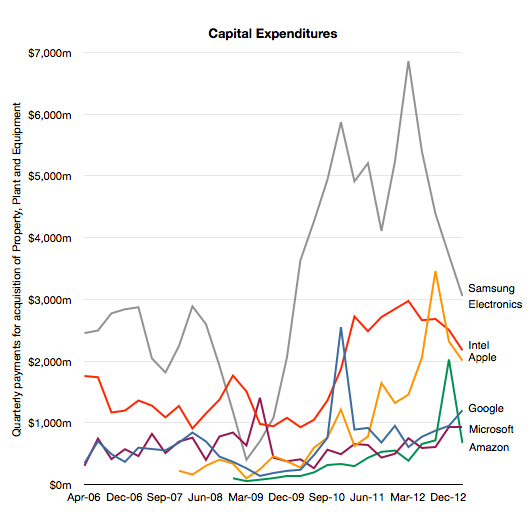
So these are very large numbers, even compared to other capital-intensive semiconductor manufacturers:
Given this enormous spending one could imagine it's the subject of intense scrutiny. However the only question on the subject that I've ever seen was from Steve Milunovich of UBS to which Peter Oppenheimer, CFO offered an explanation:
Steve Milunovich - UBS …second question would be on CapEx, you spent almost as much Intel does. I think you guys have said you’re not going to become vertically integrated per se but in a sense you are since [you buy] equipment for your partners, could you talk about the strategy here and how much of a differentiator this gives Apple in terms of your ability to ramp new products over time? And maybe a little bit more about how deep you will go in terms of semiconductor components for you, etc.?
Peter Oppenheimer - Chief Financial Officer Sure. Steve it’s Peter. We expect to spend about $10 billion in CapEx this fiscal year that will be up little under $2 billion year-over-year. We expect to spend a little bit under $1 billion in the retail stores. And the other $9 billion is spent in a variety of areas. We are buying equipment that we will own that we will put in partners’ facilities. Our primary motivation there is for supply, but we get other benefits as well. We are also adding to our datacenter capabilities to support all the services that Tim spoke about in answering Ben’s question and in facilities and in infrastructure. So, that’s where the capital is going.
I would say that this is not a very satisfying answer, which is why I thought it merits further questioning[2].
Alas, no.
Whereas there is a constant clamoring for Apple's to use its cash to "acquire" or "buy" something, anything, maybe people not looking hard enough. If you need the satisfaction that comes from knowing that money is being spent, a glance at the Cash Flow statement and Balance Sheet shows that Apple buys the equivalent of one Yahoo! every three years[3].
The main difference with this type of acquisition is that there is less value destruction. Using the capital to ensure access to capacity, differentiation and hence a high margin is better than writing off the goodwill after a few years.
--
The term capitalism, in its modern sense, comes from the writings of Karl Marx
I am prepared to be alone in this quest as it seems to merit no mention from others
The latest yearly report from Apple includes, as it has in the past, the forecast of Capital Expenditures. I've been tracking this data as an indicator of both strategic intent and potential forecasting tool for iOS device production.
Before exploring Apple's own forecast, we should look at how they met expectations for fiscal 2012.
In October 2011 the company forecast was as follows:
The Company anticipates utilizing approximately $8.0 billion for capital expenditures during 2012, including approximately $900 million for retail store facilities and approximately $7.1 billion for product tooling and manufacturing process equipment
The Company’s capital expenditures were $10.3 billion during 2012, consisting of $865 million for retail store facilities and $9.5 billion for other capital expenditures, including product tooling and manufacturing process equipment, and other corporate facilities and infrastructure. The Company’s actual cash payments for capital expenditures during 2012 were $8.3 billion.
There are two points that need to be highlighted:
Expenditures overall were $2.3 billion higher than forecast. Nearly all of the over-spending was for "product tooling, manufacturing process equipment and infrastructure". Retail was planned at $900 million and actual was $865 (an under-spend of $35 million). As no major real estate assets were acquired (change in those assets was $380 million, less than 2011 or 2010) the "deficit" in budgeted expenditures can be attributed entirely to product tooling and manufacturing process equipment.[1] The $2.3 billion spending over expectations amounts to 34% of forecast.
The cash payments for capex were $2 billion lower than expenditures. This is a curious situation which was not highlighted in previous 10 K reports. What this implies is that much of the "over-spend" was not paid for though cash and since no new debt was booked it's likely to have been paid for through some form of vendor financing. I'll explore some explanations below.
So it's important to note that the company spent a great deal more (one third more) than expected and paid for some of the acquisitions through uncharacteristic or unorthodox means.
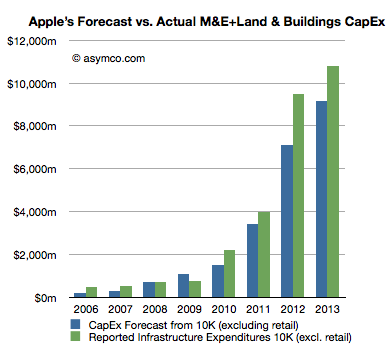
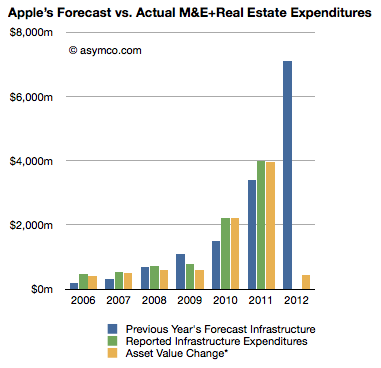
The historic budgeting for Machinery & Equipment (+Land & Buildings) is shown in the following graph:
I included the forecast for 2013 ($9.15 billion) and added 18% to estimate 2013 actual spend.
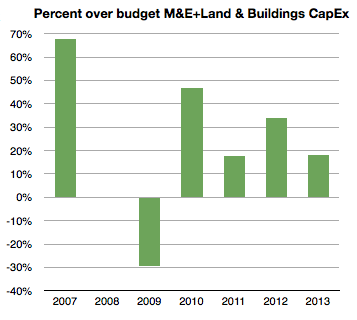
The percent over/under budget (percent difference between green and blue bars above) is shown below:
[Again, note that I took the liberty of forecasting 2013 over-spending at 18% or $10.8 billion.]
Note that 2008 and 2009 were either on target or below target. The recession of 2008/2009 might have had something to do with that. The under-spending situation of 2009 was made up for during 2010 with over 45% extra spending. 2011 came in at 18% over and 2012, as already noted, was 34% over budget. I then suggest that 2013 will be at 18%, same as in 2011.
When seen in this historic context, the increase of 2012 is even more dramatic. Apple overspent in 2012 more than it spent overall two years earlier. 2012 spending on M&E (and Land) was up 138% sequentially and nearly seven times the level of three years ago.
With this splurge in mind it's necessary to think about that second noteworthy point above. There is evidence that at least some of the $2.3 billion over-budget was unanticipated and came late in the year. We saw the surge in spending in FQ4 from the gross asset value change data. The question is what was it spent on and why did it not go through the cash flow statement?
Circumstantial[2] evidence points to the asset being production equipment (or even a whole plant) previously owned by Sharp. Sharp is a key supplier of screens to Apple but is also in financial distress. Sharp has also been the object of an intended investment by Foxconn [Hon Hai]. That deal fell through as Sharp's finances deteriorated. My guess is that these attempts to shore up Sharp are directed by Apple to ensure both continuity of supply and a balanced supplier base (offsetting Samsung, another supplier.) If Sharp were to enter into some form of bankruptcy, the key plant(s) used in producing screens for Apple might be "up for grabs" by creditors and they might be taken off-line, jeopardizing Apple's production capacity, irrespective of contractual obligations. I believe that Apple's late and unprecedented expenditure was to secure this asset. I further believe that the financing for this deal was done through a swap of "pre-orders". Stepping even further into the hypothesis, I believe Apple arranged to move a Sharp screen production line onto its books and "paid" for it through a pre-payment of components. This being a pre-payment it would be in the form of an "off balance sheet" commitment. Apple reported that "As of September 29, 2012, the Company had outstanding off-balance sheet third-party manufacturing commitments and component purchase commitments of $21.1 billion" [my emphasis]. This is a significant increase from earlier years and allows for a huge "slush fund" to cover asset swaps.
If we take the timing of this expenditure into consideration, I consider it reasonable to assume that 2013 spending is lower by this amount. In other words, I think that about $2 billion, including the Sharp plant, may have been "brought forward" by a few months from 2013. If the company had spent more on schedule and on budget (i.e. with an over-spend of 15% rather than 34%) it would have spent about $8.2 billion. Therefore, as next year's forecast is for $9.15 billion and as I would also expect an over-spend of 18% or $10.8 billion total, adding the brought-forward $2 billion would imply sequential growth from $8.2 to $12.8 or 56%.
This is in contrast to the indicated change of $9.5 billion (actual) to $9.15 billion (forecast), or decrease of 4%.
So, recapping the CapEx story, the company over-spent far more in 2012 than anticipated. It did so late in the year. It did it while a supplier was in distress and another's supplier's efforts in rescue failed. Furthermore, it indicated a modest and thus uncharacteristic increase in the next year's CapEx budget. My take is that the trajectory of investment is not being altered dramatically but it's had an adjustment in timing, a kink in the line. The overall story remains that Apple is still injecting vast and growing amounts of capital into production and placing those assets on its own balance sheet.
---
Notes:
I track this spending through asset value changes in the balance sheet. That change in value excludes depreciation which turned to to be substantial in 2012: $2.44 billion.
What follows is strictly hypothetical and based only on pieces of evidence that have become public hinting at an explanation but there is no proof.
There is no shortage of information about what happens to companies in distress. The cause of distress varies widely and is often not well understood but the actions and symptoms of distress are very consistent. We can look at examples in each industry, even in each product category for a rich set of distressed company data.
For over a year I've been chronicling the decline of incumbents in the mobile phone industry. However, decline cannot continue indefinitely. At some point a company "exits" the industry. Either through a sale or divestiture or, rarely bankruptcy. The list of exits is already long. The length and the correlation between exit and the lack of recovery implies that Nokia will also exit.
But how, exactly?
Will Nokia be acquired? If so, then by whom? What other options exist? How can we analyze this?
The easiest way to guess is to look at what happened to other companies in similar circumstances. The clearest and easiest comparison to apply is Motorola. Motorola was at one time the largest phone vendor and it went through a violent decline. Like Nokia, it was diversified into networks and a few other businesses. Unlike Motorola it's not an American company. This matters because American companies are more comfortable targets for corporate raiders. The legal and boardroom mechanics are not "better" or "easier" in the US than in Europe but they are more familiar to those who might engage in it.
So one avenue that Motorola traveled on was the intervention of activist investors who forced management change, affected strategy and pushed some tactical initiatives. This external pressure was successful in the case of Motorola. The company was split up, it was re-purposed and re-focused and, with a bit of good luck, was acquired.
The process however still took two years. In that time the company languished but stayed alive. Its headcount was reduced by nearly two thirds. It was in a precarious situation throughout. Its story is not over but ownership did change hands and those who took a risk with it while in distress managed to get a reward.
This example (and Sony's acquisition of Sony Ericsson and HP's acquisition of Palm) cannot apply to Nokia. An activist investor is unlikely and the company has not yet made itself attractive to a buyer. So what would Nokia need to do to be acquired?
The first step toward an acquisition will be divestiture of its Nokia Siemens venture. The second will be a spinoff or sale of its non-smart phone division. The third might be the allocation of its IP across these separate entities or in a separate holding.
As the company is broken up, value can be released. Investors will be able to value it better and make appropriate assessments of risk. Only at this point would an acquirer perhaps buy the "rump" Nokia smartphones group.
However, even this scenario is not without huge risks. By the time the split is completed, the operating companies could have deteriorated to such a degree that they are no longer viable. Timing is critical.
So if the smartphone group is isolated and made available, who could buy it? Microsoft is always cited as the primary buyer. I've been skeptical of this as Microsoft has found it difficult to make hardware work. It acquired Danger leading to Kin which failed. It has struggled with Xbox for a decade and has yet to recover all its costs for the effort. It has failed embarassingly with Zune. It also has shown no particular success with its original Surface table computer.
But management has re-committed itself to a new hardware effort with the new Surface. This renewed potential opens up the possibility of entering into the integration of a phone again into their business, and Nokia would be remarkably well positioned to help.
At this time, the possibility still seems remote. The company has dismissed speculation of building phones again and again. Unlike PCs, the phone platform is not yet mature and volumes and distribution are very different.
However, there is one other option.
Microsoft has historically "rescued" technology companies in distress with cash infusions for minority equity stakes. It injected some cash into Apple, Barnes & Noble and even Facebook. It did so not because they wanted to own these companies but because they wanted them to survive or thrive. The move acts as a signal to the industry, partners and developers. So what I see more likely than an acquisition is Microsoft capitalizing a spun-off Nokia Smartphones company in exchange for a small equity stake.
The valuation of this stake will be huge as I expect billions of dollars for single digit share ownership. However, Microsoft would not be doing it to get a return from those shares. It would probably later sell them at a loss. But it would be buying a strategic option whose value may be far greater.
In June of last year I wrote a post titled "Does the phone market forgive failure?" It was written on the eve of Nokia's Q2 2011 report highlighting the historic consequences of a dip into negative operating margins for a phone vendor.
I listed 13 phone vendors who were either merged, liquidated or acquired. There are no examples of vendors who recovered from a position of loss making.
I was prompted to follow-up by a note Charter Equity Research analyst Edward Snyder wrote illustrating the effect of negative operating margins on phone vendors. I took his illustration and expanded it with additional data.
Since my post in June last year Sony Ericsson and Motorola were acquired making the victims list total 14 companies, with Nokia, LG and RIM having joined the "endangered species list". If the pattern repeats, then RIM and Nokia are in early phases of what promises to be an extended period of pain followed by an exit.
What the analysis does not answer is when a vendor loses its independence after beginning loss making. Motorola took 20 quarters; Sony Ericsson 14, Ericsson 8 and Siemens only 7. We cannot tell if or when LG, which is still operating after 8 and Nokia, which is now in its fourth and RIM, now in its second quarter post-loss, will lose independence.
The rumors swirling around RIM and LG are centered around exits and some suggest Nokia will follow. Many also argue that these companies will recover. The conditions they each face are different in details but broadly they are the same. Earlier last decade the exits were prompted by loss of brand value and subsequent loss of distribution. This decade disruption brought upon by mobile computing brings with it new business models centered on ecosystems and value captured through software and services.
Until and unless these endangered companies solve the dilemma of having the wrong business model at the wrong time, the chances are that they will not be forgiven for market failure.
At the end of 2011 Apple's net property, plant and equipment (PP&E) was $7.8 billion. This reflects $12.34 billion gross PP&E net accumulated depreciation and amortization of $4.5 billion. The depreciation and amortization increased by a total of $533 million and the gross PP&E increased by only $572 million. I say "only" because in the previous quarter PP&E increased by $1.42 billion. If we assume that this growth is equivalent to capital expenditures for the quarter, it's also a very small amount given the company's stated intentions to spend $7.1 billion during the fiscal year.
The gap is illustrated in the following chart:
The blue bar in the 2012 year represents the company's stated intentions (from the 10K). The Yellow bar in 2012 is what has been spent so far as measured by the change in reported asset values. Given that the company has been exceeding their targets lately, one should expect the yellow bar to reach as high as $8 billion after another three quarters.
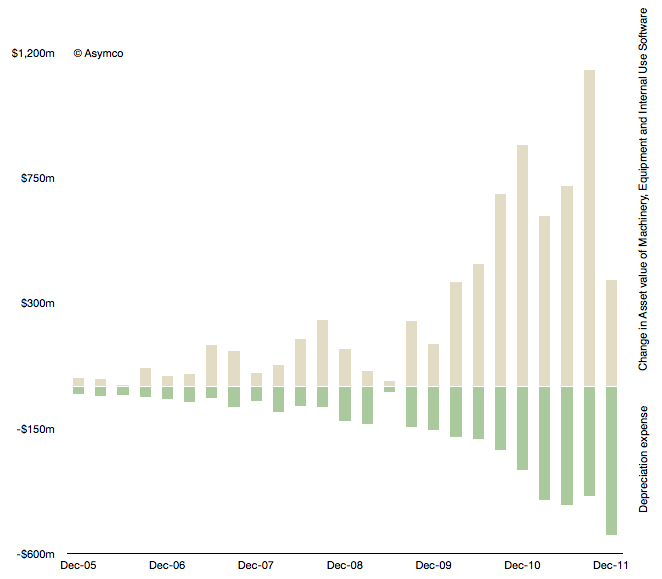
Another view into this data is provided by the following chart.
The beige bars represent the quarterly change in asset value and the green bars are the depreciation expenses for the same quarter. This view also shows a significant slowing in spending.
In the past I showed that CapEx, especially spending on machinery, equipment and internal-use software correlates with iOS device production during the next quarter. It's not a relationship that helps much in quarterly predictions due to the elastic nature of product transitions. There were quarters when spending and output were de-coupled, for example spending in March and June 09 quarters was far lower than one would expect for the 3GS launch quarters that followed.
We will have to keep an eye on the change in asset value to be reported for CQ1 to see how the spending ramps up during the year. At this time the company needs to spend at least $6.5 billion in three quarters or over $2 billion per quarter to meet its target for the fiscal year (ending October this year). We have to see whether and why Q1 (fiscal) was too low.
This discussion is also affected by the discussion on Apple's other balance sheet item: cash and cash equivalents. The magnitude of its assets is staggering: $100 billion in cash, $7.8 billion in PP&E, $3.47 billion in acquired intangible assets (mainly patents), and $896 in Goodwill (acquisitions). With this much "capital" the company does not make use of any debt facilities.
In this regard Apple is also an apparent anomaly. As it gets subtracted out of indexes because it weighs too much or skews "reality" so Apple and its balance sheet is causing a warp in "time-space" of capital markets. The traditional relationship between financiers and operating companies assumed some form of symbiosis but as the credit crisis has shown some have not kept their part of the implied bargain.
So we have to ask yet another unsettling question: what is the value of capital markets when their products are commoditized by relatively unsophisticated CFOs?
---
Notes:
This is the material accompanying the third case discussion at Asymconf. Participants are encouraged to read it at the material linked before the show.
It's perhaps fitting that an industry that produces illusions is in itself an illusion. The absence of public scrutiny of its finances and business model leads to a lot of myths or misconceptions. Some of these are discussed anecdotally in books and other works[1], but the absence of data makes the anecdotal evidence unsatisfying to an analyst.
What if we could find patterns in data about the industry to confirm or deny these oral histories? Fortunately some data actually exists. There are collections of data about movies released and some of the attributes of these releases such as box office receipts, theaters opening, budgets (sparsely), and distributors. This data is typically used for marketing purposes to celebrate the "hits" and thus entice more people to see the movies.
However, other information can also be obtained through analysis of the data. In fact, a rather compelling story can be told. That's the purpose of this post. Our story will be expanded over time but this first draft should be enough to allow a discussion to begin. The story is built in four sub-stories:
Drama / Comedy vs. Adventure / Fantasy: Why the Ancient Greeks had it all wrong.
The magic of summertime: Market access and school schedules
The perpetual incumbency: What happens to Hollywood startups
The Popcorn economy: The peculiar power of theaters in an age of television
These stories were the result of observations in data alone. We have no first-hand knowledge of the industry and have only used basic software tools to seek out patterns in public data[1].
The data set includes approximately 12,000 titles released between 1975 and present with various degree of completeness. Some of these years are not completely populated and some data is undoubtedly in error. However the large sample should offer enough substance for patterns to emerge in spite of this.
Drama / Comedy vs. Adventure / Fantasy: Why the Ancient Greeks had it all wrong
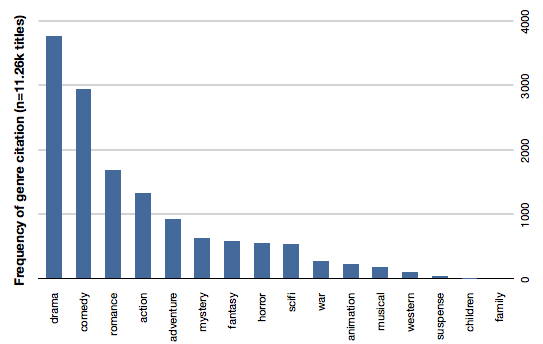
Storytelling has not changed throughout history. The same types of stories affect audiences the same way since stories were first told. The earliest known "genres" were tragedy and comedy and they are still seen as the bedrock of theater today. The same is true for movies. The following bar chart shows the distribution of genres as cited by movies over our data set.
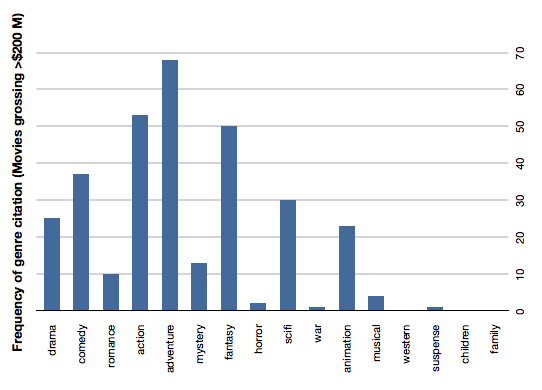
Drama and comedy are about 50% of all movies made. If we add romance they are 60% of cited genres. This is understandable given the history of theater. However the profitability (or revenue potential) of those genres is not as strong as Action, Adventure and Fantasy. The following chart shows the same count of genre citation but only for movies grossing over $200 million (which we chose to call "blockbusters").
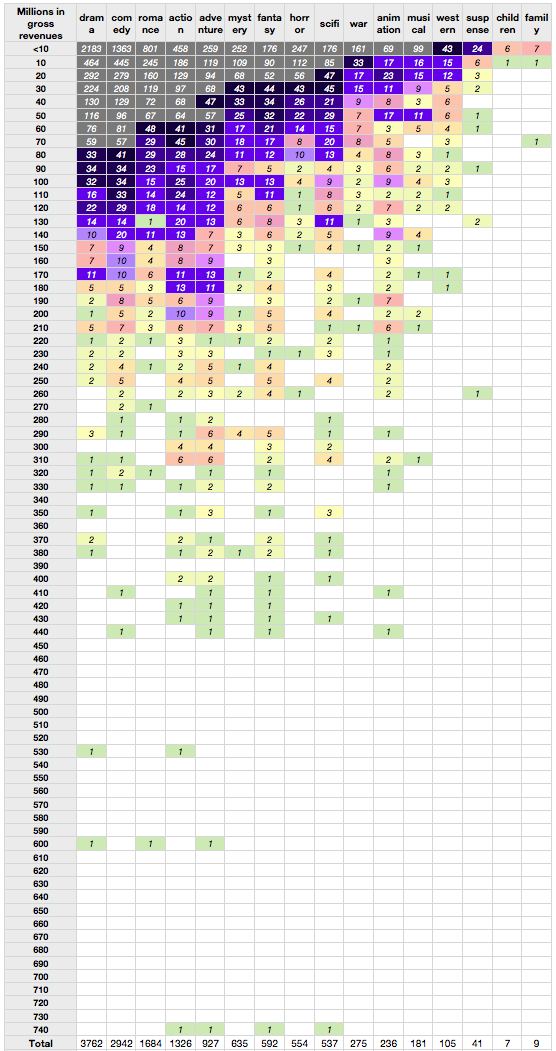
Action, adventure and fantasy handily beat Comedy and even SciFi beats drama. Romance, musicals and and mystery genres typically associated with female audiences are very rarely successful as blockbusters. The overall data is shown in the following table. The rows represent gross revenues and the columns genres cited ranked in order of frequency. One can easily observe the density of low earning drama and comedy (grey colored) vs. the more lucrative instances of fantasy and adventure. These male-dominated genres have consistent success into middle, high and very high revenue tiers.
The reason for this blockbuster attention to action and adventure is probably the prevailing theater-going audience demographic: adolescent males. The industry still produces the classic genres but less profitably than what the current targeted markets.
Indeed, these genres were very uncommon in eras predating the late 1970s. More "adult-oriented" movies like romance (Gone with the Wind), musicals (The Sound of Music) and epic movies (Ben Hur, The Ten Comandments) were common in the "golden age" of Hollywood. As we'll see in the next section, the age of the audience is a now driving more than just genre selection.
The magic of summertime: Market access and school schedules
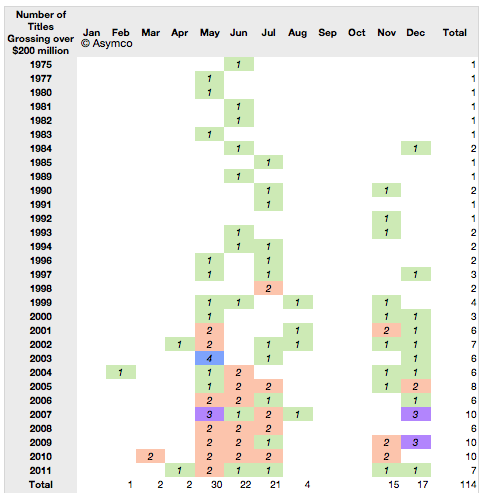
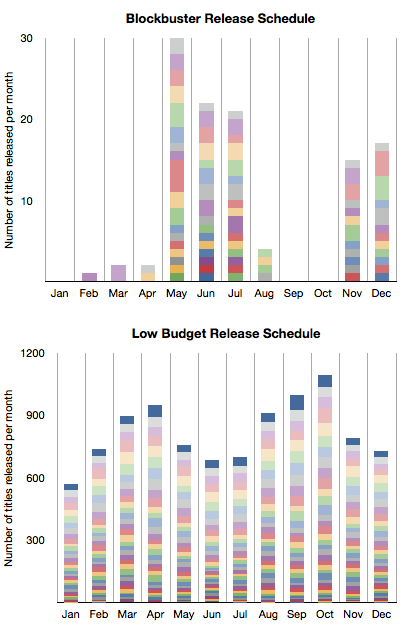
Using the word "Summer" before "Blockbuster" has become almost redundant. What is less understood is that watching movies in the summer is rather a new idea. It started effectively with Jaws in 1975 and ever since major film studios have planned their annual marketing around a summer schedule. There is clear evidence for this in the data. Here is a table showing the blockbuster release months since 1975. (The number of titles grossing over $200 million and the months in which they were released).
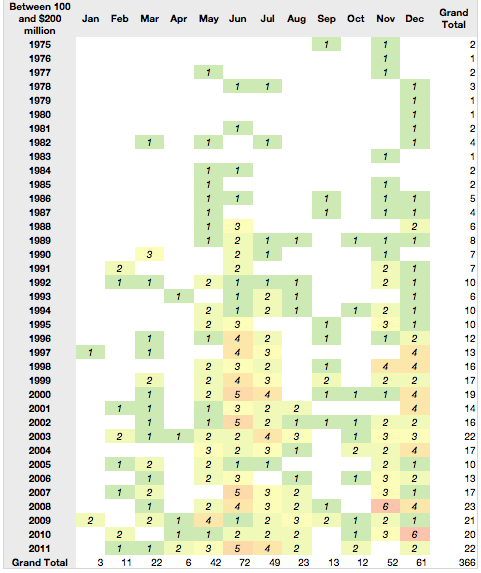
The same pattern repeats for the next tier of highly successful movies--those grossing between $100 and $200 million.
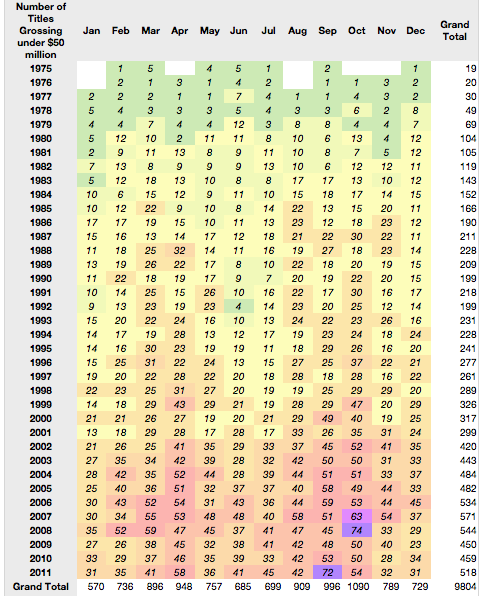
But what about the less successful movies? Those earning less than $50 million actually show a counter-success pattern.
To contrast this further, here is a stacked bar chart comparison between frequency of release by month for the most successful tier vs. the least successful tier (colors represent years with oldest at the bottom).
It would seem that summer and success are in a causal relationship. There is a clear pattern with the only non-summer months having blockbuster releases being November and December.
But there is more to this pattern.
The blockbuster schedule happens to coincide with the school holiday schedule in the US. This again points to the "profitable" audience being school-age children, and mostly male.
The perpetual incumbency: Where are the Hollywood startups?
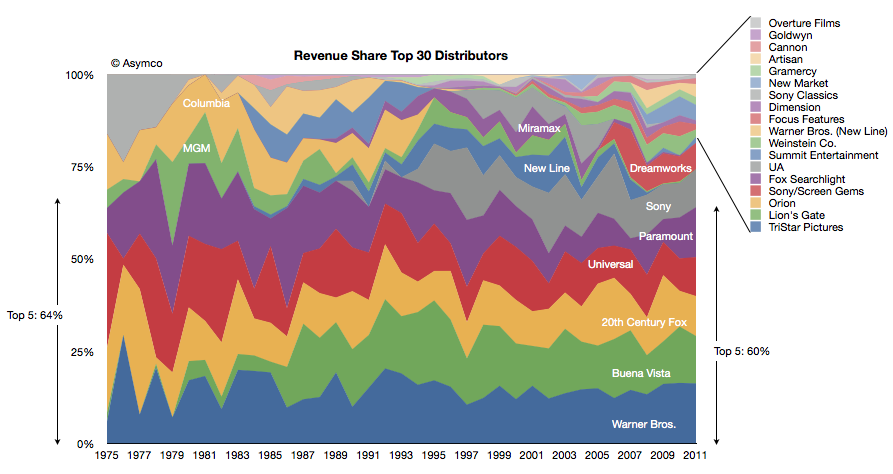
The third observation has to do with the major film studios. We took the box office revenues and allocated them to the studios over time. The following chart shows the share of those revenues for the top 30 studios.
The top five were earning 64% of revenues in 1975 and the top five were earning 60% in 2011. One of the top five from 1975 is no longer in the running this year (MGM) and one new major was added (Buena Vista, owned by Disney).
There has been one other notable change: Columbia was acquired by Sony but stayed out of the top 5. Beside Disney there is one new significant entrant in Dreamworks gaining share in the last decade.
But the prevailing impression from the data is that the incumbents remained as such during the last four decades. There are many small studios but they have not "disrupted" the market by shifting significant revenues out of the hands of the majors. Indeed the typical strategy seems to be to start a studio with the hope of it being acquired by a major.
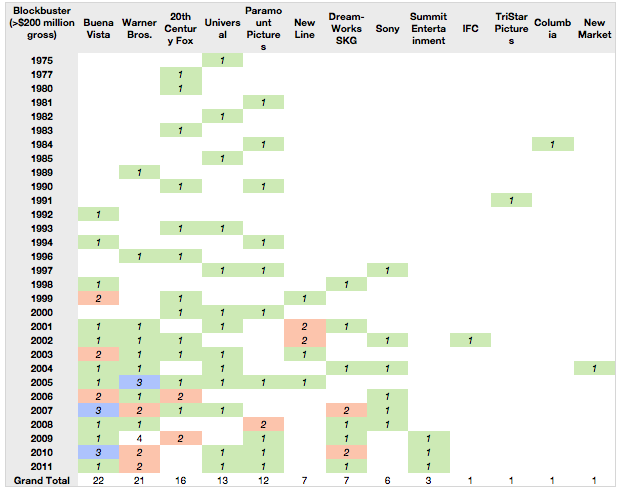
Even the entrants are industry insiders: Disney and Dreamworks are not asymmetric in their business models in any way. In fact, when viewing the data by blockbuster creation, the majors feature prominently. There are only a handful of blockbusters from the smaller companies.
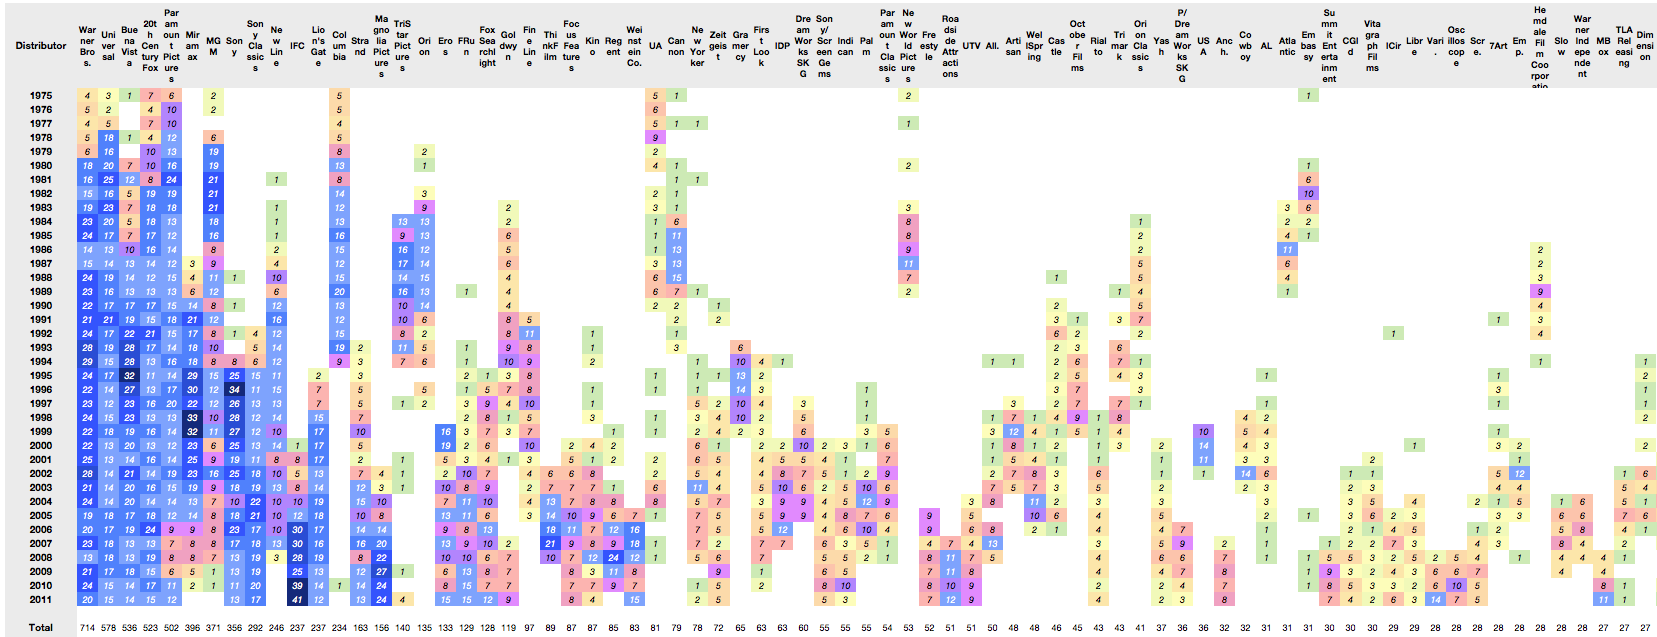
When looking at overall production rates, again the majors (and their subsidiaries) dominate. Here are the top 75 distributors of movies showing nearly 9000 movies (click image for full-size):
The conclusion from this data might be that Hollywood does not change all that much in terms of who makes the money. But that itself is a symptom of a deeper reality: that there is little that changes at all.
We can even perhaps hypothesize that there is no business model innovation taking place. Any such innovation is usually manifested in a reversal of fortunes for incumbents.
But technological change is happening. The following section describes how this appears in the data.
The Popcorn economy: The peculiar power of theaters in an age of television
The data we are sampling (box office gross revenues) is actually a small and shrinking subset of what movies generate. In addition, there are international revenues, media sales (DVD, video tape), TV rights, and merchandise to name a few. But theaters are still an important part of the picture.
Although they make up less than 20% of gross, their importance is disproportionate due to the signal they send other markets about the popularity of a movie. In other words, a movie must first be proven in a US theater before its value is priced by the other channels.
However, this essential theatrical release has changed in one fundamental way. Releases are now geared for larger initial scopes with shorter runs and less dependency on "word of mouth" to increase sales.
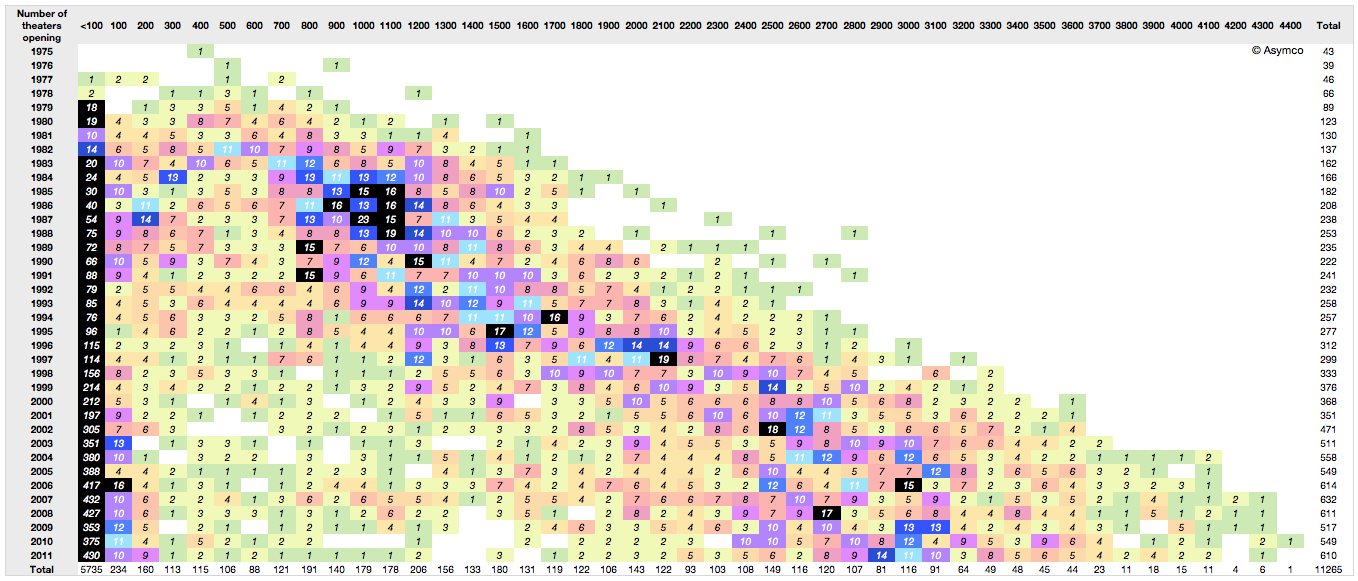
Consider the following view of release breadth (how many theaters are in an opening) by openings over time. The columns represent the number of theaters used in the opening of a movie in increments of 100. The rows are years. The cells contain the number of movies opening with that size footprint.
The pattern shows the number of theaters used in openings increasing steadily. the mean number of releases is shifting to the right. Part of the reason is that theaters shrank in size over time, but there is also the factor of needing to create a large audience at the outset of a release. The increase in "footprint" at launch (a factor of 10) is in excess of the slicing of theater sizes (a factor of two)
This broadening of launch is coincident with a decrease in viewers. As a result the notion of how movies are marketed has changed. The idea that a movie could start small and gain a following gradually through word of mouth is obsolete. That low cost approach to marketing (called "earned media exposure" in marketing) is unreliable and completely discounted.
Instead, studios manufacture an audience through paid advertising and promotion. This initial burst of viewers is essential not just for generating revenues. It's essential to driving long-term revenues.
The reason is that technology now allows the movie to be "monetized" through multiple channels. Recorded media, broadcast rights and even in-flight entertainment are all there to milk a franchise. But there is a need to get that initial vote of confidence from one crucial audience. That happens to come only from theatrical release.
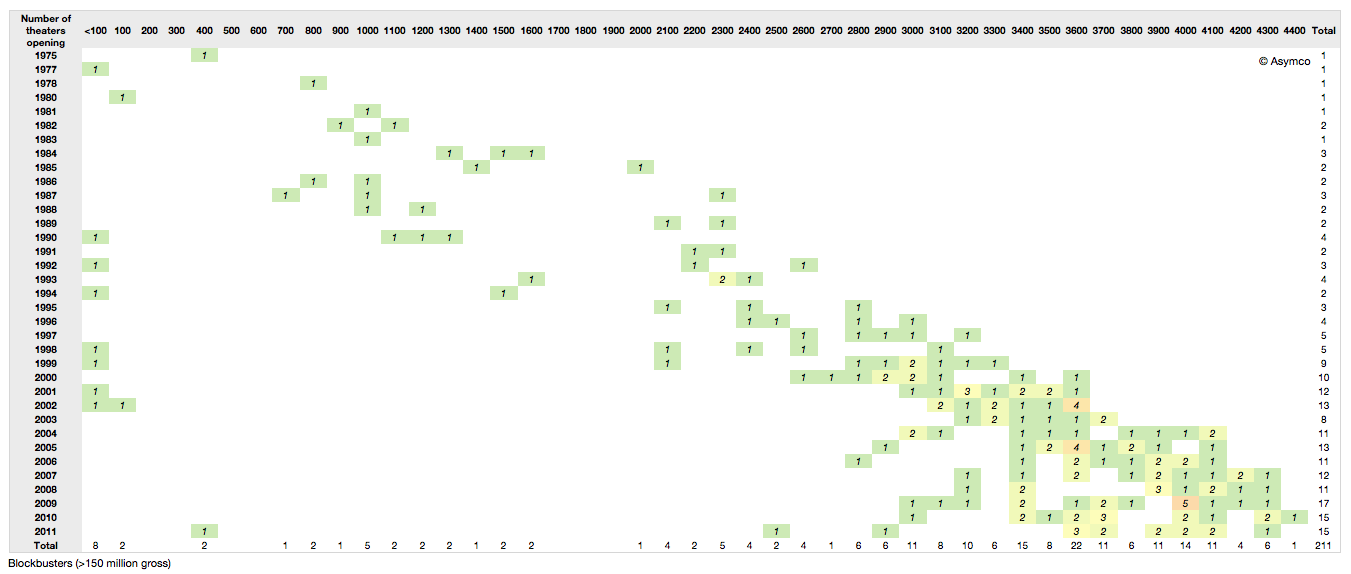
So with the scheduling pressures, the narrow window of purchased release buzz, the onus is on a broad release as quickly as possible. This holds especially true if we filter out only the blockbusters. Note how the release has increased steadily as well and that since 2000 all blockbusters released to over 3000 theaters. Compare that to Star Wars in 1977 releasing to only 30 theaters.
Data sources: Coolector, Imdb, BoxOfficeMojo, The-numbers.com
Many thanks to David McCandless and the Information is Beautiful folks (http://www.informationisbeautiful.net) for setting up the Hollywood Budgets Award that provided us with much motivation for researching this topic.
Here are the highlights from RIM's latest quarter:
14.1 million BlackBerry smartphones shipped, 13 million sold through
150k PlayBook shipped with sell-through slightly higher. 800k PlayBooks shipped so far.
BlackBerry subscriber base up to 75 million
High growth cited for U.K., France, South Africa, Mexico and Argentina, Indonesia, Saudi Arabia and South Africa. RIM is the #1 smartphone vendor in the Latin America and Caribbean region. Sales outside the US, UK and Canada were 61% of revenues. US is now 20% of sales, UK 11%.
Hardware growth outside the US was 56%
There are 630 carriers
50k apps in App World with 5 million downloads per day
Forecasting 11 to 12 million smartphones next quarter
Given the channel fill with a new product, the device business was marginal at best. The company obtained -1% growth y/y in units but 31% sequential growth from a transitional quarter. The average selling price (inclusive of service revenues) is $354 and about $280 excluding service revenues. I estimate that operating margins have dropped to about 11%. Not a good story, but one we have been warned to expect.
But a crucial new twist to the story is that RIM announced that they don't expect new BlackBerry 10 devices until late next year. That came as a surprise and the stock sold off significantly, valuing the company at well below book value.
Stepping back, the biggest surprise is that the company seems to have had no plan for sustaining itself.
Let me explain.
If you go back to 2005 or so the world of smartphones was a mix of modular OSs and integrated platforms, much as it is today. Not unlike Android today, Windows Mobile was successful in licensing to dozens of vendors who in turn released hundreds of products. Symbian also was licensed but most volumes came from Nokia and they held the lion's share. Then there was the BlackBerry integrated solution which worked smoothly and had devoted fans who upgraded every chance they had and operators who were joyous at the new ARPU. There was also PalmOS as offered by PalmSource trying to be a "third horse" and unseat stodgy old Microsoft.
It was into that fray that both Apple and Google jumped. Google acquired Android in 2005 and Apple was busy polishing a version of OS X that would became iOS. In three and two years respectively these platforms would be in the market.
Regardless of the actions of rivals, all competitors must have faced the same questions in 2005: As technology was changing rapidly and as they all had access to component roadmaps, what is the best technology approach to this market? Should they embrace certain innovations to sustain their business trajectory? RIM had a tightly integrated software, hardware and service offering. What could make it better? Nokia was also basing its products on a more loosely integrated offering (nominally it was modular, but only just). It saw the writing on the wall and began developing a Linux variant (Maemo) as a potential candidate to replace Symbian. Microsoft was basing its solution of a modular approach. Windows CE was ok as a kernel but they had layers on top which were optimized around stylus-based user experiences (analogous to mouse actions). Could it take on a rich computing experience?
There were many experience candidates. Stylus, keypad, keyboard all had adherents. There was a lot of hesitation. After the iPhone launched with capacitive (finger) touch, resetting user expectations, it still took a year for many of the vendors to re-consider their technology plans. The weakest changed first.
Microsoft felt the pain quickest. They also had the least to lose since revenues from Windows Mobile were paltry. By 2008 internally they turned 90 degrees. They embarked on re-building their user experience and orphaning the Windows Mobile ecosystem and many of the vendor relationships they had built. Palm dropped PalmOS and built WebOS internally quite quickly. They licensed Windows Mobile as a stop-gap. Around the same time Nokia doubled down on Maemo and joined with Intel to form MeeGo. They did not orphan Symbian though and kept trying to adapt it to the new experiences and input methods.
But RIM did nothing. Almost nothing. They were the healthiest competitor. They felt no pain from iPhone's entry. The platform they had built was still growing and they were tweaking it constantly. There were always improvements to point to but fundamentally the code was limited. It was very difficult to adapt it to touch input and the first attempts at a touch UI were embarrassing. But there were no signs of a new platform that reflected the Unix-like competition.
As I pointed out in an earlier post, Unix-like operating systems were having their revenge. To a computer scientist the future of mobile computing would mirror that of personal computing in terms of architecture. The foundations of the early smartphones were built on constraints that were disappearing while being unable to accommodate new input methods. In other words, the early efforts were optimized around those constraints and sub-optimal for rich user experiences. They had to be. There were limited processors, memories and screens and battery life.
It turned out that all the early mobile operating systems were unsuitable for the advances in technology that came after 2007. Companies which were able to adapt or embrace Unix-like operating systems in a mobile context gained the ability to grow with the new input methods. The sooner they "pulled the trigger" on the shift, the better off they were. This is in fact what enabled entrants to gain footholds. Entrants entered with Unix-like OSs straight away while incumbents had to justify changing and the more successful they were the harder it was to justify changing.
RIM had trouble justifying this change. It waited until 2010 to finally acquire the QNX asset that would offer them a stronger software foundation. It still had to adapt this acquisition and it looks like it won't be done until at least 2012, seven years after they should have started. And this should be seen as a sustaining technological change. A new OS is not a disruptive technology to what is already a mobile computer.
However, delays like these can be fatal. We see the impact on Microsoft who was earliest to push the reset button in 2008. It still took two years to rebuild Windows Mobile into Windows Phone and is now still struggling to regain lost share (less than 2% today). We see the impact on Nokia which was unable to affect a transition to MeeGo due to a litany of issues and had to throw in the towel on self-determination. We see the impact on Palm which lost its independence as WebOS was a bit too little too late.
These companies had the right technical strategies but suffered from execution and business architecture issues. RIM is years late in embracing what appears to be a sustaining improvement.
But whenever you see what appears to be a coordinated effort by companies to fail simultaneously you have to ask if the change they struggle with is really sustaining or disruptive. The pattern makes me suspicious that what RIM, Microsoft, Palm and Nokia faced was more than a failure to embrace a sustaining improvement. I suspect that the failure is evidence of tectonic shifting of business models.
Here is a discussion of the changes since the last analysis:
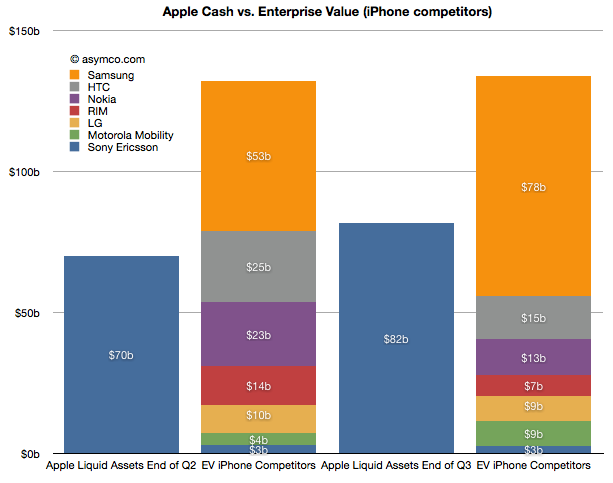
Sony Ericsson was valued through its acquisition by Sony. We did not have a way to value the enterprise before as it was not traded independently. Last June I estimated a 14x multiple on its trailing twelve months' profits and got $3.0 billion. Since then half the company changed hands for about €1.05 thus yielding a total company value of $2.8 billion. The enterprise value should be therefore slightly lower but I'll stick with the current transaction value as the EV.
Motorola Mobility has entered into an agreement to be acquired by Google for $12.5 billion by Google. The company's enterprise value jumped as a result to about $8.6 billion.
RIM's share price collapsed and it's now also trading at an EV of about 7.3 billion (Yahoo finance).
Nokia's price has also dropped and it now has an EV of about $13 billion (Yahoo finance).
HTC recently dropped significantly in price and is now worth about $15 billion EV. (Note that pricing of its equities is subject to suspended trading due to drop limits).
LG's phone business is still losing money and it's still difficult to value. In November it was revealed that the company was seeking to raise $890 million in capital to fund new initiatives including smartphones. The share price fell by 14%. In June I suggested a nominal value for the phone business of $10 billion. I think that's very generous and with recent events I would place that value at $9 billion today.
Samsung's fortunes have increased. In June I applied a 14x multiple to their trailing 12 months' operating earnings. Given overall discounting of the sector I applied a multiple of 13 today. That yields a business value of $78 billion. Interestingly, that is larger than the value of all other competitors apart from Apple. That also makes it six times more valuable than Nokia.
Apple's cash and cash equivalents and investments grew by about $12 billion and were worth about $82 billion as of October.
In summary, in June Apple's cash was about 53% of the sum of competing phone vendor enterprise values. Today it's about 61%. Excluding Samsung, Apple could buy the industry and still have $25 billion left over. This makes the claim that "Apple could buy the industry" even more believable.
This analysis is mainly academic. It does not imply that any such transaction will take place. As the purchase of Motorola shows, control has a premium and individual buyers may be less "rational" than markets. What it does show however is that the entire industry is in a state of crisis. Valuations for phone companies are collapsing and two major brands (Motorola and Sony Ericsson) are being absorbed and could disappear.
At the same time entrants are arriving with completely different business models. Amazon, Facebook, Baidu, Alibaba are intent on selling phones or platforms to be valued as enablers for asymmetric business models rather than as phones. One could argue that what Apple itself sells is more than hardware and that its value-add "on top" of hardware is increasing. This is a sign of commoditization. Certainly the voice business is well beyond that point but it now appears that even the smartphone business is already in an advanced state of value compression.
All the while the overall market is growing. I had separately looked at the profit pool and concluded that the brands are suffering. Summing up the votes from stock markets, the sentiment is even worse. 2012 is looking more and more as a year of inevitable and dramatic industry change.
I began thinking carefully about Apple in 2005 when the stock was priced at around $55/share. I remember that the events which made me consider Apple in a different light were the launch of the iPod shuffle and the launch of the Mac mini. Both moves signaled to me that the company was serious about competing with non-consumption. At that point I thought that the company was a potential opportunity as an investment.
But I also remember that many people at the time thought that the stock price was too expensive. At $50, the company was much more expensive than the year before. The stock started 2004 at about $11/share. The reason it had climbed so much was that the iPod began to be a real world-wide growth phenomenon. Buying Apple was buying into the iPod and many said the price was unsustainable given such a strong dependency on fickle consumer tastes. It was a much riskier proposition than that of competitors like Dell and HP which made product for reliable buyers like enterprises.
Indeed, by 2006, the shine was off. In the first half of 2006 the stock collapsed from $85 a share to $50, a fall of 40%. It was becoming clear that with mobile phones taking on more music playing features, the iPod was not going to be a big story for long. What's more, Apple had just announced that they were switching to Intel for the Mac product line. Investors saw just how vulnerable the company still was and considered that the Mac brand was in jeopardy as it transitioned to becoming a Windows-friendly machine.
However, in 2007 the company's value recovered with the introduction of the iPhone. Suddenly there was a new product to drive sales. Nobody knew by how much or how but there was a sense that the iPhone was enough to keep Apple from oblivion.
Yet, again, in early 2008 the company lost 40% of its valuation. In a rather inexplicable period following the launch of the MacBook Air, the company's shares went into free fall. Inexplicable because the company continued to deliver solid growth with 2008 calendar quarters showing between 32% and 155% EPS growth.
Then the recession came. It caused another 40% share price collapse. Growth slowed to a range of 11% to 61% during 2009. As the marco "headwinds" blew over, by the end of 2009, with the help of a lukewarm response to the iPad, the company's value recovered to its 2007 level. In the mean-time its earnings more than doubled.
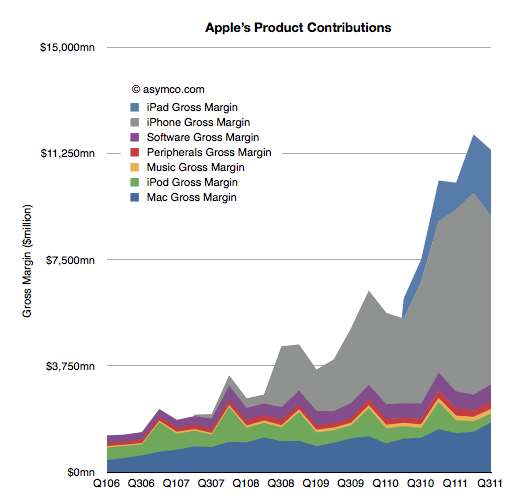
It may not appear to be the case, but throughout this volatile period, the investment thesis remained fairly constant: Apple is a rather small collection of product bets. Owning Apple meant riding the iPod or the iPhone or the iPad as waves of growth. As soon as one growth wave was seen to start to fade, investors would say the same thing: Apple is done.
The chart below shows just what that looks like in terms of product contribution to gross margin.
The investment thesis is the same today. I've had dozens of conversations with fund managers and if anything, it's even more about betting on products. The iPhone and the iPad make up such a large part of profits that the company seems to be nothing but those two things. So if there is any hint that those products might slow down, the stock is sold off.
What intrigues me about this investment thesis is not whether the signals of growth are interpreted correctly or not, but rather that an investor in Apple in 2006 was considered perfectly rational valuing Apple as an iPod company as much as an investor today is perfectly rational valuing Apple as an iPhone company. Why would anyone buy Apple for any other reason? There is no evidence that Apple can be anything more. Any fund manager positing a different point of view would surely be limiting her credibility.
The consensus is that the value of future, unknown products is zero. Not only that but the probability that there will be any products at all is equally zero. Not only that but whatever Apple does to create new products is not perceptibly valuable. The company is simply the sum-of-the-product-parts and nothing more. Cash flows from current products can easily be shown to be more than the current valuation so even these products are deeply discounted. If and when a new product shows up, it will be considered and maybe if it shows promise, the stock will reflect that, briefly.
A corollary to this investment thesis therefore is that the process of product development at Apple is worth nothing. It does not matter if the company has shown an ability to disrupt and to create new categories. The past is not a predictor. The value of the company is a discounted cash flow of current products--discounted for the odds of commoditization, which are seen to be quite high. A new hit product is a windfall, a winning lottery ticket. Something that you cannot count on.
Think about that in a different context. That's like valuing Pixar on the box office revenues of its current movie. If Cars 2 is not beating records, Pixar is suddenly nearly worthless. The fact that Pixar repeatably creates blockbusters would be seen as meaningless. The way they built a reliable pipeline with predictable cost structures for movie-making is not interesting.
However, the fact is that Pixar did not get acquired on the basis of the last hit it made. It was acquired for its system of production. This can be confirmed not only by the price paid but by the fact that the organization was not folded into the Disney machine. It stands alone and is given autonomy. So at least in the movie making industry, predictability is seen as valuable.
So why is Apple not valued as a process company?
I think the answer lies in the lack of understanding or belief in a theory that predictable success in product development is possible. Until and unless an explanation is available that persuades a majority that Apple is as much a hit factory as Pixar then Apple without the products will intrinsically be valued at zero.
The premise of the stock market today is therefore that being innovative in technology is meaningless. Innovations are valuable but there is no such thing as an innovation process. If there was such a thing then we could measure it and put a number of its value. Until then innovation is nothing more than a spin of the roulette wheel.
As shown in the yesterday's post, in the third quarter, overall mobile phone profitability declined. The eight vendors I use as a proxy showed a total net profit of $8.51 billion, down slightly from $8.57 billion and a drop of $9.01 billion in the first quarter.
Overall, the industry dropped by 1% sequentially but is still up 30% over last year and has a 20% compounded growth rate over a three year period.
Nokia returned to profitability, though at $180 million it's only about 2% of the top eight.
Motorola remained in the red with a small loss of $20 million, an improvement over the $90 million loss of the previous quarter. Motorola is being acquired by Google after an accumulated mobile operating loss of $4.69 billion since the beginning of 2007. It's unlikely we'll receive any updates on performance thereafter.
Samsung had a great quarter with a sequential increase of 19% and year-on-year growth of 130%. The total profit amounted to 25% of the peer group.
Sony Ericsson broke even with about $50 million in operating profit. Like Motorola its performance was barely break-even during the last four years and its also disappearing from our list of independent vendors as it becomes part of Sony.
LG had its sixth consecutive quarterly loss and is now appealing to investors for more capital to continue operating as a smartphone vendor. Raising dilutive capital seems a radical approach and not one that inspires confidence.
RIM had a sequential reduction in profit of 35% and y/y reduction of 30%. The company is exhibiting clear signs of decay and the stock market is valuing the company below book value.
Apple profit dropped by 19% but grew 43% y/y during a transitional quarter. The growth remains 43% compounded over three years.
HTC has a 1% sequential increase but a 78% y/y growth.
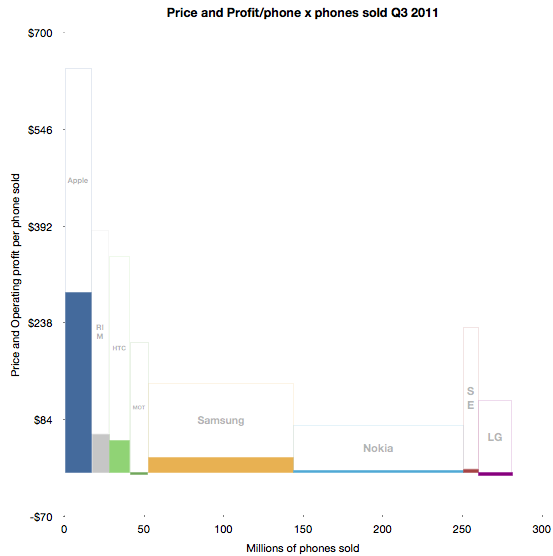
To illustrate the performance in terms of profit, pricing, volumes and margins, I developed the following chart.
The solid areas representing profit are operating profit/phone in the vertical axis and volumes shipped in the horizontal. The blank areas above are the cost of goods sold per phone and the combined solid and blank represent the average revenue per phone.
Some of the areas are over-represented due to the lack of resolution available.
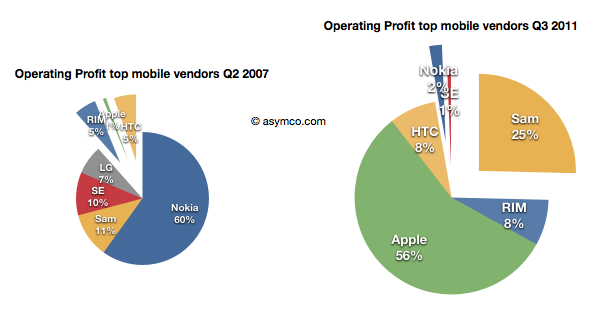
Using before-and-after pie charts for positive profits, we can see how the entrants (RIM, Apple and HTC) went from 6% of profits to over 73% four and a half years later.
I feel that this is somehow the end of an era. I've written before about the brutality of this market, listing 13 companies which were either merged or acquired or disappeared in the last decade. Now both Motorola and Sony Ericsson will soon be added to the list. On average, it's as if one phone vendor has disappeared every year for fifteen years.
And it's still not over. RIM is also becoming a going concern issue, and LG has a big question mark above it.
Of course, ZTE and Huawei and Lenovo are joining the list of competitors but I note that they are not focused on mobile phones. They are opportunistic phone vendors, depending on other businesses to compensate for the risks inherent in phone sales. It's interesting to note that neither Apple nor Samsung are pure phone plays.
In fact, of all the phone brands only RIM and HTC are exclusively phone-only companies. It may indicate something profound is happening. The notion that the development and marketing of phones as an activity independent of other business models may be coming to an end.