In the latest Apple Earnings report, Apple announced a few details that are relevant to the forecast of the business:
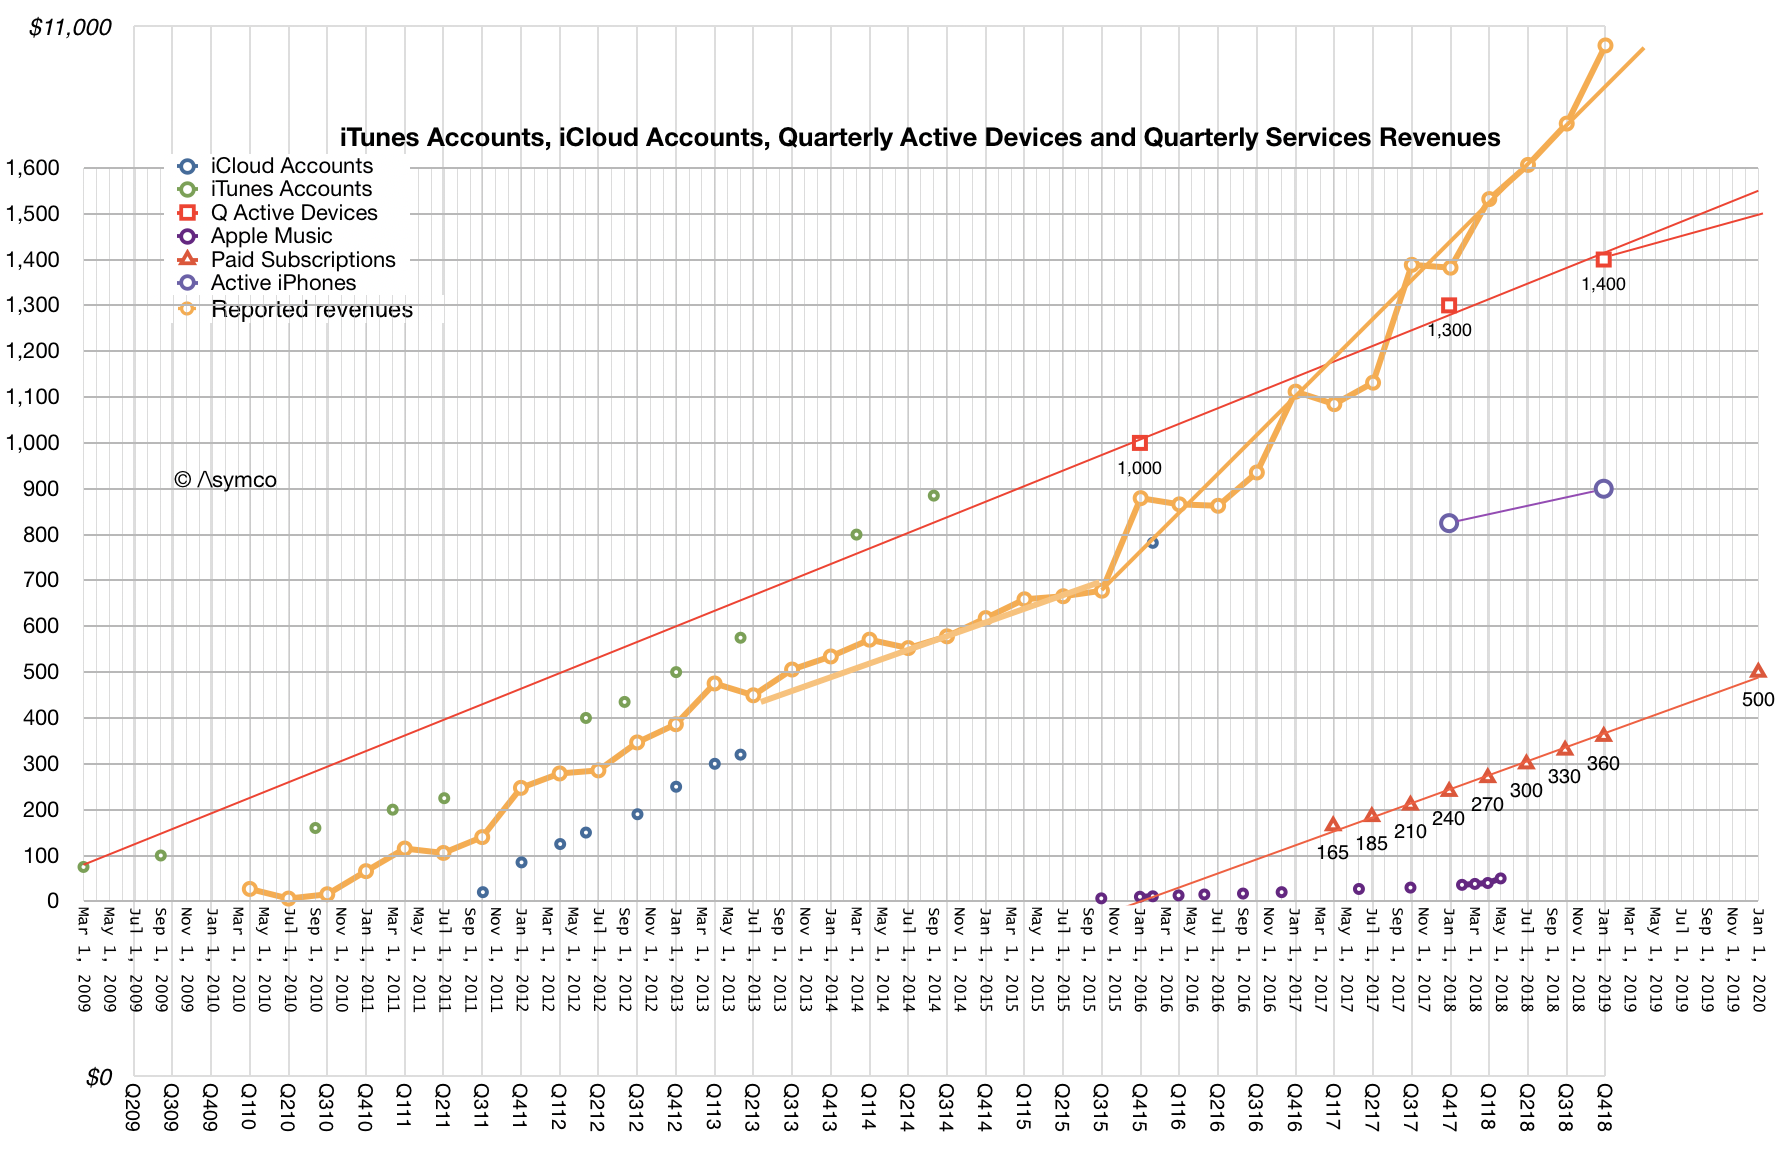
The global active installed base for iPhone reached an all-time high at the end of December, surpassing 900 million devices. This represents growth y-o-y in each of five geographic segments, and growth of almost 75 million in the last 12 months alone
There are now over 360 million paid subscriptions across the Services portfolio, an increase of 120 million versus a year ago. Apple expects to surpass 500 million in 2020.
The installed base grew to 1.4 billion devices by the end of December. This includes all-time highs for each of the main product categories and all five of their geographic segments.
I added all these data points to the previous reported figures related to installed base, subscriptions and Services revenue.
Note that all the data sets show a linear growth path. Most prominent is the paid subscriptions line which is growing at exactly 30 million per quarter. The new projection of 500 million by 2020 is exactly in-line with this projection.
Note also that active devices and iPhones are on similar trajectories. The figure for active iPhones is interesting because it very closely relates to active users. It's extremely likely that 900 million active iPhones means 900 million active iPhone users. An iPhone is useful if it has a data plan associated and it's a costly proposition for most people to have multiple devices and multiple data plans.
This close relationship between iPhone usage and iPhone users means that we can approximate the entire unique user base for Apple. There might be "10s" of millions of users who use Apple devices but don't use iPhones but there might also be multiple iPhones for some users ((I would be inclined to assume that there are more non-iPhone Apple users than multiple iPhone users.))
So it's very likely that the total Apple user base is between 900 and 1 billion. If it's not 1 billion now then it's very likely it will be 1 billion within 12 months.
In May 2010 I made the prediction that Apple would reach a billion users in 5 to 8 years. The prediction was based on the first 100 million iOS users. The company reached one billion active devices in a bit over 5 years and is about to reach 1 billion users 8 years since.
Apple stated in the latest conference call that very little of Services revenues depends on the any previous quarter's unit sales confirming that Services is driven almost entirely from the user base. With almost a billion users, 90+% loyalty rate, 95% satisfaction, 120 million paid subscriptions and 75 million new users/yr, the analysis of Apple as a services company is becoming interesting.
For the last two years I've been studying the transportation economy and introducing the idea of Micromobility. Simply, Micromobility promises to have the same effect on mobility as microcomputing had on computing. Bringing transportation to many more and allowing them to travel further and faster. I use the term micromobility precisely because of the connotation with computing and the expansion of consumption but also because it focuses on the vehicle rather than the service. The vehicle is small, the service is vast. ((If you want to learn about the real future of transportation sooner rather than later, do consider coming to the Micromobility California conference.))
One of the elements of analysis for Micromobility is the notion of Unit Economics. The idea is that each vehicle can be seen as an independent business. It requires an investment, has a revenue attached, requires operating costs and fixed costs and finally, hopefully, generates earnings. A fleet's economics is therefore a multiplication of the unit economics by the fleet size. A similar partial construct exists for mobile network operators where the network revenue is defined by ARPU (average revenue per user). In consumer hardware we also have the idea of ASP (average sales price) and BOM (bill of materials) which describe the revenue and variable cost of each device.
In the case of Micromobility the unit economics is more broadly applied in being an entire P/L statement for each vehicle. One example for the e-scooter sharing company Bird is here. If the unit economics of Bird is consistent across geography and time then the entire business can be valued based on one "average unit". Measuring the health of the business can thus be summarized in BOM, Utilization, Lifespan, Attrition and Cost structure or one unit.
For some time now I've advocated a similar approach for Apple.
The idea is to look at each Apple device sold as a black box that requires investment, generates revenue and, given a certain cost rate, produces a profit. Indeed the company has suggested that this is how it measures itself and has now encouraged us to do the same by withholding measurements that misdirect us away from this method.
Unit sales for Apple are like unit production rate for micromobility. It's certainly important to know how many e-scooters or e-bikes can be manufactured and deployed but it's far more important to know how long each one lasts (lifespan) and how frequently it's used (utilization) and what pricing can be obtained for that use or a per-mile basis.
A restriction on unit production could slow the network's growth but it may not affect the demand measured in miles of distance that users need to cover. A lack of vehicles means users will hire cars or walk or transit or perhaps won't take the trip at all. But once supply is provided the choice of micromodes should compel users to use them.
In this view, the Apple business can be seen as a base of devices multiplied by the revenue per device subtracting the cost.
In the latest letter to investors Tim Cook wrote that the total number of active devices has increased by more than 100 million in the last twelve months. Given that the figure a year ago was 1.3 billion, the current total must be 1.4 billion. We can also estimate that Apple sold about 303 million devices in 2018. This implies 2 out of 3 were replacements and 1 out of 3 increased the base.
Services revenues were about $40 billion in 2018 (up 28%). Total revenues were $261.5 billion.
Thus for the whole of 2018:
$194 per active device of which...
$30 in service revenues per active device
We can repeat the process for costs and earnings.
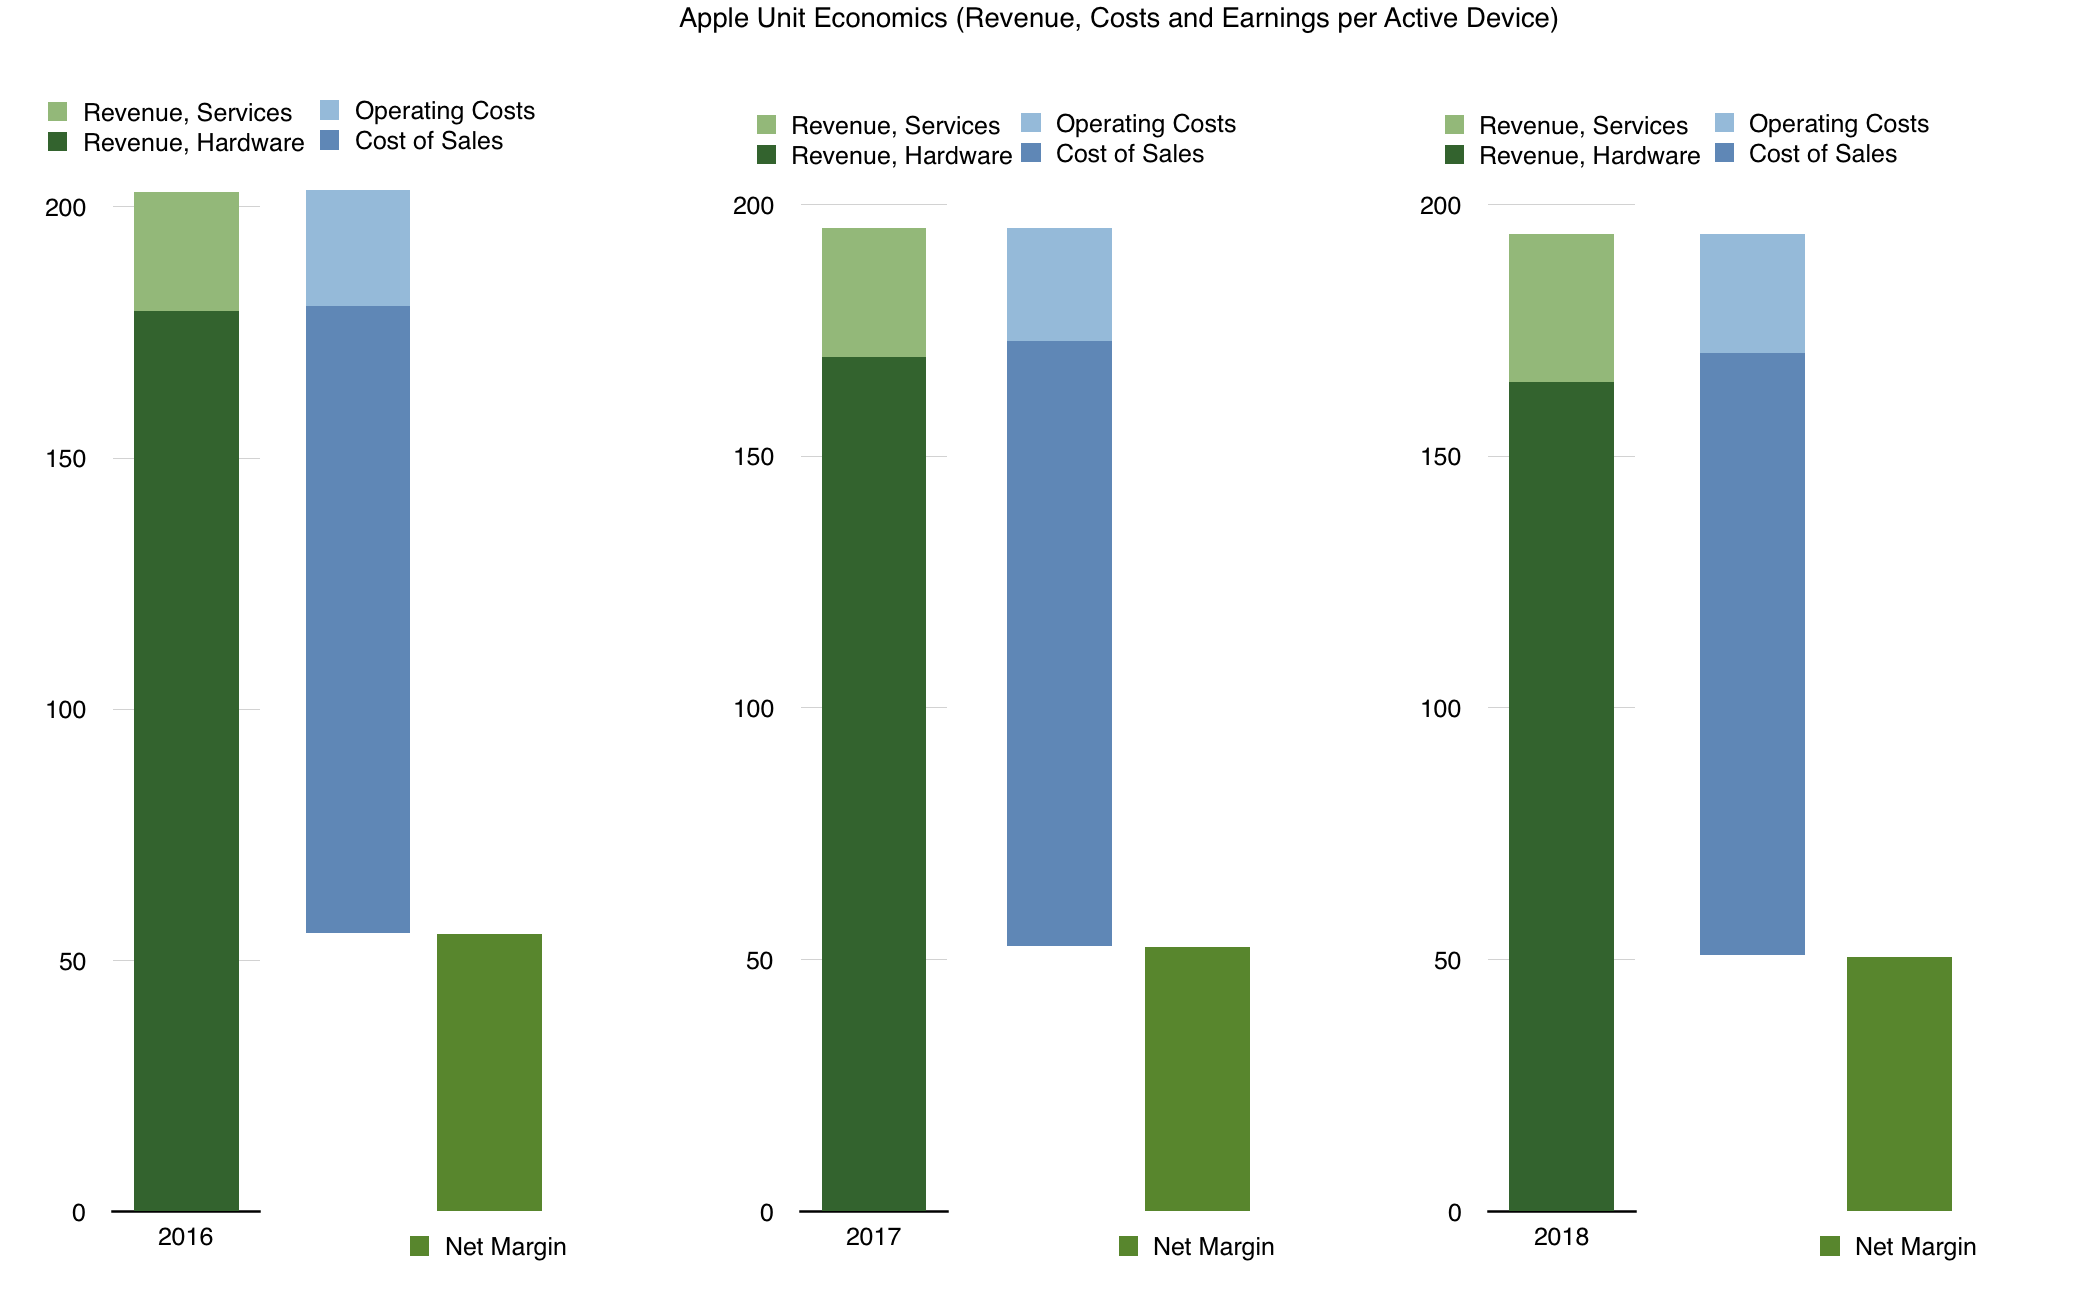
Through this lens, Apple's business over the last three years can be seen in the following graph:
A few observations:
The business is remarkably stable over the last three years.
The top line went from $179 to $165.
The bottom line (Net margin) per device went from $55 to $51.
This happened while the base multiplier went from 1.15 billion to 1.4 billion.
Service revenues are increasing (from $24 to nearly $30)
Seen this way the pattern of service growth at the expense of hardware is clearly evident. This is generally contrary to perception when looking at devices sold per quarter.
This is a three year snapshot but if we were to forecast longer term, the questions that arise:
How rapidly can the base multiplier rise? It had been rising at 150 million/yr for two years and 100 million for one year. What is the likely increase in the future? What is the saturation point? Is it 1.5 billion (which seems a year away) or is it 2 billion or more?
How are services ramping? The revenue per device is ramping in an accelerated rate (from $2/yr/yr to $3/yr/yr). How high can revenue per device rise? Is $50/yr possible? Higher?
Is the ASP increase reducing hardware revenues? This point is contentious and I will write about it separately.
It's going to take a while for this view of the company to prevail but it's clearly the way the company itself operates and how it sets its objectives.
In The Number I provided a model for estimating the number of active Apple devices at any point in time. The relationship between active devices and cumulative devices sold gives us a rule of thumb that says that 2 out of 3 devices ever sold are active.
I propose now that knowing active devices and cumulative devices sold allows one to determine the average device lifespan.
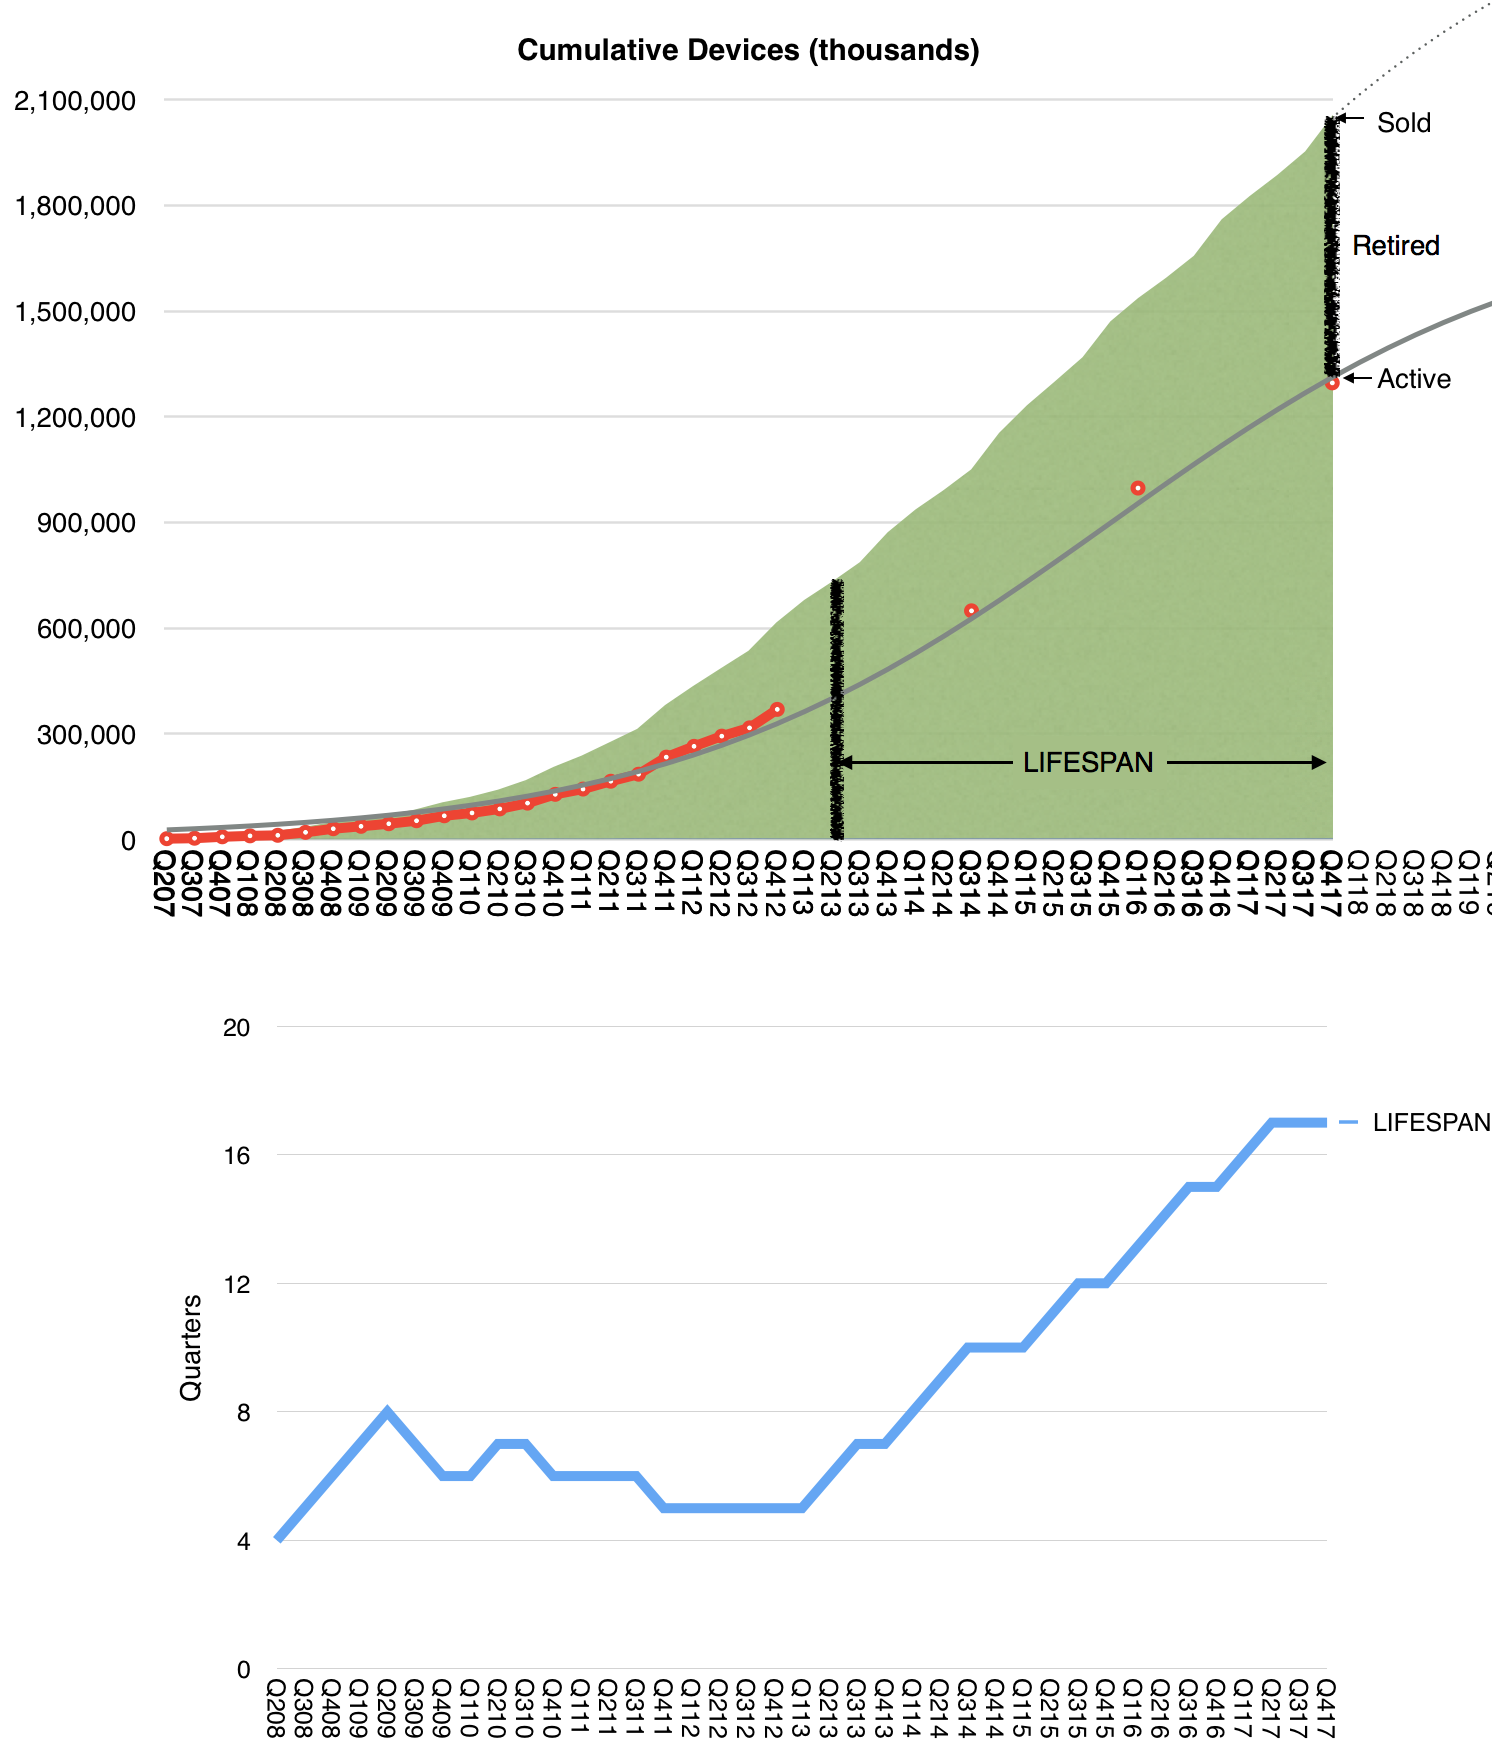
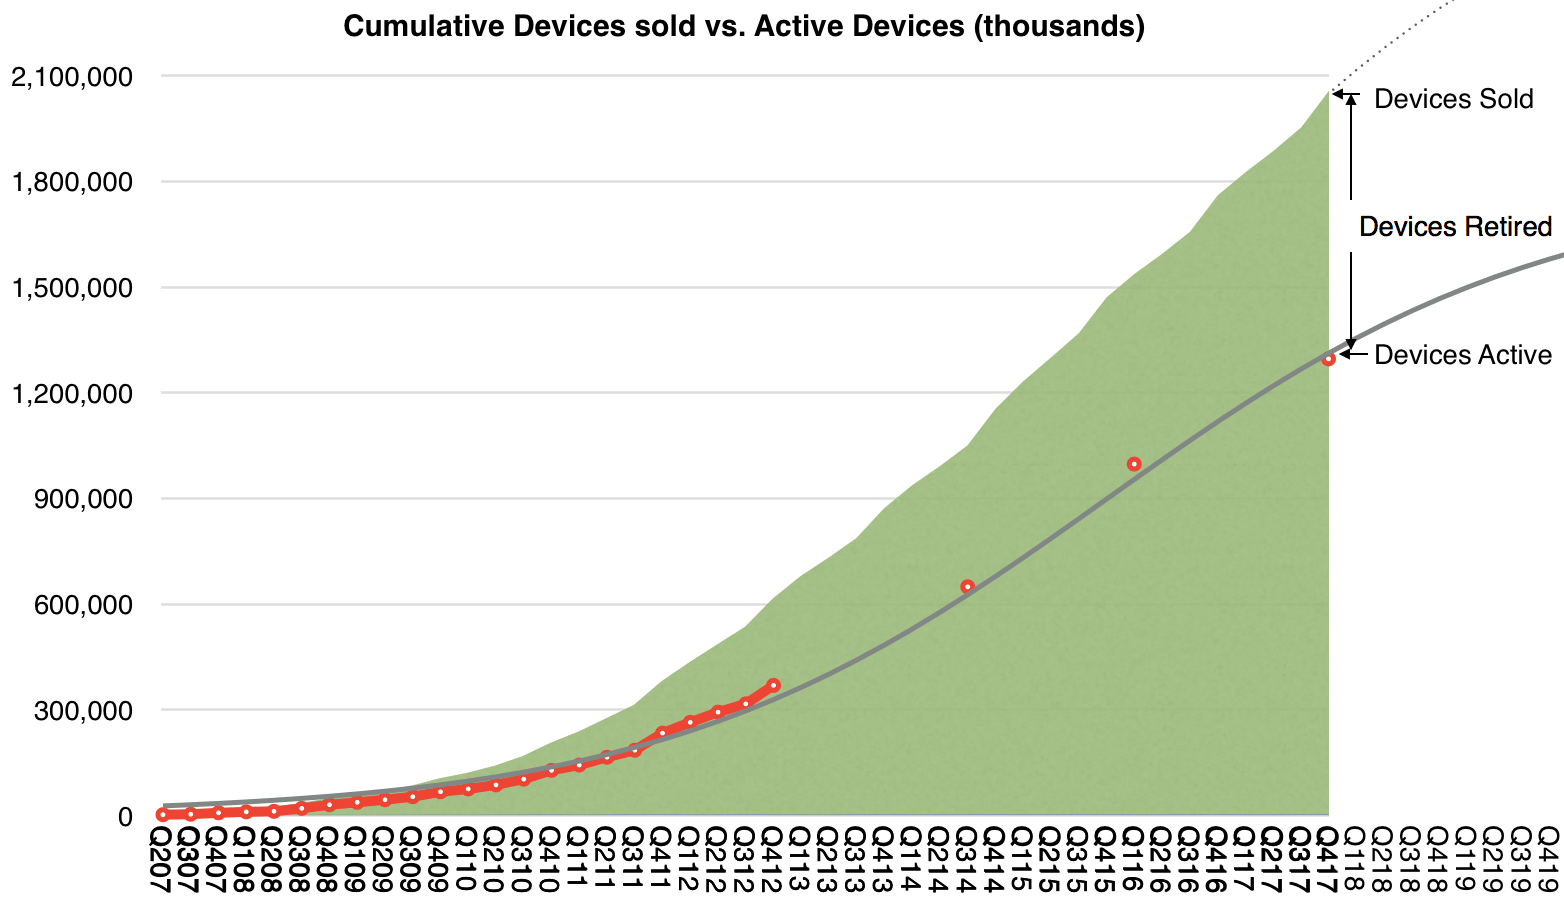
The following graph is a visual representation of how to obtain it:
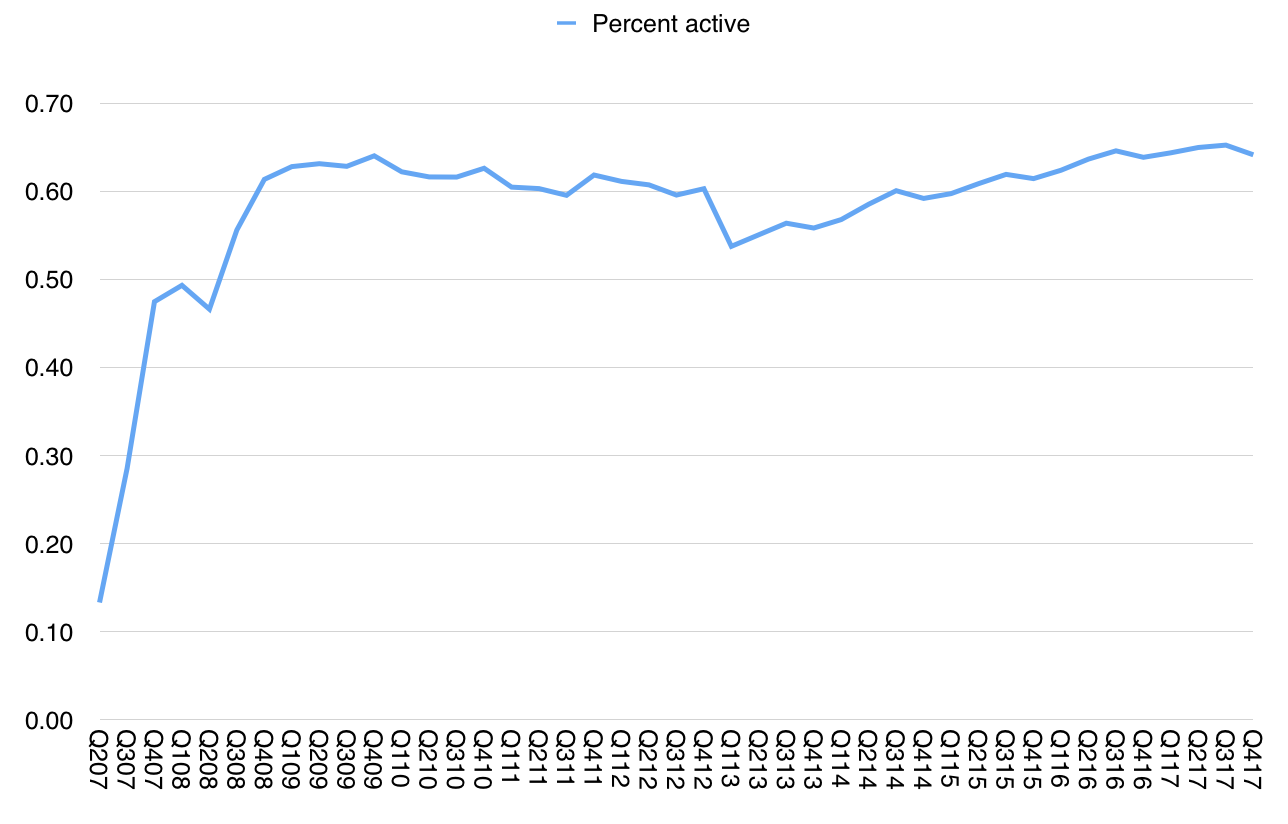
Note that the second graph shows how the lifespan evolved over time.
Here's how to compute this yourself: Visually, the lifespan is the distance horizontally between the two vertical bars such that the bars are the same length. The top vertical bar measures the gap between the area (cumulative devices) and the curve (active devices) and the lower bar is the gap between the area and the x-axis, i.e. the cumulative devices. When those two bars are the same size the distance between them is the lifespan (at the time of the top bar.)
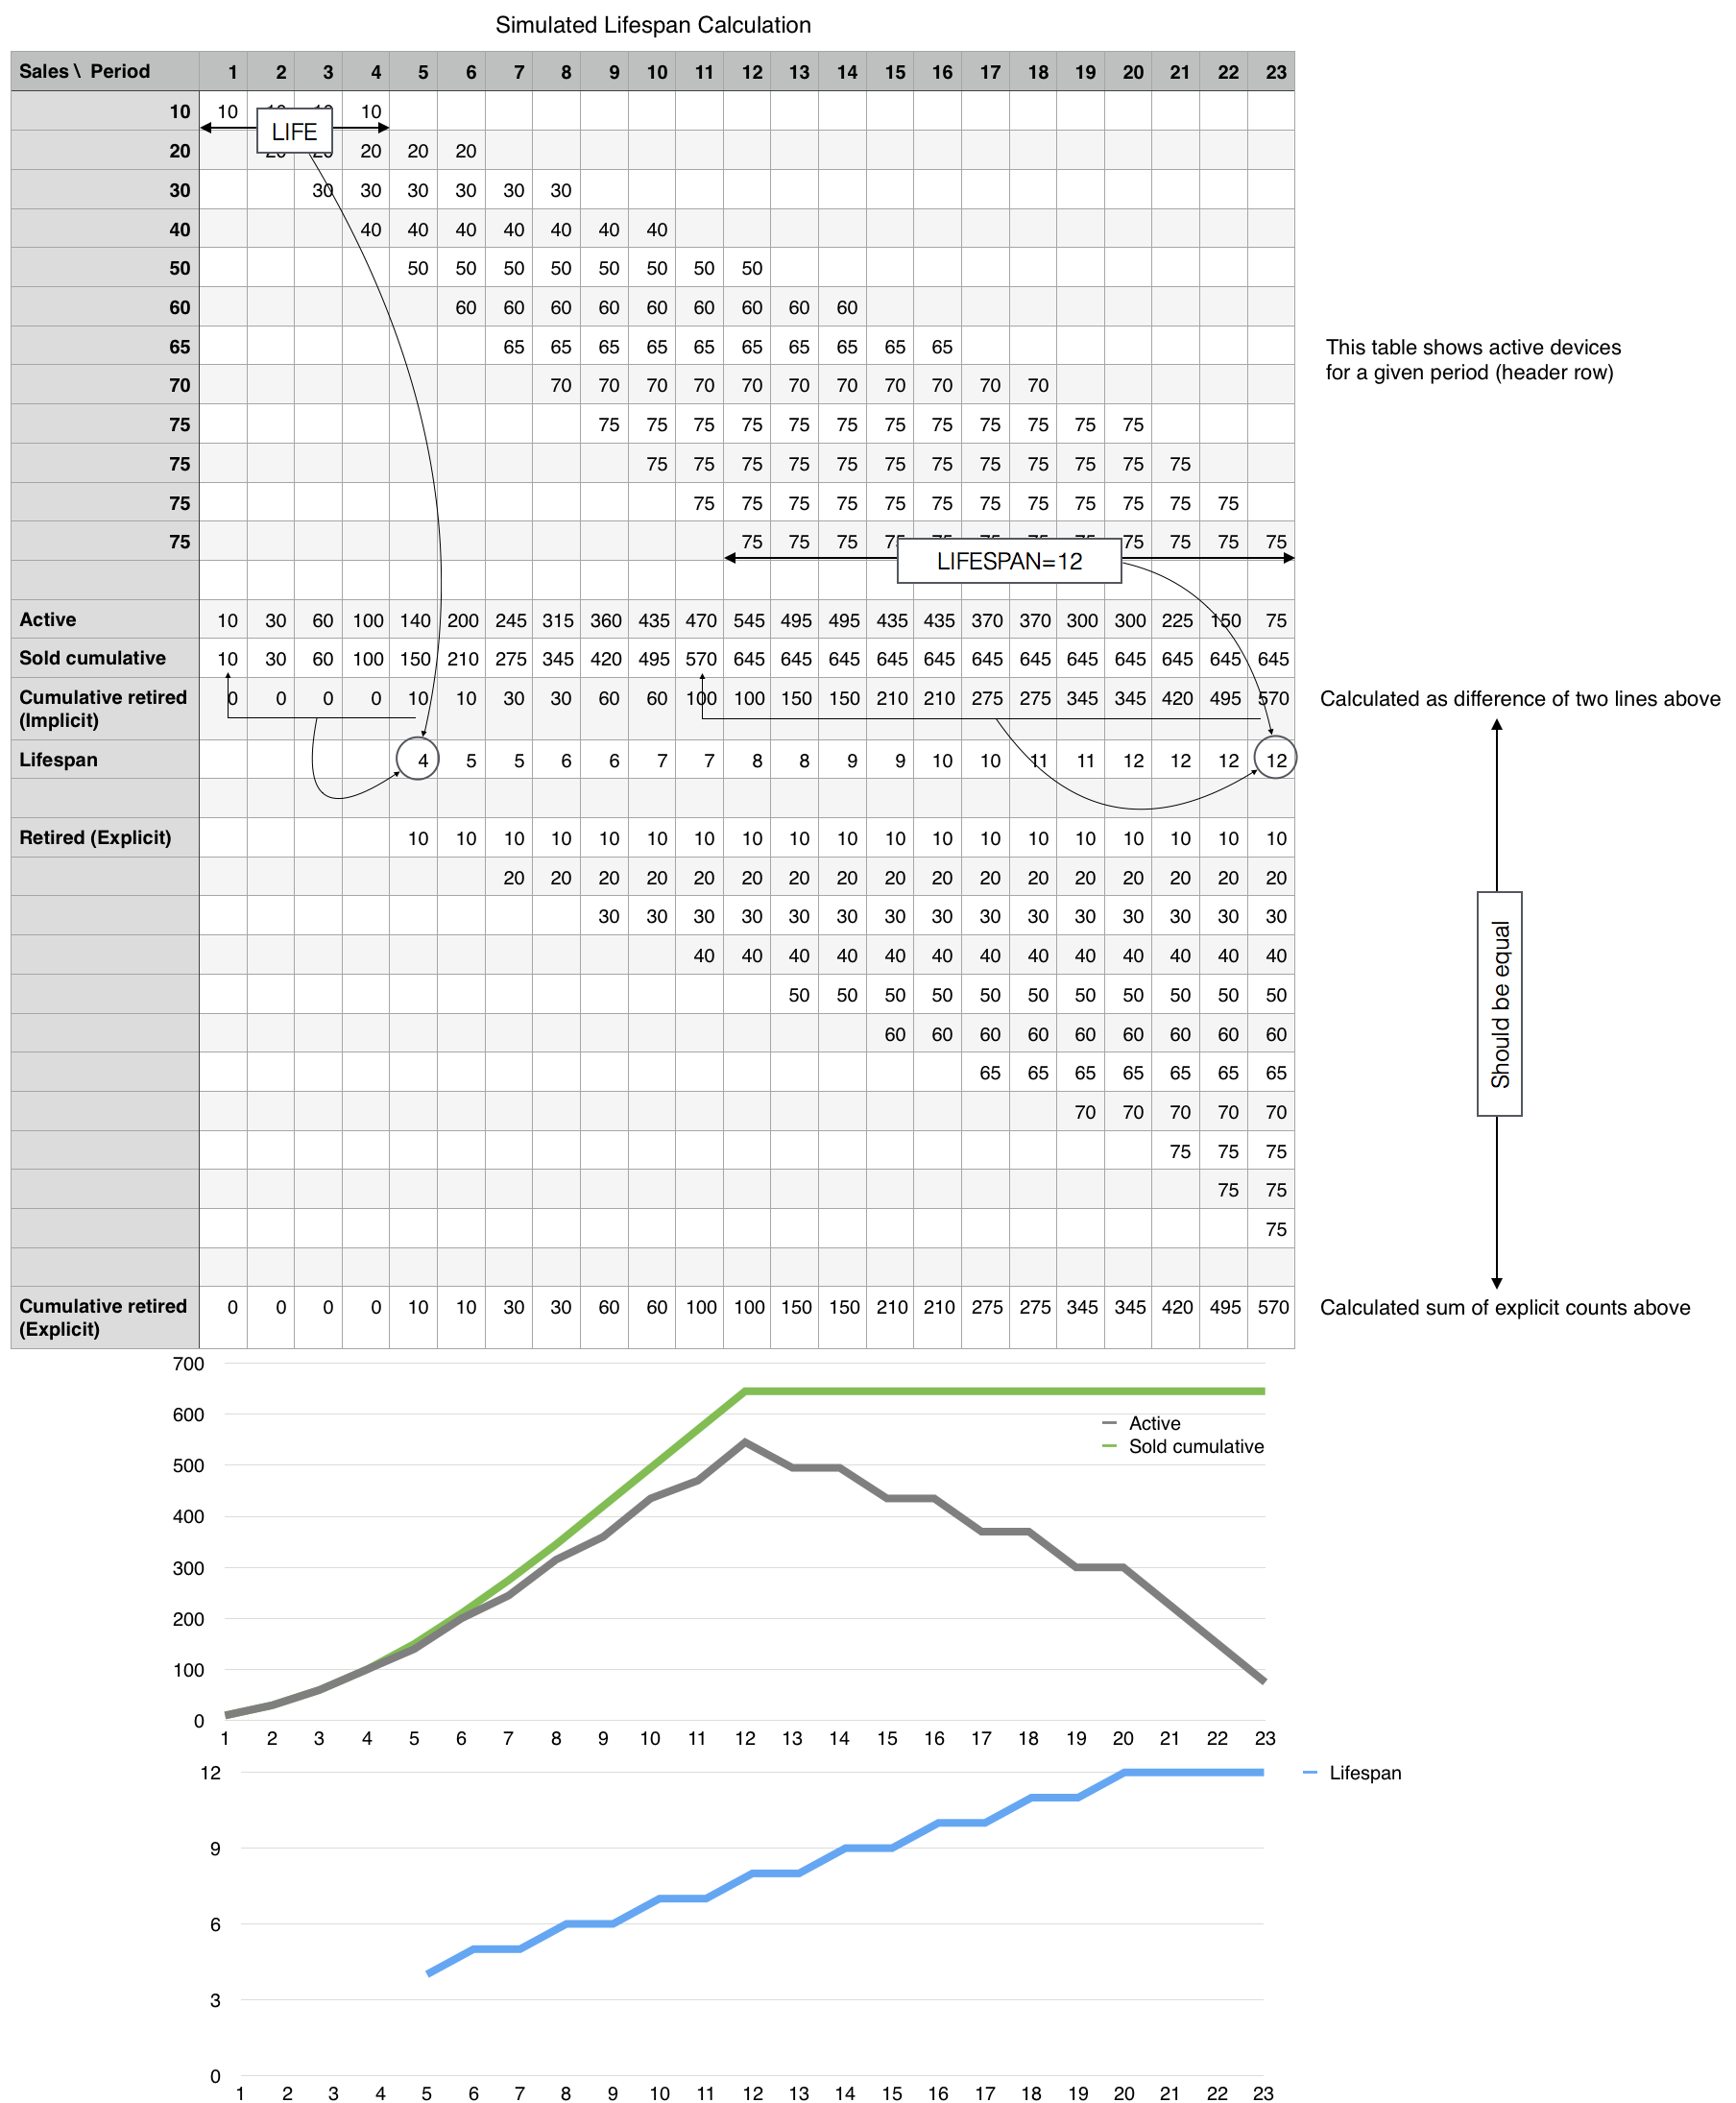
Arithmetically, the average lifespan at a given time t is the duration between t and the moment when the cumulative devices sold reached the cumulative retired devices at time t. ((For a simulation and tabular explanation see below
))
For example today--as the visual above represents--the lifespan is the time since cumulative devices sold reached the current total retired devices. The cumulative retired devices can be calculated as 2.05 billion cumulative sold minus 1.3 billion active or 750 million. The time when cumulative devices sold reached 750 million was the third quarter 2013. The lifespan is thus estimated at the time between now and Q3 2013 or 17 quarters or about 4 years and three months.
Note that cumulative devices sold includes Macs, iPhones, iPads, Apple Watches and iPod touch. Since (apart from the Watch ((Which I calculate to a satisfactory precision here)) ) this information is public, the only figure needed to determine lifespan at any time is active devices and that total is available through the logistic fit described in The Number.
In The Number I argued that active devices is a breakthrough in quantifying the value of Apple's business. The first insight is into the size of device (read: user) base, the second is in the resilience of that device base (2/3 in use). Now we see the third insight: the specific length of time or duration of use per device--a proxy for user satisfaction and loyalty. This I (and Deming) argue, is the most important measure of the health of a business because it speaks of the future and not, as all other figures do, the past.
I'll show in the next post how this single number allows us to calculate the net present value of Apple's future cash flows, or, by definition, Apple's enterprise value.
The first number that Tim Cook mentioned in the fourth quarter investor conference call was the number of active Apple devices. The 1.3 billion monthly active devices is the most important measure of the health of Apple's business. It's the primary way the company chooses to measure itself and it's the best instrument available to understand the company's strategy.
This is only the second time this number was revealed. The previous figure, given in January 2016, was 1 billion active devices. Thus, while Apple sold 586,744,000 devices ((This is an estimate that includes Macs, iPhones, iPads and Apple Watch but does not include Apple TV or accessories such as AirPods.)) the number of active devices increased by 300,000,000. While the number of units sold is frequently updated and attracts a lot of attention, the number of units active is very infrequently updated and attracts little attention. Yet the number of active devices speaks of the future of the company and should be carefully scrutinized while the number of devices sold speaks of the past and should be cursorily glanced at.
Dr. Edward Deming once said that the numbers that best define a company are two factors that do not appear on any financial statement. These factors are the value of a satisfied customer and the value of a dissatisfied customer. These factors must be multiplied by every other number in a financial statement in order to assess the prospects of the business. A high satisfaction leads to repeat purchases and referrals, growing the business; while a low satisfaction leads to ending relationships and a repulsion of potential new customers.
These numbers determine everything about the future and nobody quite knows what they are.
It's tempting to suppose that, by asking, you can find out if customers are satisfied. Certainly the company cites these answers to the question of satisfaction and it's partially useful to have some data. But customers are people and people are social beings. They are flawed in that they want to be liked and will use their powers of deduction to determine whether what they say will lead to their being liked more. Thus they will say things which they judge the listener will want to hear.
This auto-suggestion is especially likely when the answer (satisfaction) is so difficult to ascertain and the feeling is so fleeting.
You can't rely on surveys alone to know if people like your product. You have to base that number on what they do.
This is where the active device data comes in.
A liked product will be used and a well-liked product will be used more. Usage is valuable not just in its intensity but also in its duration. When you see activity of a device it's always a good sign if that is both frequent and long-lasting.
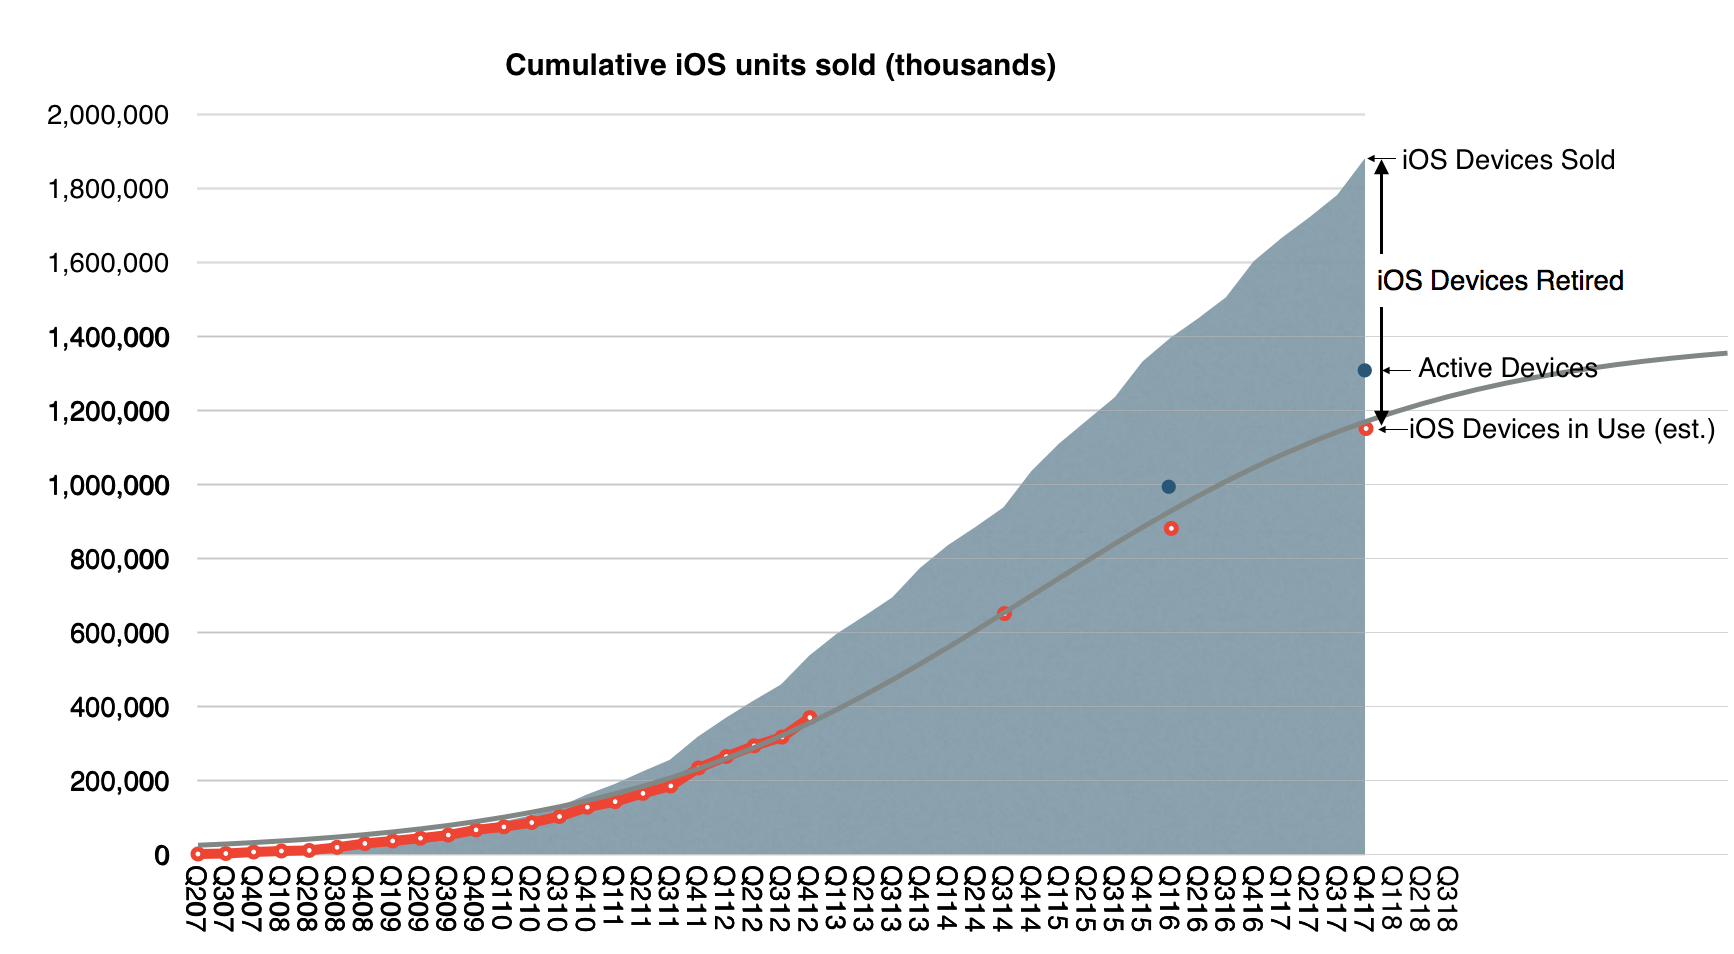
The following graph shows the history of cumulative devices sold by Apple since mid-2007, when the iPhone was launched. That total is now 2.05 billion devices. I have added early estimates on the number of active devices (in red) based on assumptions about product life-span. I added the company's own reported figures since then.
I then tried to paint a continuous curve for this active number using a logistic function which assumes a diffusion into a population of addressable users, shown as the grey line above. The logistic curve is a good tool because it has a solid theoretical foundation in social behaviors.
The formula for this line is S÷(1+EXP(−1×(t−o)÷g)) where S is the point of saturation or maximum population size, t is the period or count of quarters (1 for Q1 2007 and 2 for Q2 2007, etc), o is the offset to 50% or the point of inflection, in quarters, and g is the growth factor.
The S-curve above corresponds to S=1.8 billion, o=35 and g=8.
I chose these parameters because they best fit the data. It does not mean the reality will be precisely this but this is the best guess so far. It implies that there will be about 1.8 billion active devices sometime close to 2022 and tells us how we get there. This can and will change but for now this is the best guess using a theory that has worked in similar circumstances.
Working backwards from this active base estimate, we have predictive power on units sold, and even on revenues. However this is not the whole story. It's not even the main story. What matters is what it tells us of the relationship between past behavior (purchases) and future behavior (use, referral, repeat purchase). This is hinted at by the ratio between purchases and active devices. In other words, the ratio between cumulative units and active units tells us whether the products are used and for how long. Having a continuous estimate of active uses allows for a reliable measure of satisfaction.
The following graph shows this estimate.
Note that the ratio remains remarkably constant. It's currently about 64%. It's so constant that perhaps we can invent a rule of thumb which says that two out of every three devices ever sold by Apple is still in use. And that this rule is always true.
This begins to be interesting.
The staying power and predictability of the business ((i.e. Free cash flow)) comes from a guarantee that activity is rigidly tied to purchase.
This speaks more than any satisfaction survey. It's a measure of actions based on interaction rather than words based on human frailty.
There is no better number available to predict Apple's business.
The following is a transcript of the comments from Tim Cook (CEO) and Luca Maestri (CFO) at Apple's Q1 2018 Earnings Conference Call February 1, 2018. I color coded my interpretation of the comments into four categories:
Grey: Background and promotional commentary
Red: Strategy and signals of what management considers important and may include data beyond the regularly reported numbers.
Green: Financial data
Black: Commentary.
Blue: My commentary, in brackets.
For a quick read of Apple's strategy, read the Red text. These comments are not repeated in financial reports. Highly recommended.
For a quick read of Apple's financial performance, read the green text (which are replicated in financial reports). Read this if you don't want to wade through the financial reports.
For marketing or product material, read the grey text.This is sometimes unique but also repeats product launch information.
---- Tim Cook: Thanks, Nancy and thanks everyone on the call, and welcome to everyone today. Before we dive into the quarter, I'd like to take a moment to talk about a significant milestone we recently crossed.
Apple's active installed base reached 1.3 billion devices in January and is at an all-time high for all of our major products. 1.3 billion devices represents an astonishing 30% growth in just two years. It speaks to the strength and reliability of our products and our ecosystem, as well as the loyalty, satisfaction and engagement of our customers. It's also fueling tremendous growth in our services business, which I’ll talk about a little later in the call. [This is probably Apple's most important number. For at least the next 20 years this is the key performance metric and it can be used to derive company's valuation. A summary of the history of active devices vs. units sold is shown in the graph below:]
Turning to the December quarter. We're thrilled to report Apple's biggest quarter ever, which set new all-time records in both revenue and earnings. We generated revenue of $88.3 billion, which is above the high-end of our guidance range, and it is up almost $10 billion or 13% over the previous all-time record we set a year ago.
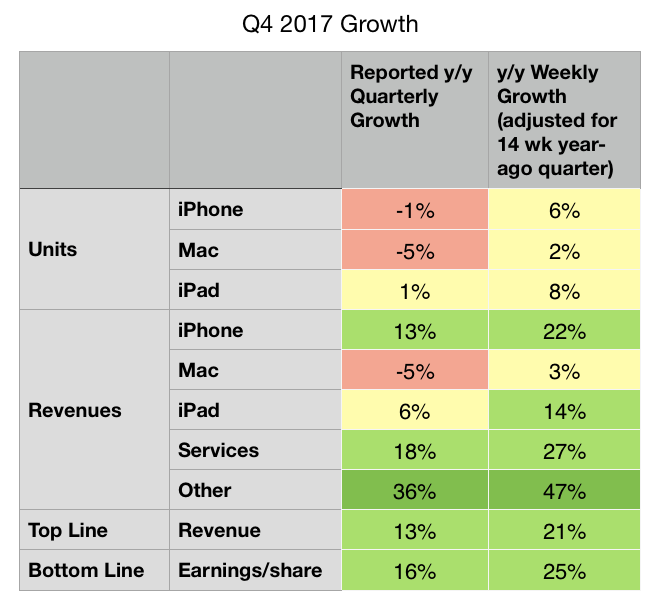
It's also our fifth consecutive quarter of accelerating revenue growth with double digit growth in each of our geographic segments around the world. What makes us even more remarkable is that the quarter we're reporting today was 13-weeks long, while the year ago quarter was 14-weeks. When we look at the average revenue per week in the December quarter this year compared to last year, our growth was a stunning 21%. [The 13-week vs. 14-week year-on-year comparison is repeated several times. The summary differences are shown in the table below:]
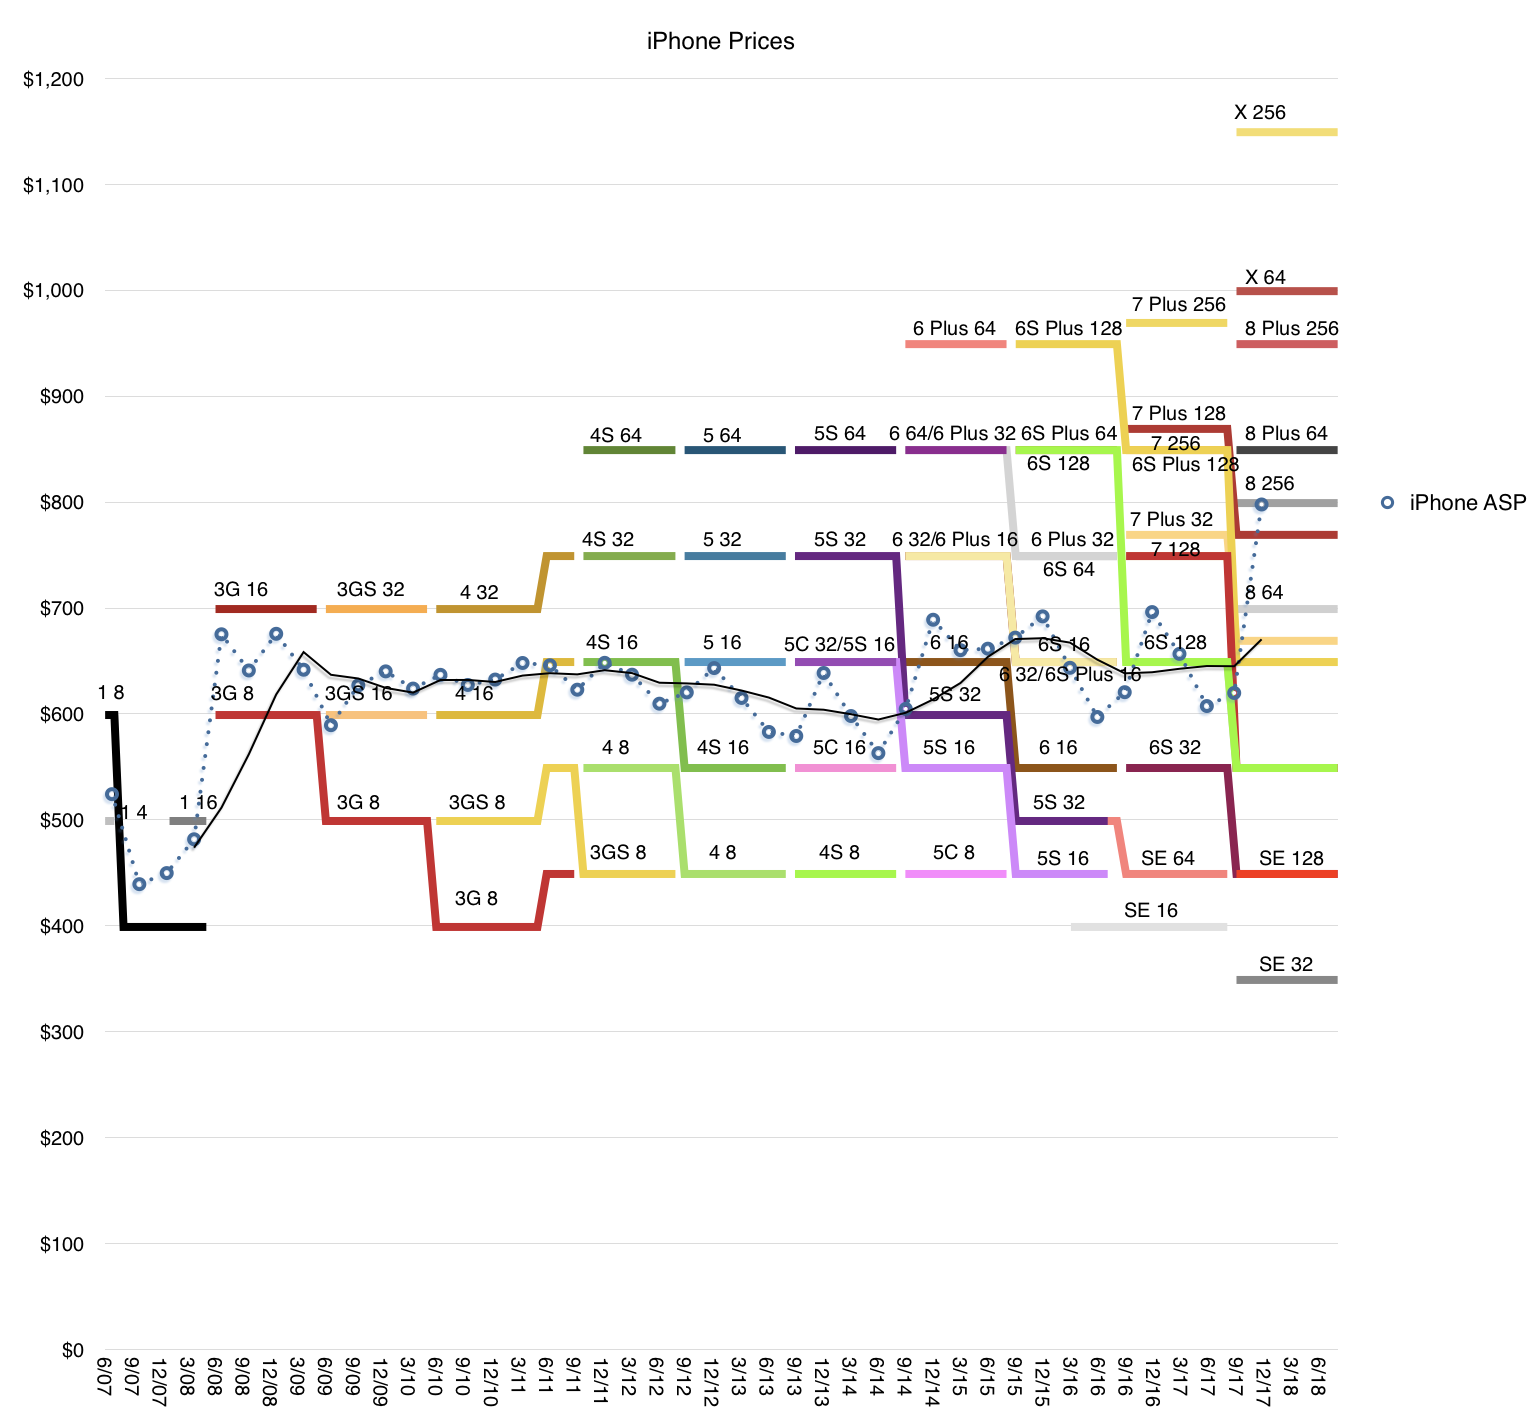
Our growth was broad-based and a key driver was iPhone, which generated its highest revenue ever. iPhone X was the best-selling smartphone in the world in the December quarter according to Canalys, and it has been our top selling phone every week since it launched. iPhone 8 and iPhone 8 Plus rounded out the top three iPhones in the quarter. In fact, revenue for our newly launched iPhones was the highest of any lineup in our history, driving total Apple revenue above our guidance range. [The iPhone X is a huge hit. It drove the average selling price $100 higher y/y. This is not only unprecedented for Apple but for the entire Industry. The average smartphone sells for less than $300 while iPhones sold for $800. The gap is widening. The following graph shows the product mix and the average resulting price.]
I want to take a moment to recognize the tremendous amount of work that went into creating iPhone 10. Our teams carried out an extremely complex launch from both an engineering and operations perspective, executing an outstanding product ramp that required years of research and development; one that introduced innovative features like an edge-to-edge Super Retina Display and the TrueDepth Camera, which enables face ID. Our customers love these new features and the new gestures like simply swiping up from the bottom, which make using iPhone even more intuitive and enjoyable.
Our team has put the technology of tomorrow in our customers’ hands today, set a standard for the next decade of smartphones and we are very proud of their achievements.
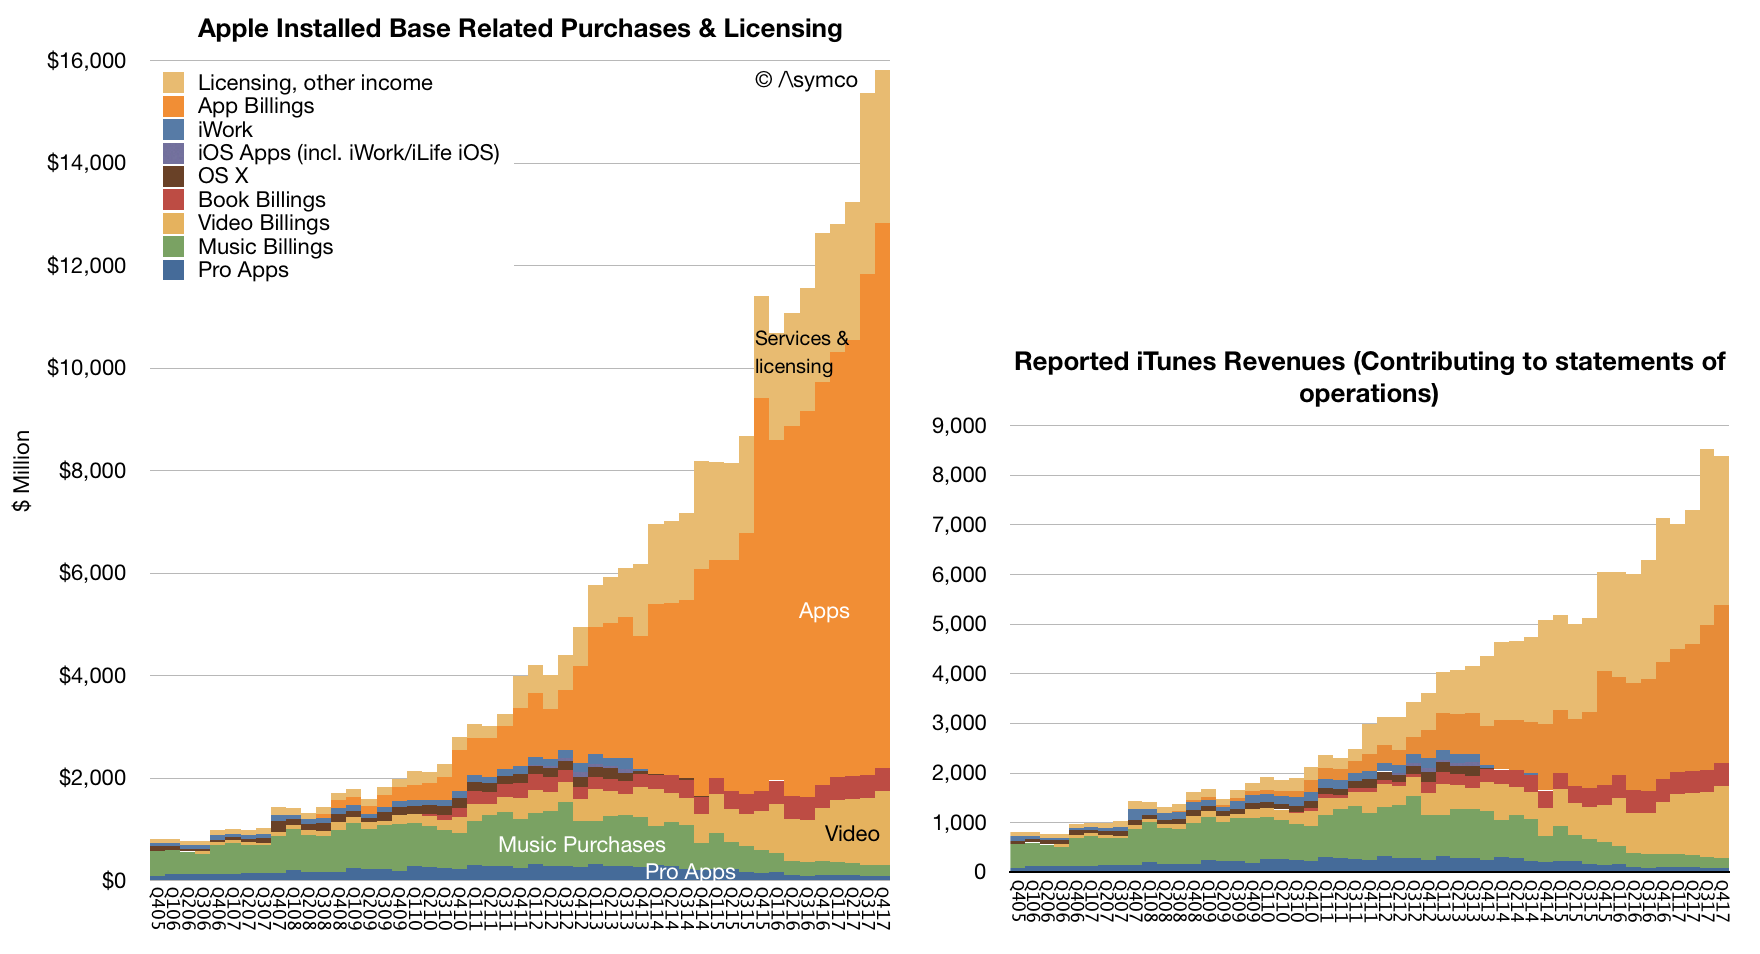
It was another very strong quarter for services with revenue of $8.5 billion, up 18% over last year, and we’re on pace to achieve our goal of doubling our 2016 services revenue by 2020. The number of paid subscriptions across our services offerings passed 240 million by the end of the December quarter, that’s an increase of 30 million in the last 90 days alone, which is the largest quarterly growth ever. [Services has been growing relentlessly for over a decade. This steadiness of growth makes is a juggernaut. Apple is increasingly speaking about subscriptions as the key metric and 240 million is reaching record territory. The rise of Services is shown below (both revenues and consumer spending.)]
We had an all-time record quarter for the App Store with our best holiday season ever. We’re seeing great excitement around augmented reality with customers now enjoying over 2,000 ARKit enabled app, spanning every category in the App Store. In December, when Pokémon GO released its new augmented reality features built with ARKit, it jumped the top of the App Store charts. Last week, on a stop in Toronto, I met developers who are hard at work on creative applications using ARKit from art appreciation to ecommerce, and I was very impressed with what I saw.
Just for months after ARKit launched to the public, we’ve already released ARKit 1.5 in beta to developers around the world, and the response has been tremendous. Augmented reality is going to revolutionize many of the experiences we have with mobile devices. And with ARKit, we’re giving developers the most advanced tools on the market to create apps for the most advanced operating system running on the most advanced hardware. This is something only Apple can do.
In addition to the App Store, several other services had their biggest quarter ever, including Apple Music, iCloud and Apple Pay, all of which saw growth in both active users and revenue.
Apple Pay has reached an important milestone in the U.S. As a result of 50% year-over-year growth in merchant adoption, it’s now accepted at more than half of all American retail locations, which includes more than two-thirds of the country’s top 100 retailers. Now available in 20 markets, global Apple Pay purchase volume more than tripled year-over-year and we’re delighted to be expanding to Brazil in the coming months. [There are no absolute data points on Apple Pay but we do have some scattered growth data. The US data is cited here but in my experience it's more popular in select countries like UK where users are using it habitually]
Today, you can use Apple Pay to take the subway in Guangzhou, China, see a concert at London’s Wembley Stadium or buy a souvenir in Yosemite National Park. In the U.S., we launched Apple Pay Cash in December, and it’s off to a terrific start. Millions of people are already using it to send and receive money with friends and family quickly, easily and securely; to split a bill, pay someone back, or send last minute gift right from the messages app.
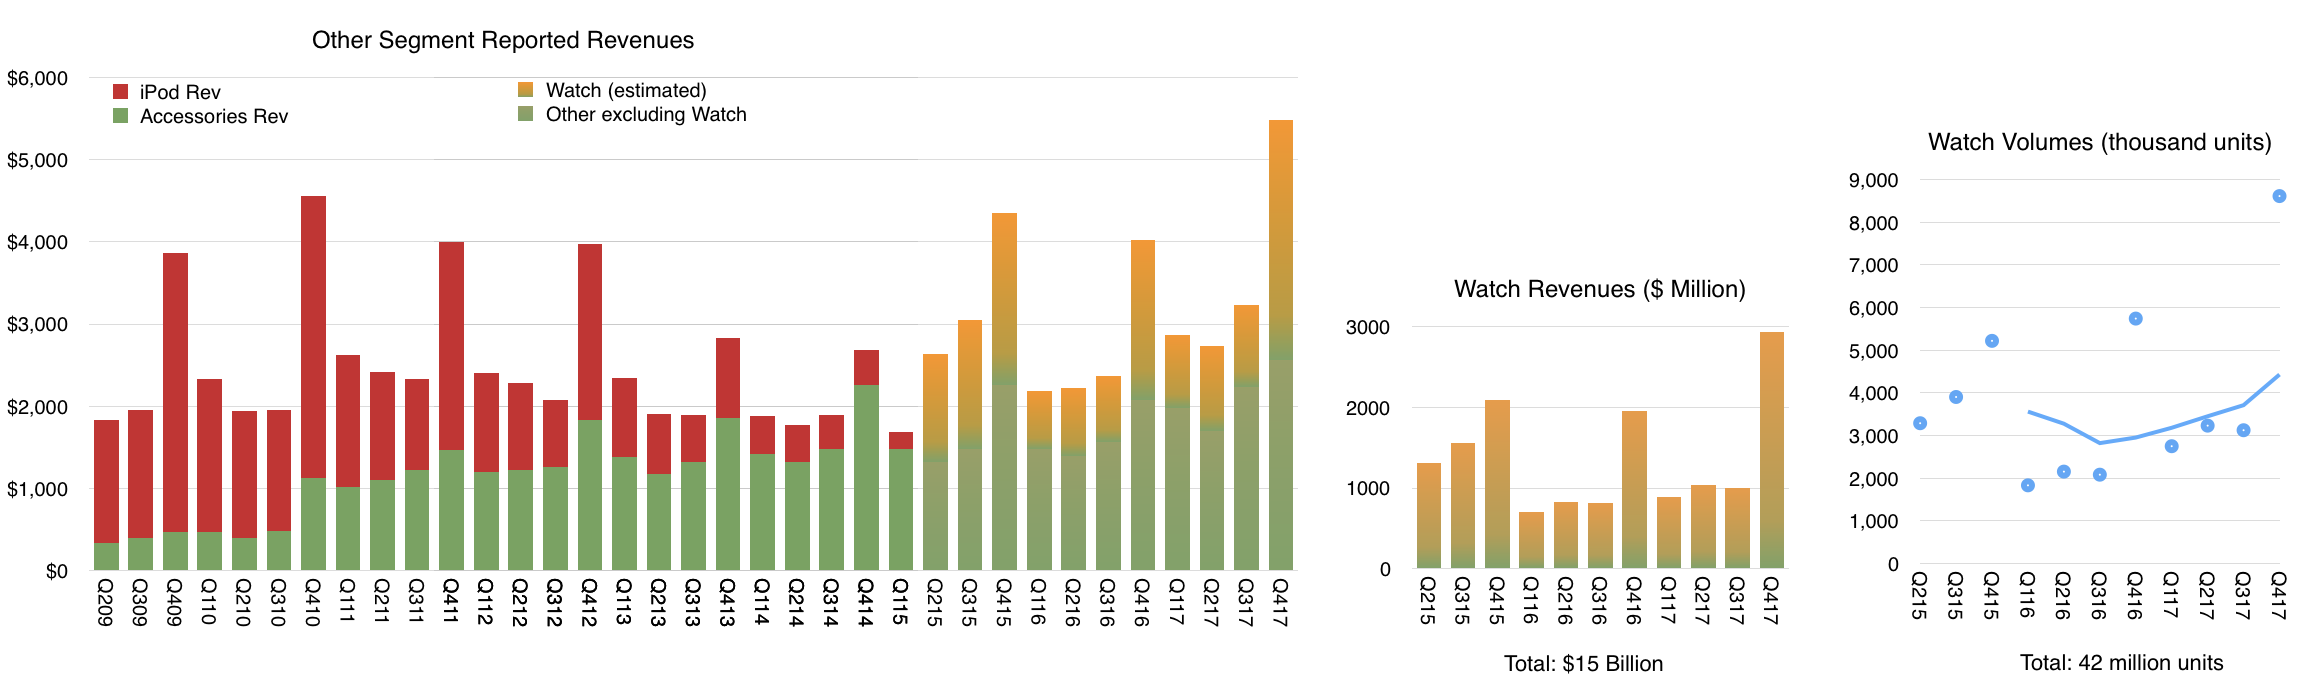
It was our best quarter ever for the Apple Watch with over 50% growth in revenue and units for the fourth quarter in a row and strong double-digit growth in every geographic segment. Sales of Apple Watch Series 3 models were also more than twice the volume of Series 2 a year ago. Apple Watch is the most popular, smart watch in the world and gained market share during the quarter based on the latest estimates from IDC. [Apple Watch is growing consistently. The following graph shows my estimates of volume (total 42 million to date) and revenues (total $15 billion) based on all available data and commentary from management.]
It was the third consecutive quarter of growth for iPad revenue, thanks to the strength of both iPad and iPad Pro. Based on the latest data from IDC, we gained share in nearly every market we track with strong outperformance in emerging markets.
Worldwide, almost half of our iPad sales were the first-time tablet buyers are those switching to Apple, and that’s true in some of our most developed markets, including Japan and France. In China, new and switching users made up over 70% of all iPad sales.
For Mac, we launched the all new, iMac Pro in mid-December. It’s an entirely new product line designed for our Pro users who love the all-in-one design of iMac and require workstation class performance. It's the fastest, most powerful Mac ever, delivering incredible computational power, for simulation and real time 3D rendering, immersive VR and complex photography audio and video projects. Worldwide, 60% of our Mac sales were the first time buyers and switchers and in China, that number was almost 90%.
We're looking forward to getting HomePod in customers’ hands beginning next week. HomePod is an innovative wireless speaker, which delivers stunning audio quality wherever its placed in the home, thanks to the advanced Apple engineered hardware and software.
Together with Apple Music, HomePod gives you instant access to one of the world's largest music catalogs. And with the intelligence of Siri, it’s a powerful assistant you control through natural voice interaction. We're very happy with the initial response from reviewers who've experienced HomePod ahead of its launch, and we think our customers are going to love this new product.
We believe one of the key issues of the 21st century is education. And because of that, we've strengthened our commitment and investment into initiatives like everyone can code. To find the innovators of the future, we need to nurture the students of today. Our App Development with Swift curriculum, which is available free on iBooks, has been downloaded more than 1.2 million times worldwide with almost half of those coming from here in the United States. It’s also being taught in dozens of community colleges across the country, putting practical skills in the hands of today’s jobs seekers.
I was in London two weeks ago as we announced that the program was expanding to more than 70 colleges and universities in Europe. Millions of students around the world will have the opportunity to add Swift to their coding vocabulary and gain skills that are essential for today’s economy.
This is an exciting time at Apple and with the best lineup of products and services we've ever had and a set of initiatives that show how business can be a force for good in the world. We could not be more excited about our future.
Now, for more details on the December quarter results, I'd like to turn over the call to Luca.
Luca Maestri: Thank you, Tim. Good afternoon, everyone. Our business and financial performance in the December quarter were exceptional, as we set new all-time records for revenue, operating income, net income and earnings per share.
Starting with revenue, we’re reporting an all-time record, $88.3 billion, up nearly $10 billion or 13% over the prior record set last year. It is our fifth consecutive quarter of accelerating revenue growth. As you know, the December quarter a year ago spanned 14-weeks compared to 13-weeks this year, which is important to consider as we have set the underlying performance of our business this year. When we look at average revenue per week, our growth rate was even higher at 21% with growth across all product categories for the third consecutive quarter.
Our results were terrific all around the world with double digit revenue growth in all our geographic segments, an all-time quarterly record in the vast majority of markets we track, including the U.S., Western Europe, Japan, Canada, Australia and Korea, as well as Mainland China, Latin America, The Middle East, Central and Eastern Europe, and India.
In Greater China, we were very happy to generate double digit revenue growth for the second quarter in a row and in emerging markets outside of Greater China, we saw 25% year-over-year growth.
Gross margin was 38.4% at the high end of our guidance range. Operating margin was 29.8% of revenue. Our net income was $20.1 billion an all-time record, and up $2.2 billion over the last year. Diluted earnings per share were $3.89 also an all-time record and cash flow from operations was very strong at $28.3 billion.
During the quarter, we sold 77.3 million iPhones, the highest number ever for a 13-week quarter. Average weekly iPhone sales were up 6% compared to December quarter last year with growth in every region of the world despite the staggered launch of iPhone 10. We established all-time iPhone revenue record in nearly every market we track with double-digit growth in all of our geographic segments. iPhone ASP increased to $796 from $695 a year ago, driven primarily by the launch of iPhone 10 and the success of iPhone 8 and 8 Plus.
We exited the December quarter towards the lower end of our target range of five to seven weeks of iPhone channel inventory with less than 1 million more iPhones in the channel compared to the December quarter a year ago, in line with our growth in average weekly unit sales. Customer interest and satisfaction with iPhone are very, very strong for both consumers and business users.
The latest data from 451 Research indicates U.S. customer satisfaction ratings of 96% or higher across iPhone models. In fact, combining iPhone 8, iPhone 8 Plus and iPhone 10, consumers reported an amazing 99% satisfaction rating. And among business customers planning to purchase smartphones in the next quarter, 77% planned to purchase iPhone. Our customers are also incredibly loyal with Kantar's latest U.S. research, reflecting a 96% iPhone loyalty rate, the highest ever measured. [Customer satisfaction is the second most important figure after active user base. Combining these two figures yields the recurring revenue value of the company. Remember what Deming said: the most important measurements for a company's value are the multipliers of a satisfied customer and a dissatisfied customer--these numbers never appear on any financial report but they are applied to all the numbers on every report].
Turning to services. We had a terrific quarter with revenue of $8.5 billion, up 18% year-over-year and up 27% in terms of average revenue per week; that is an acceleration to the 24% services growth run rate that we experienced in the September quarter.
The App Store set a new all-time revenue record. The Store’s all-new design is off to a fantastic start with quarterly store visitors, transacting accounts and paying accounts, reaching new all-time highs. During the week beginning December 24th, a record number of customers made purchases or downloaded Apps from the App Store, spending over $890 million in that seven-day period, followed by $300 million in purchases on New Year’s day alone.
And according to App Annie’s latest report, the App Store continues to be the preferred destination for customer purchases by a very wide margin, generating nearly twice the revenue of Google Play. Across all our services offerings, paid subscriptions reached $240 million with growth of 58% over last year and they were a major contributor to the overall strong growth in services revenue. [Apple has half the user base of Google Android. This is based on Google's May 2017 report of 2 billion active devices vs. the 1.3 billion that we just got from Apple. And yet these users collectively spend twice as much on apps. This ratio of "half the users, twice the spending" has been cropping up in individual developer anecdotes and can also be seen in other metrics of engagement and consumption. This should not be surprising as it conforms to the Pareto distribution of economic value.]
As Tim mentioned, it was our best quarter ever for Apple Watch. And when we add to this us from Beats and AirPods, our total revenue from wearables was up almost 70% year-over-year. In fact, wearables were the second largest contributor to revenue growth after iPhone, which is impressive for a business that started only three years ago. In total, our other products category set a new all-time record with quarterly revenue exceeding $5 billion for the first time. [Wearables now includes more than watches but watches are likely still the dominant product.]
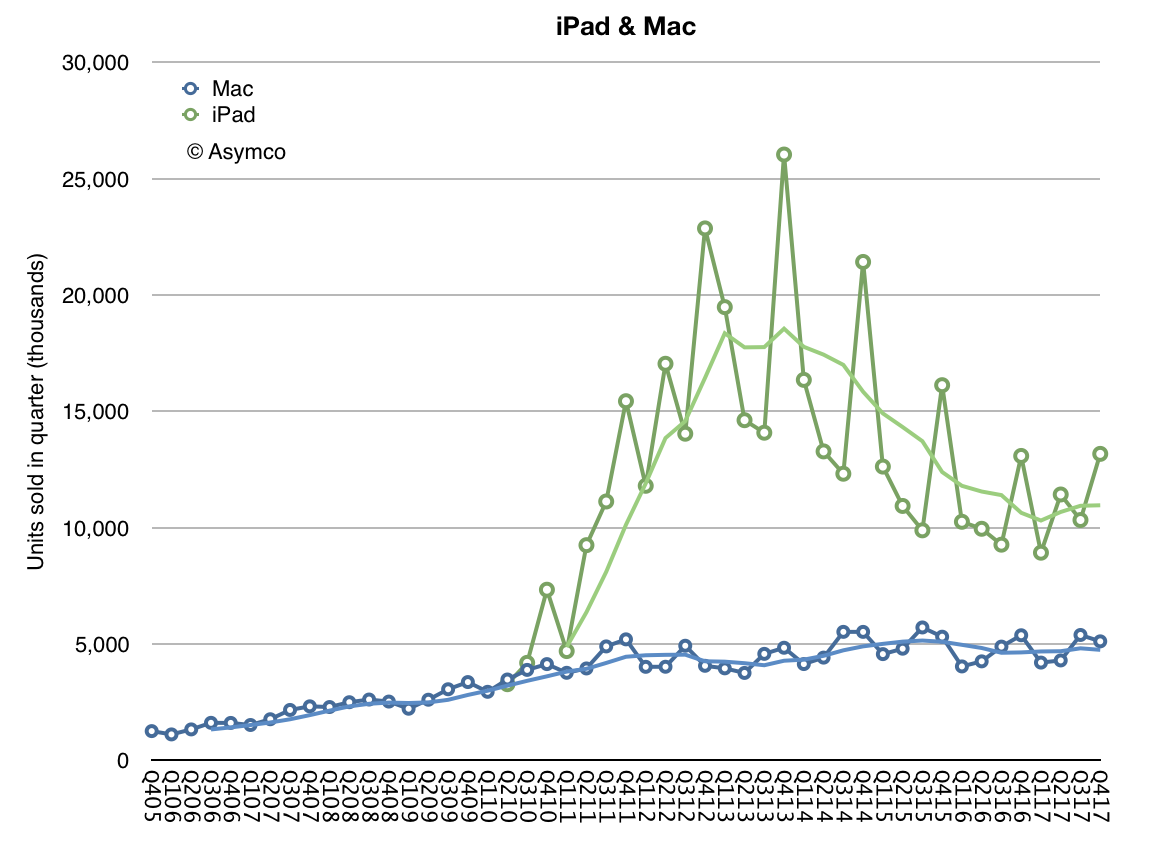
Next, I’d like to talk about the Mac. We sold 5.1 million Macs during the December quarter, which translates to a 2% year-over-year increase in average sales per week. Mac performance was particularly strong in emerging markets with unit sales up 13% year-over-year and with all-time records in Latin America, in India, Turkey and Central and Eastern Europe. On a worldwide basis, the active install base of Macs was up double-digits year-over-year to a new record.
It was also another growth quarter for iPad. We sold 13.2 million units with average iPad sales per week up 8% over last year’s December quarter. iPad sales grew strong double-digits in many emerging markets, including Latin America, the Middle East, Central and Eastern Europe and India, as well as developed markets, including Japan, Australia and Korea. The active install base of iPad has grown every quarter since its launch in 2010, and it reached a new all-time high in December, thanks to extremely high customer loyalty and large numbers of first-time iPad users. [iPad is clearly recovering from a long decline. ASPs are rising as it's being positioned as a PC alternative. Its low end functions are being absorbed by large screen iPhones.]
NPD indicates that iPad had 46% share of the U.S. tablet market in the December quarter, up from 36% share a year ago. And the most recent surveys from 451 Research found that among customers planning to purchase tablets within 90 days, 72% of consumers and 68% of business users planned to purchase iPads. Customer satisfaction is also very high with businesses reporting a 99% satisfaction rating for iPad.
We are seeing great traction in enterprise as businesses across industries and around the world standardize on iOS. For example, Intesa Sanpaolo, one of Europe’s leading banks, has chosen iOS as the mobile standard for its entire 70,000 employee base in Italy; choosing iOS for its security, user interface, accessibility and reliability, Intesa Sanpaolo will deploy native apps to improve employee productivity in customer support, human resources, and marketing across the company.
And LensCrafters, one of the largest optical retail brands in North America, will be using over 7,000 iPad Pros to enable digital eye exams and digital optical measurements in a personalized and interactive experience. We’re also rolling out a new initiative, called Apple AtWork to help businesses implement employee choice programs more easily and offer Apple products company-wide.
Resources from both Apple and our channel partners will enable enterprise IT and procurement teams to buy or lease Apple products more efficiently, streamline the setup of iPhone, iPad, and Mac, and deliver a seamless onboarding experience for employees. We launched the program with CDW in the U.S. last week, and we would be expanding to more channels and regions later this year.
The December quarter was extremely busy for our retail and online stores, which welcomed 538 million visitors. Traffic was particularly strong during the four-weeks following the launch of iPhone 10, up 46% over last year. And across the quarter, our stores conducted over 200,000 today at Apple sessions, covering topics including photography, music, gaming, and app development, and art and design. Just last weekend, we opened our first store in Seoul, Korea and we’re looking forward to opening our first store in Austria in a few weeks. These newest openings will mark the expansion of our retail store presence to 21 countries.
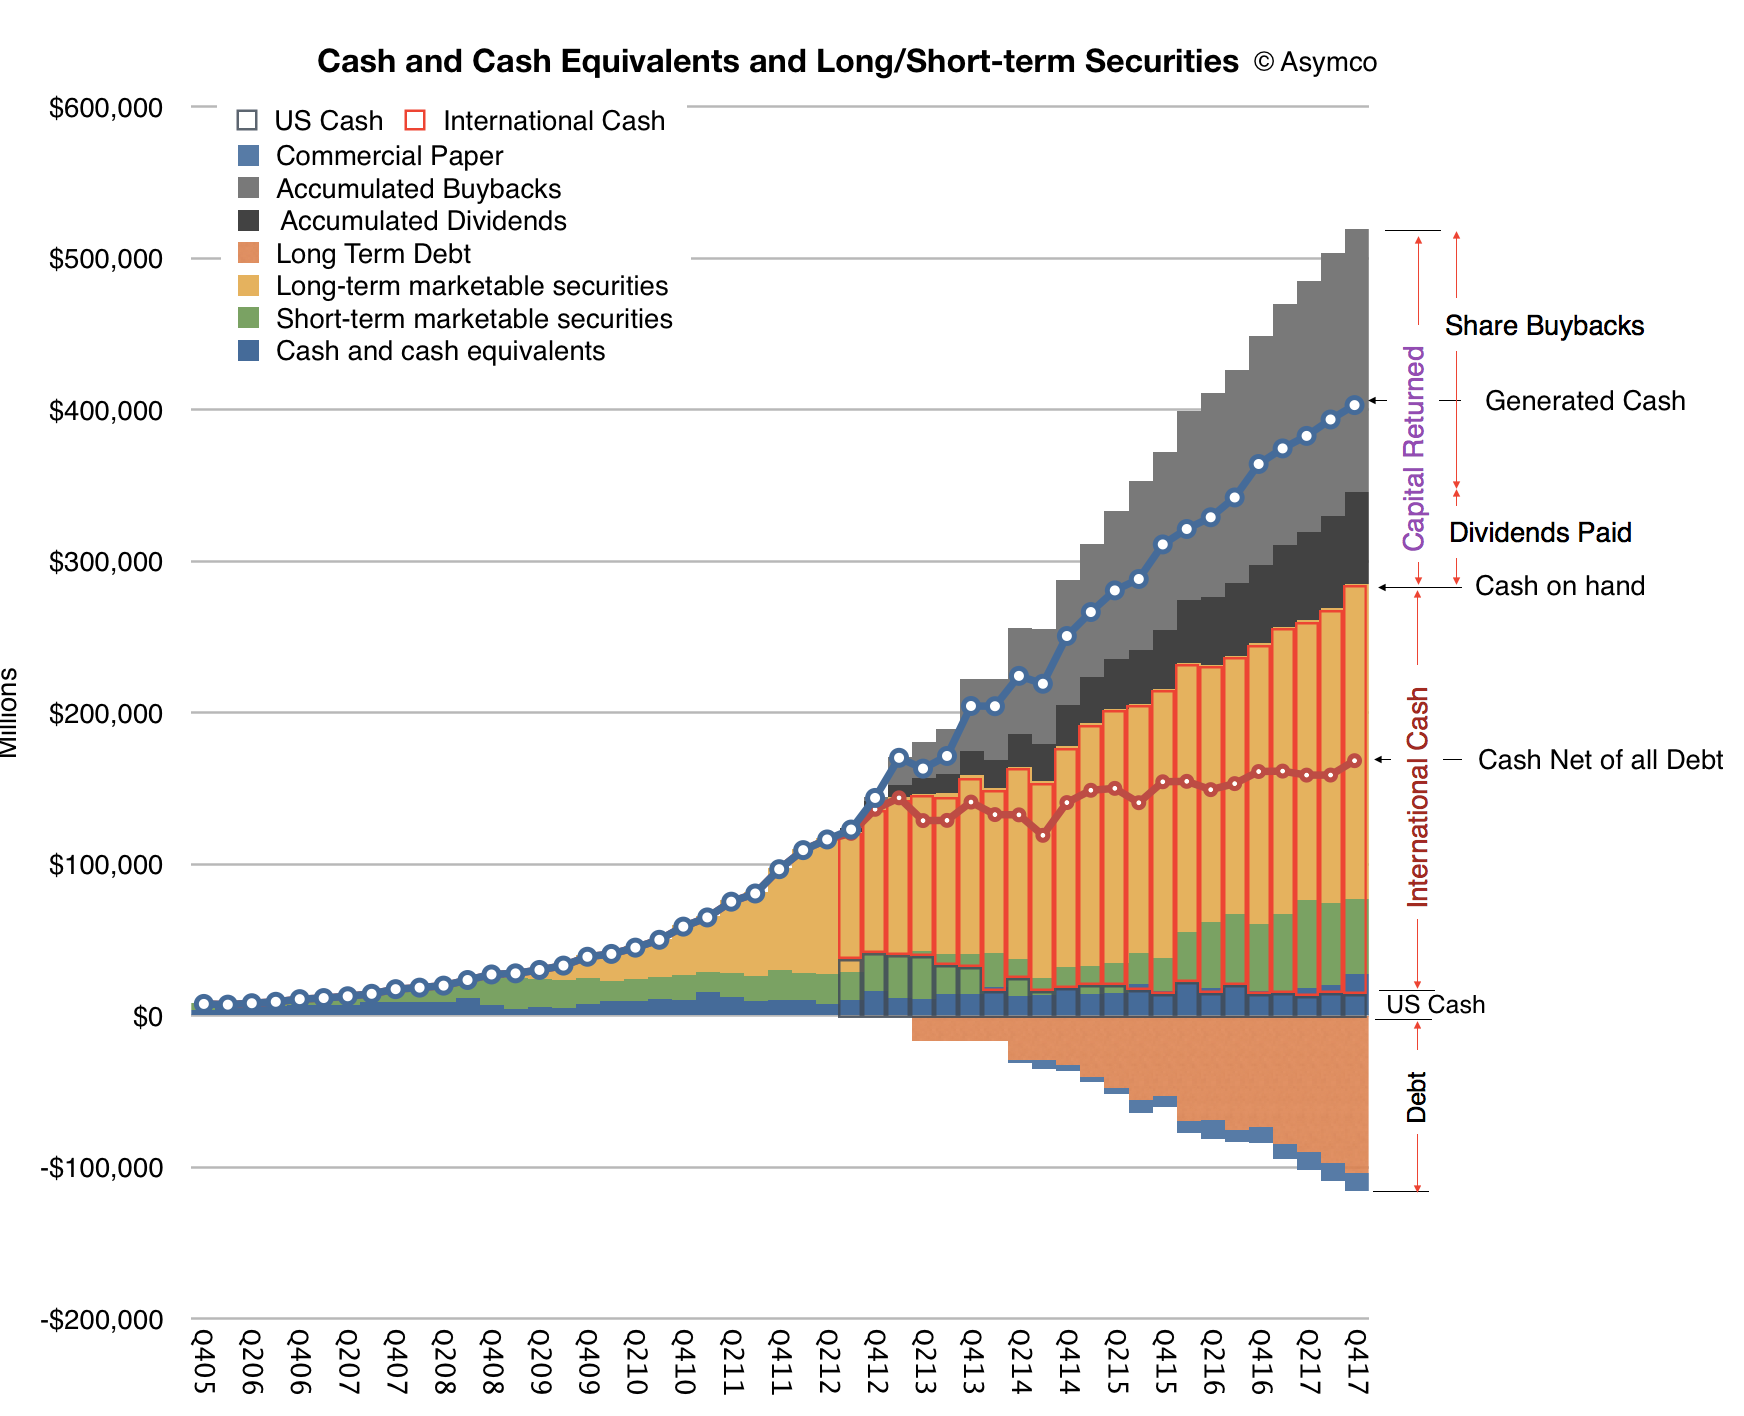
Let me now turn to our cash position. We ended the quarter with $285.1 billion in cash plus marketable securities, a sequential increase of $16.2 billion. $269 billion of this cash, or 94% of the total, was outside the United States. We issued $7 billion in debt during the quarter, bringing us to $110 billion in term-debt and $12 billion in commercial paper outstanding, for a total net cash position of $163 billion at the end of the quarter. We also returned $14.5 billion to investors during the quarter. We paid $3.3 billion in dividends and equivalents, and spent $5.1 billion on repurchases of 30.2 million Apple shares through open market transactions.
We launched a new $5 billion ASR program, resulting in initial delivery and retirement of 23.6 million shares and we retired 3.8 million shares upon the completion of our 12th ASR during the quarter. We’ve now completed over $248 billion of our $300 billion capital return program, including $176 billion in share repurchases against our announced $210 billion buyback program with $34 billion remaining under our current authorization. [An updated look at Apple's cash is shown below]
Turning to taxes. Due to the recently enacted legislation in the U.S., we estimate making a corporate income tax payment of approximately $38 billion to the U.S. government on our cumulative past foreign earnings. This amount is very similar to what we had been accruing on those earnings in our financial results through fiscal year 2017, including the $38 billion payment. We will have paid over $110 billion of corporate income tax on our total domestic and foreign earnings during the last 10 years for a cash tax rate of about 26%. [Apple has paid more tax than any company in history, and is about the make the largest single payment to the US Treasury.]
Our tax rate of 25.8% for the December quarter was close to our guidance of 25.5% as the lower U.S. statutory rate from the new legislation was effective offset by the remeasurement of deferred tax balances.
As we move ahead into the March quarter, I'd like to review our outlook, which includes the types of forward looking information that Nancy referred to at the beginning of the call; we expect revenue to be between $60 billion and $62 billion; we expect gross margin to be between 38% and 38.5%; we expect OpEx to be between $7.6 billion and $7.7 billion; we expect OI&E to be about $300 million; and we expect the tax rate to be about 15%.
Tax reform will allow us to pursue a more optimal capital structure for our company. Our current net cash position is $163 billion. And given the increased financial and operational flexibility from the access to our foreign cash, we are targeting to become approximately net cash neutral overtime. We will provide an update to our specific capital allocation plans when we report results for our second fiscal quarter, consistent with the timing of updates that we have provided in the past.
Finally, today our Board of Directors has declared a cash dividend of $0.63 per share of common stock, payable on February 15, 2018, to shareholders of record as of February 12, 2018.
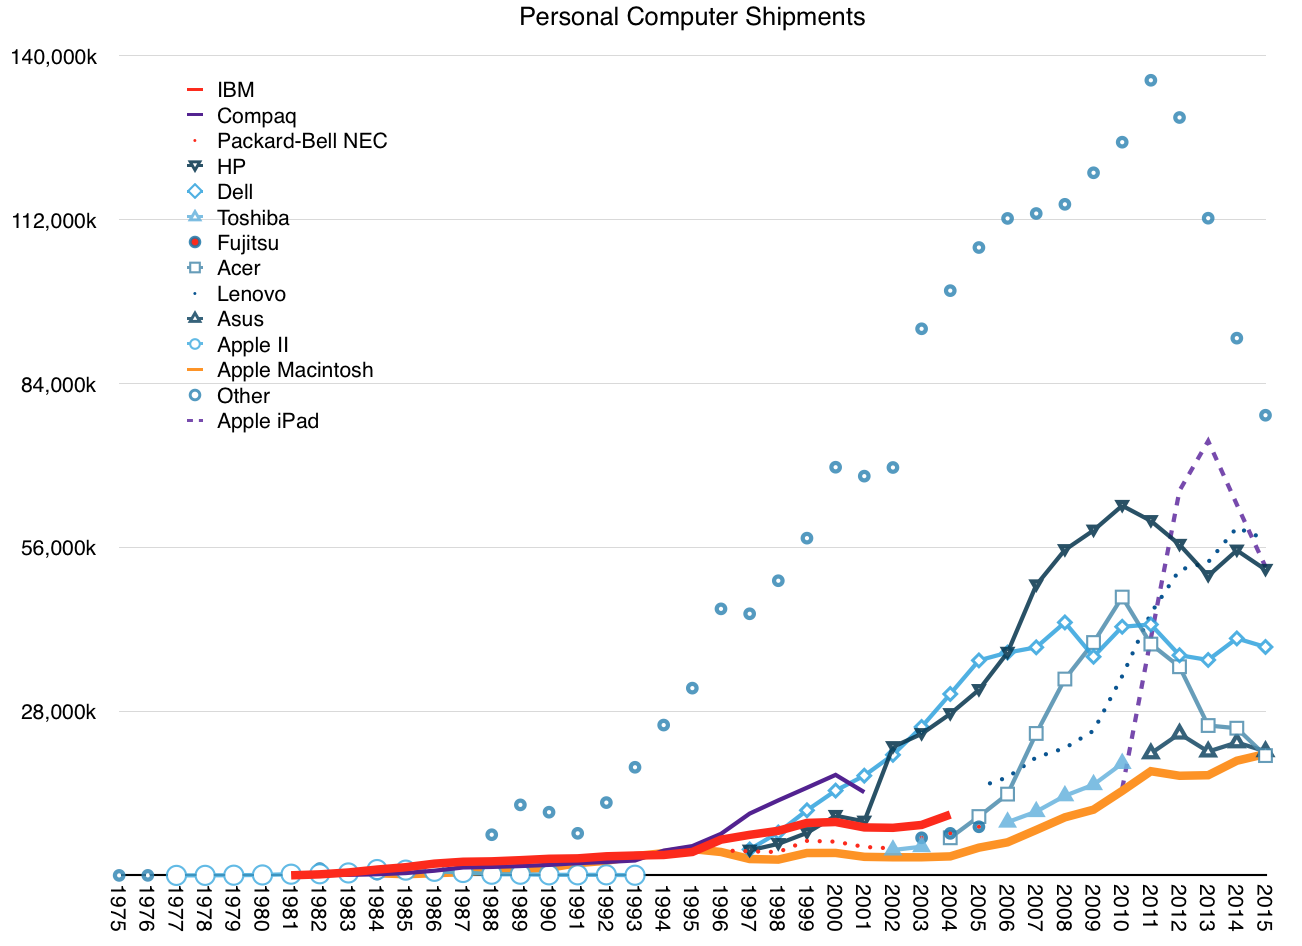
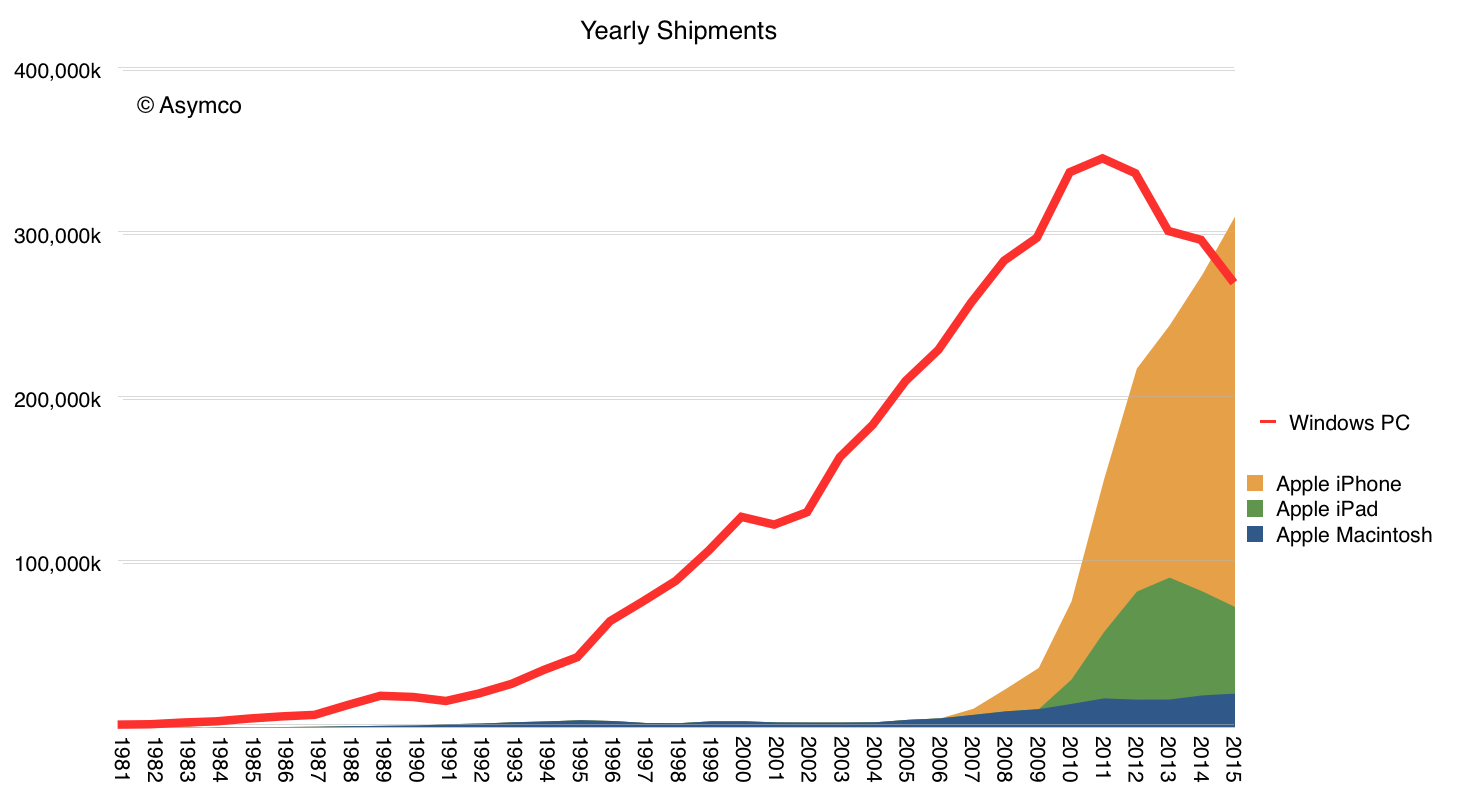
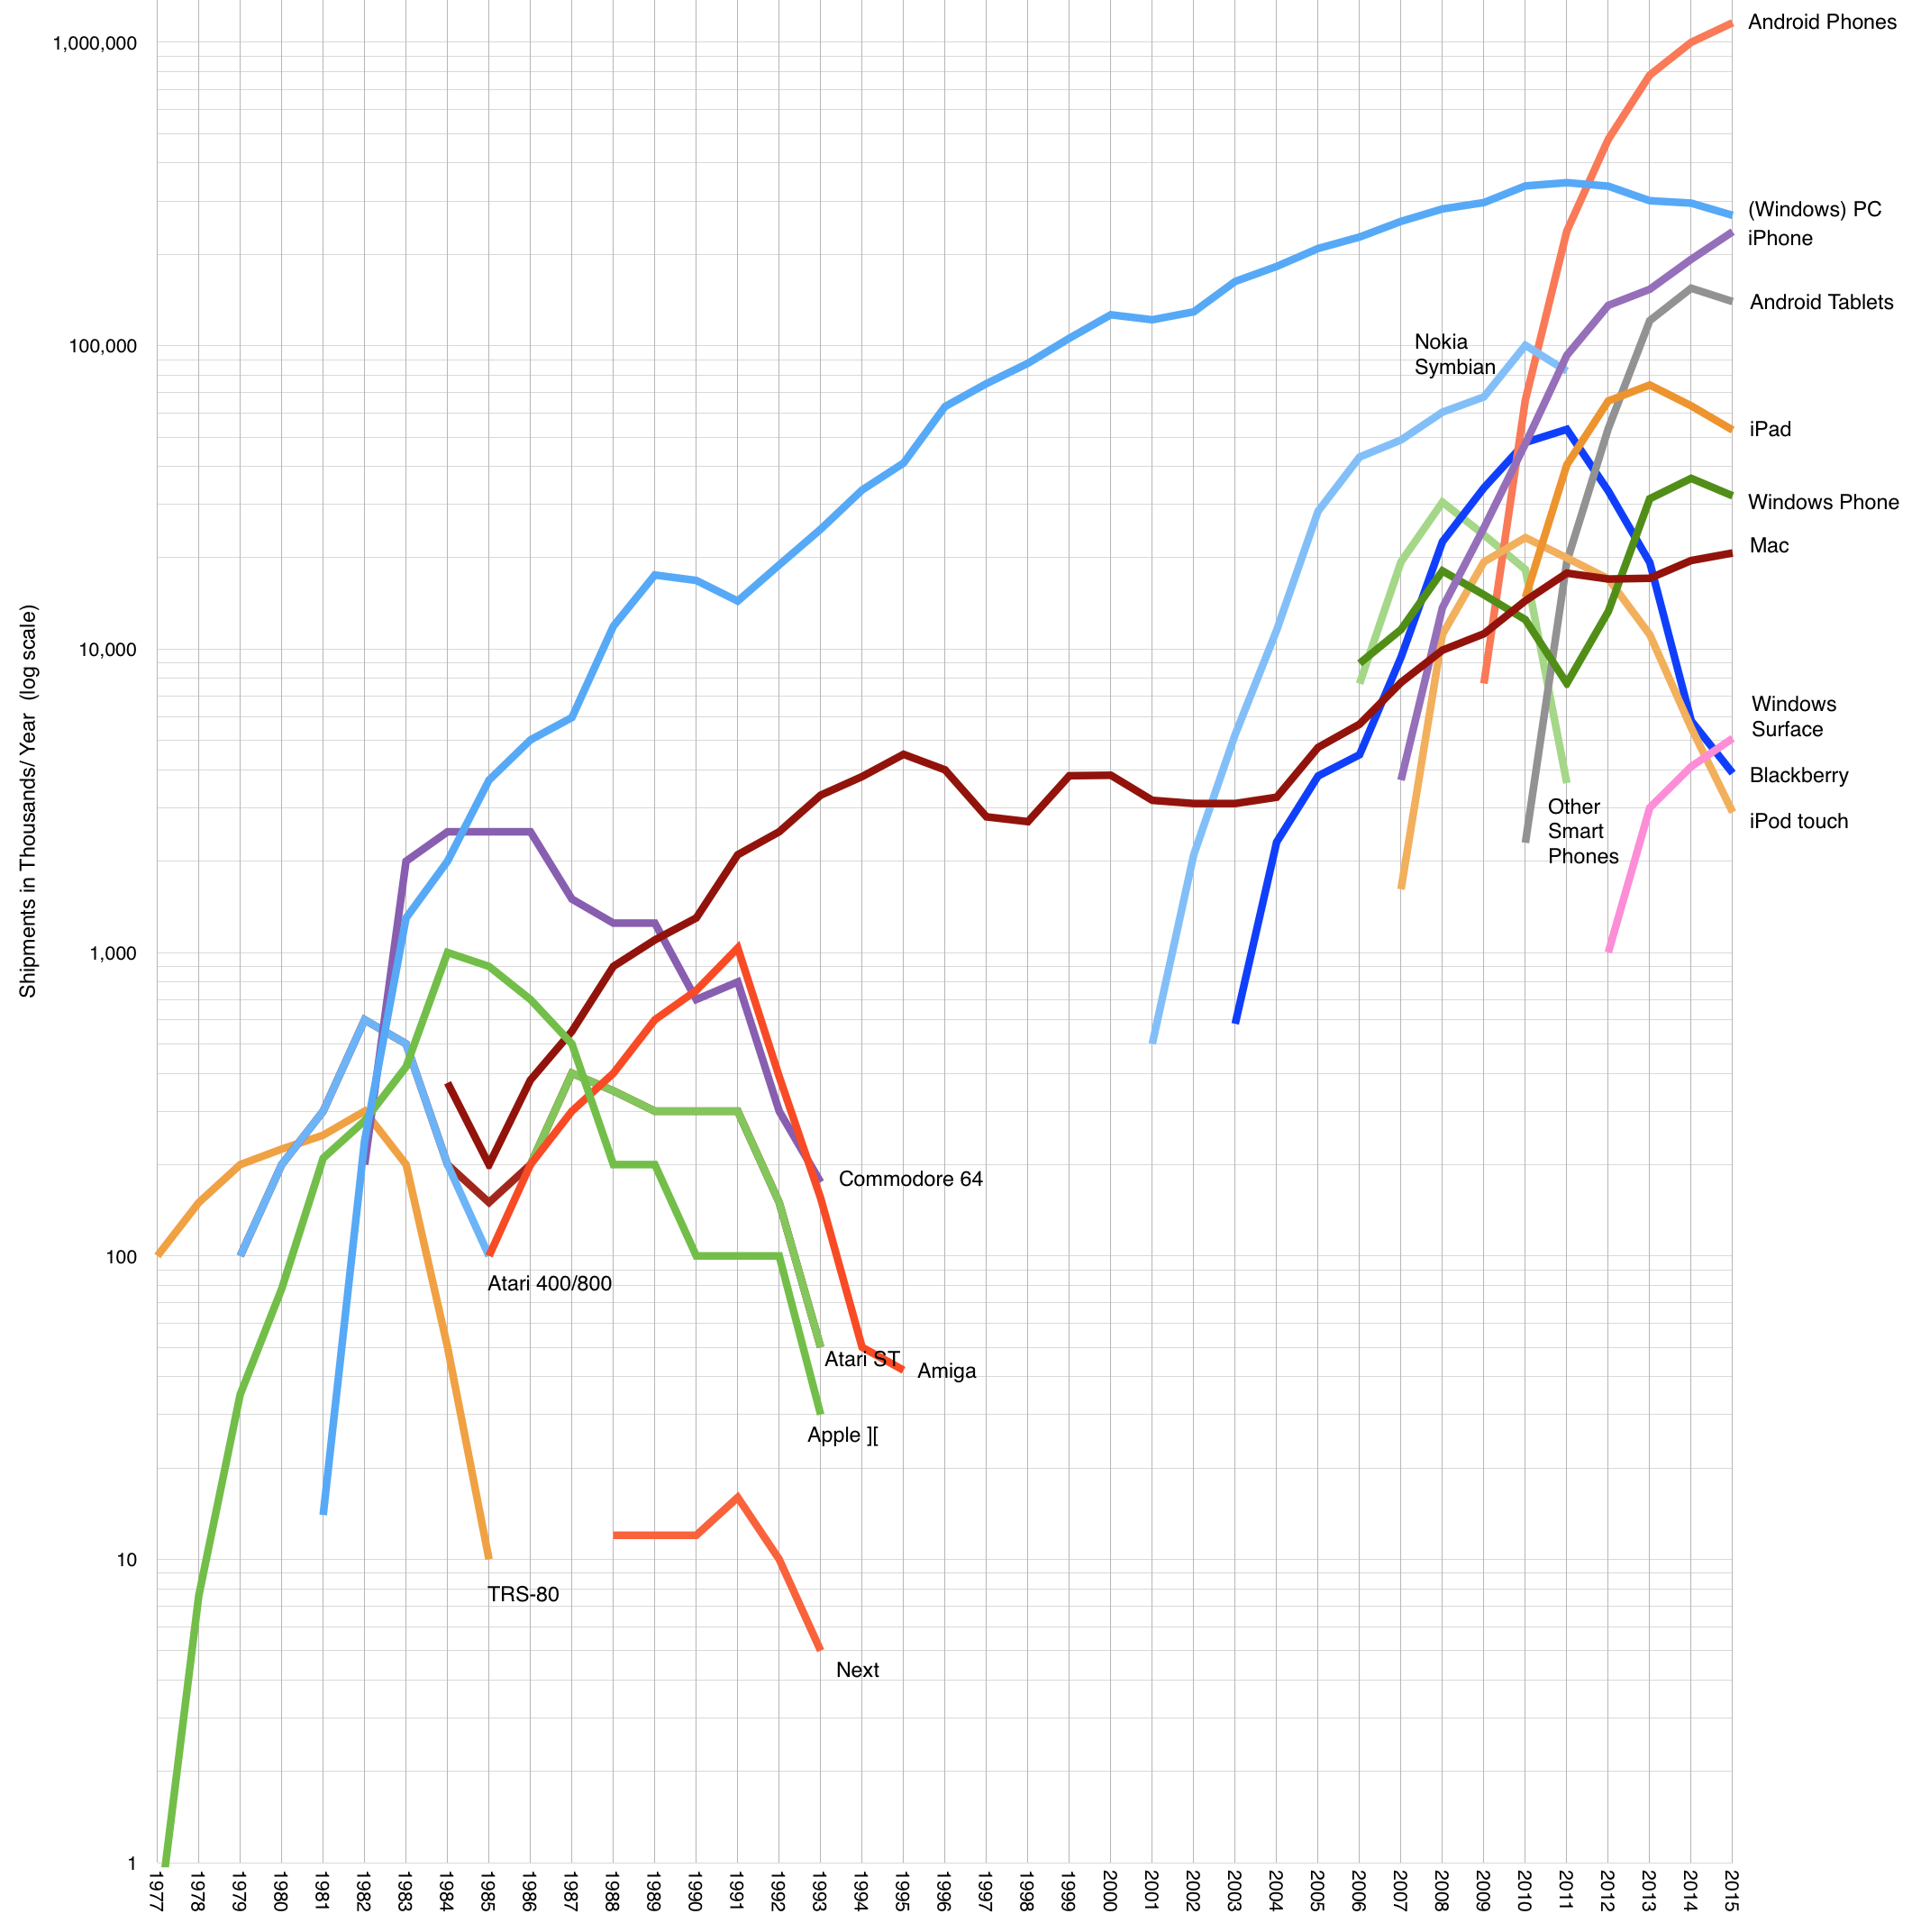
In Apple's first 40 years it shipped 1,591,092,250 computers ((including Apple II, Mac, iPhone, iPad and iPod touch; excluding Apple Watch, Apple TV and other iPods. Includes Q1 shipments estimated at 63,597,000 Macs, iPhones and iPads)).
This shipment total is higher than any other computer company in its first 40 years. Actually there are no other PC makers that are 40 years old. One computer maker (IBM) is older but they only sold PCs for 24 years and what they still sell they don't sell in high numbers.
That does not make it the top seller in a given year. Looking at only the Mac, Apple's traditional form factor personal computer, Apple has only returned to the top 5 last year. Only if including the iPad it was the top computer vendor in 2011 and including iPhone, it was first in 2009.
After having a 40 year run and after selling more computers than all American and Japanese computer companies put together, how should we think about the next 40 years?
First, clearly Apple shifted from being a "computer company". It has already changed its name to exclude the word "Computer" but that has been interpreted as saying that it sells devices (which happen to also be computers.) The word "computer" is already archaic. We stopped using computers to compute in the 40s. We used them to make decisions, keep track of things, speed things up and then to communicate and then to entertain.
Devices, it seems, are what customers mainly use to do, well, everything. Computing has grown to encompass most activities we engage in. So is Apple then a device maker?
More broadly, irrespective of the name, is Apple at 40 still defined as a hardware company? Certainly Wall Street ((i.e. average people)) still think so. The conversations one hears clearly consider Apple's future to be tied to the sales volume of specific products. At one time it may have been the Mac, another, the iPod and now the iPhone. This thinking is again a legacy of where the company was but mainly it's a reflection of how revenues are reported.
We see a line item in the income statement that says "iPhone" and it has a big number next to it so we, of course, fixate on that big shiny number. But if we were to unpack that number and see why it's so big we would discover that buyers are buying something other than what financial statements report.
Buyers are buying experiences, I hear you say. Yes, but more than that. Much more. They are buying safety, comfort, convenience, simplicity, productivity. They are buying modules to combine with other modules that help to do something. Something better. They are buying hope, satisfaction, escape or vanity. In other words they don't know what they want but know when they have it. They trust products unseen which have a reputation of delivering that which they think they might like, without knowing what that is. By employing the product, and a whole lot more—effort, time, mental energy and repetitive actions—they learn to exploit a product to achieve satisfaction.
Products are enablers, as are experiences and software and ecosystems and services. They are modules used in a melee of activity to make the user feel they are making progress. And if that module is better than no module then it will command a price and if it's better than another module or modules then it will command a premium. And if most people agree then it will be popular with many. And only if all these are true will it create a big number on a report.
And so we must search for other names to call a company that delivers an enabler that may lead to progress. Crude categorization like the reporting of finances leads to self-deception and a loss of opportunity to understand. Firms are often victims of this self-deception because they start believing that customers buy the things they sell. They start to believe that what is on their financial reports is a reflection of the value they create. It's a simple mistake to make, but a mistake which leads to catastrophe. If its data is mis-categorized, by chasing numbers the company runs away from opportunity, leaving it to competitors otherwise unencumbered with knowledge of numbers.
Assuming Apple avoids mis-categorizing what it does, will it be a "solutions" or "services" or "brand" company? Is it, as I used to say, a "blockbuster manufacturing line"?
Yes, and still that's not all it could be. Nor is it enough to understand what will come.
My simple proposal is to think of Apple (and actually any company) as a customer creator. It creates and maintains customers. The more it creates, the more it prospers. The more customers it preserves the more it's likely to persevere. This measure of performance for a company is not easy to obtain. It's not a line item in any financial report.
The closest figure we have is that today Apple has one billion active devices in use. We're not told of the total users or total customers because Apple cannot count people or wallets as accurately as it can count active devices. But as imperfect as it is, this number gives us a way to get close to counting customers.
So we know that at least Apple has created a large number of customers. Knowing total devices sold and number in use means that we can be sure that 63% of all the computers Apple sold are still in use. This means that most customers are recent customers. That is not necessarily good news. New customers are not well understood. We don't know how these new customers might behave in the future.
Will they come back for more of whatever Apple makes? If we look at the history of competitors or technology products in general, chances are they won't. The industries Apple has been a part of are filled with one hit wonders. Companies which had parabolic trajectories and built no loyalties. Statistically speaking, success in Apple's markets is always followed by failure.
But what if we did not seek correlation but looked for causation? What if we ignore statistics about companies other than Apple and focus on statistics about Apple's actual customers? Rather than assume all companies are the same, what if we assume that some can be exceptional? What if we we look for the anomalies, not the clusters?
We might want to ask about the causes of success or failure for a single company. We might want to sample its specific customers. We might want to observe how Apple's own customers behaved in the past. We might want to use theories of brand value or theories of network effects or theories of software ecosystems.
These measures, rather than those of "comparable companies" might lead to different conclusions: That customers are loyal, that they will value the brand and that they are invested in a network. In other words, that they will buy from Apple again.
If we then factor in the size and persistence of Apple's audience (customer base) we might conclude that there are factors which will allow it to grow rather than shrink. My analysis based on public data shows that the customer base has been increasing steadily.
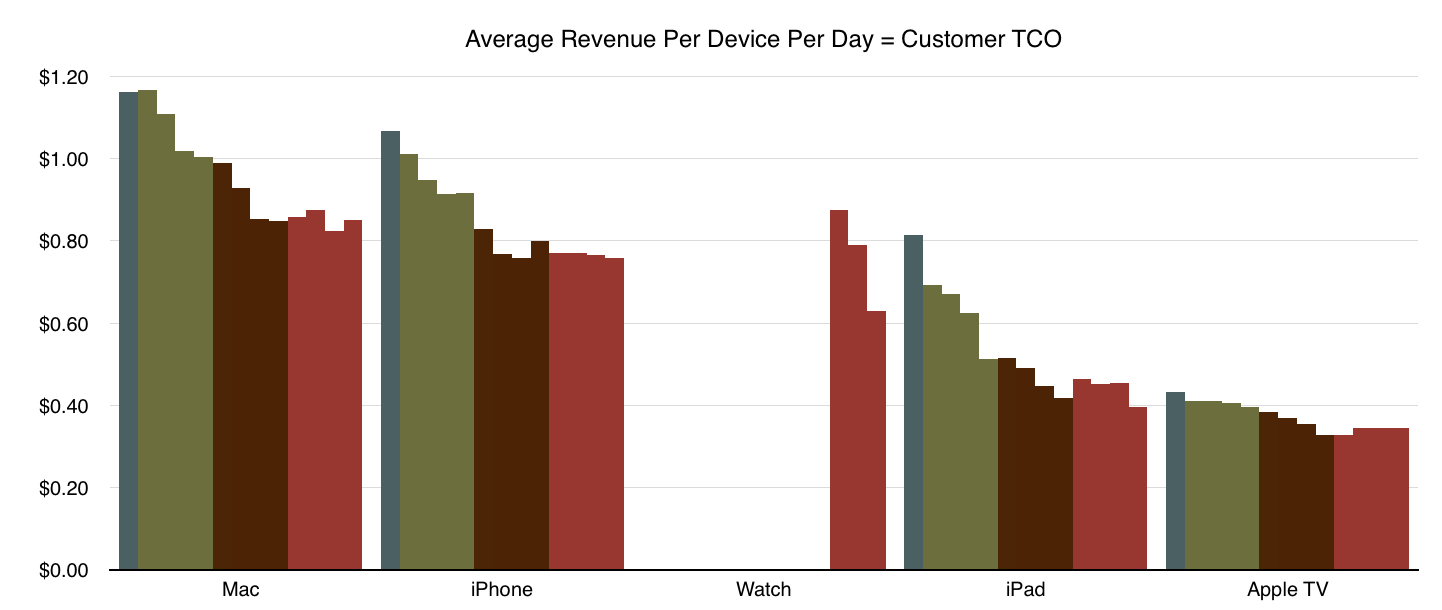
Considering this audience and the revenues generated, we can categorize the revenue by active device as follows.
Each bar represents that product's revenue per day in a given quarter (from Q4 2012 to Q4 2015). Each year is therefore represented by a different color. Dark green for 2012, light green for 2013, burgundy red for 2014 and dark red for 2015. For example, each iPhone in use was generating exactly $1/day in revenues (including services and accessories) during the first quarter 2013.
This allocates all of Apple's revenues to these products and by proxy to customers.
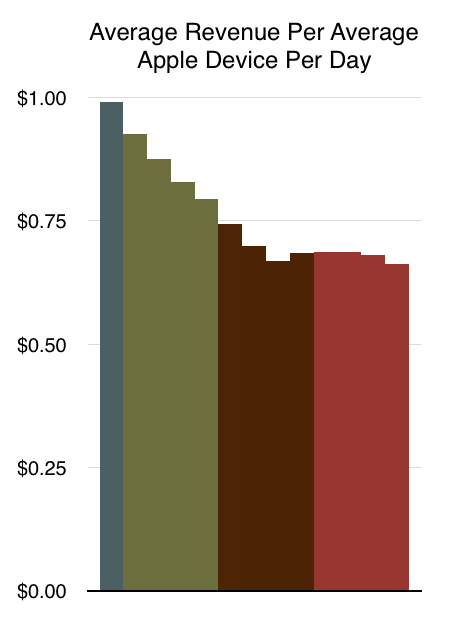
In summary, the "average revenue per Apple device per day" is currently $0.68. If we assume one unique user per device then Apple collects 68 cents from each customer each day. ((In reality the figure may be closer to $1, as there are likely to be more 1.2 to 1.5 devices per person.))
Combining the history of customer creation and customer preservation with the value obtained from each customer implies that the next 40 years will be about creating another large tranche of customers whose willingness to spend on whatever Apple creates will be relatively unchanged.
We don't know the limit. One billion was hard to imagine even one year ago. We might see two billion devices in short order. Perhaps not. Perhaps as we have a multitude of devices about us all day the number will become less meaningful. But if the number of middle class customers grows and as Apple keeps its products within their reach, there is no reason to think that there will be a reversal of the last 40 years in terms of customer acquisition.
This analysis contradicts the current perception of the company as reflected by its stock price. That price assumes the audience will wither ((With a P/E ratio of 11, without a change in revenue per user, the only justification would be the audience shrinking by more than 90% over the next 20 years.)) That is not insanity. It is what we could expect if Apple were unexceptional.
We could surrender to correlation and ignore causation but statistics show that such an approach rarely works.
-------
Incidentally, this and a lot more will be discussed at the next Subscribe conference.
How Apple is managed is one of its enduring mysteries. The idea that a company with $235 billion in sales is managed with a single P/L ((Profit and Loss statement is an income statement usually applied for a subset of a larger company which allows subdivisions to be managed individually.)) is fascinating in many ways. Not least of which is how it allocates resources. The fundamental question of which great idea gets to be funded and which great idea gets to be ignored is the core of every manager's dilemma. The Apple problem is at scale when each decision's consequences are so momentous. In the case of Apple there are so few projects that reach the market and their impact is so great that one wonders how they can be sure they are doing the right thing.
Conventionally, product development is filtered through a sieve of metrics, market sizing and impact on top/bottom income lines. These "financial" measures of success are considered prudent and optimized for return on equity (also known as the maximization of shareholder returns).
But this can be a toxic formula. The financial optimization algorithm always prioritizes the known over the unknown since the known can be measured and is assigned a quantum of value while the unknown is "discounted" with a steep hurdle rate, and assigned a near zero net present value. Thus the financial algorithm leads to promoting efficiency at the expense of creation. Efficiency may be the right priority when times are difficult and resources are scarce but creativity is the right priority in a time of plenty. And abundance is what being big is all about.
To allow for some creation large firms create divisions. Some divisions are tasked with "core products" which are measured by a set of firm metrics and some are tasked with "emerging products" which are given a set of loose metrics. This leads to obvious resentment and war between divisions when resources need allocating.
Ominously, the core divisions tend to always win. At the root of divisional power struggles are measurements--the roots of financial metrics. Managers fight with data. "You can't manage what you can't measure" they're taught. But if you have something that can be easily measured and something that is difficult to measure, won't the easily-measured be managed and the hard-to-measure be ignored?
There is a general principle at work here: Managing by measurement is fraught with the pitfall of measuring the wrong thing. Making sure that you're measuring the right thing becomes the value-adding role of the manager. A role that is increasingly being neglected.
The mass phenomenon of measuring the wrong thing because it's the easiest to measure is called "financialization". Financialization is the process by which finance and finances (rather than creation) determine company, individual and society's priorities. It comes about from an abundance of data that leads to fixation on what is observable to the detriment of awareness of hazards or obstacles or alternatives. This phenomenon is more likely when the speed of change increases and decision cycles shorten.
Financialization is creeping into all aspects of society and the extent to which it infects companies is the extent to which they suffer from early mortality.
So is Apple avoiding financialization? How can anyone avoid the tyranny of mis-optimization?
The unified P/L might be a clue. It obviates the need for divisional rivalry and power-based or financial politics. Without divisional P/L, management can be organized functionally with the obvious benefit of de-politicization. The singular P/L does create another problem however: the absence of an alternative resource allocation algorithm centralizes the decision. By centralizing decisions at the highest level, few decisions can be taken and that means each decision has to be right more often. We swap a distributed but financialized process for a central but capricious one.
So how is the central decision process made fair? What guides the allocation process?
I believe that Apple does not avoid quantified decision making. I believe the logic of their decisions is based on a nuanced quantification of the company's customer base. Opting to think about how many customers they have rather than how many things they can sell could offer the Apple manager a better decision tool, avoiding financialization and mis-optimization.
The guiding principle is putting the customer rather than the firm at the center of the decision process. The idea of this change of orientation extends to a re-definition of the purpose of the firm. Apple calls it its "North Star" and it places "making the best product" at that location.
The challenge is how to measure "goodness" of product. It's easy to overshoot "best" and become too good. What regulates greatness is another measurement: absorption of what you create. The true orientation (which Apple won't confess to) is absorbable greatness.
Absorbable greatness is measured through other proxies: customer creation, customer satisfaction, and customer retention. By adding and preserving great customers you can be sure that what you create is indeed the "best". Setting the goal, and indeed the purpose of the firm, as the creation and preservation of customers seems to be the unwritten constitution of Apple.
The idea that the purpose of the firm is to create and maintain customers is not new ((Customer creation is in contrast to the notion that the purpose of the firm is to maximize shareholder returns. The notion of customer creation as primary purpose was popularized by Peter Drucker. The notion of optimization through shareholder value creation was popularized by Jack Welch.)) but it is relatively rarely practiced. The reason is that the data is harder to obtain. The data that comes from sales is crisp and concrete. The data about customers is muddy and soft. In a world where spreadsheets are used as weapons, the crisper the data, the better the ammunition.
Clarity wins arguments but it may not be where salvation or truth can be found. Good judgement in a cloudy reality is a better compass than a clear road map to a fantasy world.
Optimizing around customer acquisition rather than equity returns leads to a new set of metrics. What would these metrics look like for Apple?
The company publicly offers three separate sets of quantity of customers and quality of customers.
In terms of quantity we have:
Number of iTunes accounts
Number of iCloud accounts
Number of active devices
In terms of quality of customers we have:
Average selling prices for devices (as a proxy for willingness to pay)
Customer satisfaction (as a proxy for loyalty )
Services and accessory revenues (post-sales and recurring value)
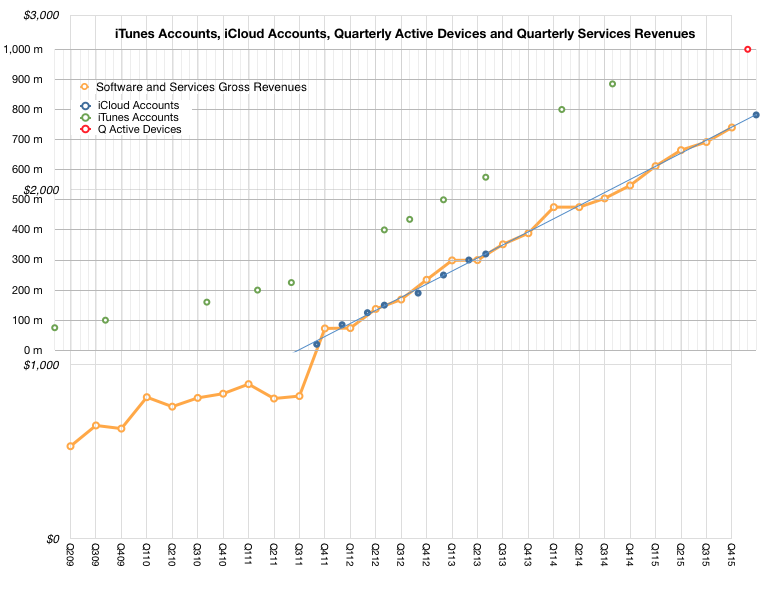
The following graph shows the historic data for service accounts and corresponding services revenues.
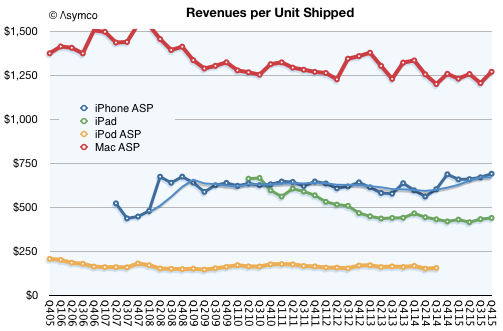
The following graph shows the average price per hardware product indicative of loyalty through stability in the face of growing competition.
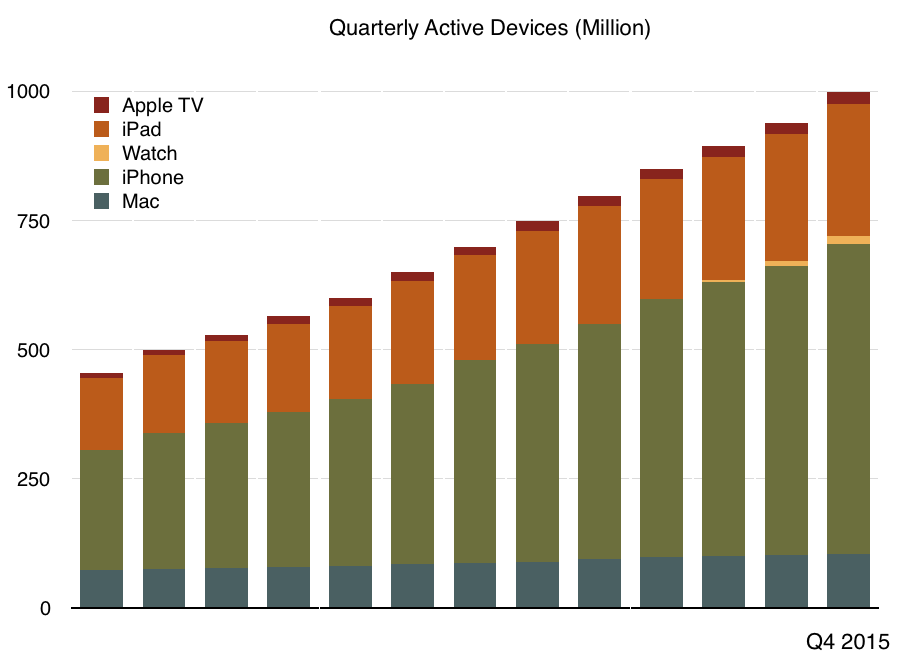
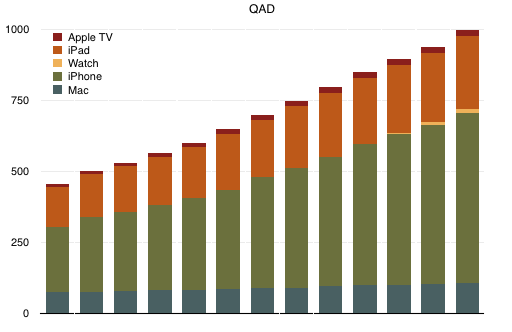
The following graph shows an estimate of growth in active devices as a proxy of customer base.
Unlike product shipments and revenue data which follow rises and falls in individual products due to the cyclicality of technology and adoption, these graphs show a smoothness and predictability of customer base behavior.
Looking at Apple this way gives the impression that the company has a large number (nearly a billion) of repeat (subscribed to service) customers. These customers can be seen to spend a predictable recurring amount (average selling price) on Apple's brand. The repetition of these metrics in public commentary suggests that customer acquisition and retention are among Apple's goals.
The key question is whether this is Apple's primary goal.
Seen this way each centralized resource allocation question can be assumed to be prefaced with "In order to create/preserve customers should we...?"
This leads to answers quite different from questions that start with "In order to sell/profit more should we...?"
For instance, offering education products, retail store experiences, healthcare products, green energy initiatives, accessories, content and services make sense even if they may have poor financial "returns". These initiatives score highly on customer retention and satisfaction. They may lead to engagement and repeat sales. Managers working on these initiatives would gain the respect of their peers, leading to more esteem and higher quality output. Finally, and most importantly, these efforts would be preserved regardless of cyclical downturns.
The assessment of analysts should therefore be couched in similar terms: "What is the impact of a new initiative in customer creation and preservation?" rather than "What is the impact of a new initiative in driving revenues and profitability".
We can see immediately why the second question is popular while the first isn't: it's easier to assess an answer to the second because we have the data that allows for its calculation.
This is why asking the wrong questions is popular.
Apple is categorized as a vendor of consumer electronics. More specifically, a member of the "Electronic Equipment" industry in the "Consumer Goods" sector. If indeed this is what it's thought to be selling, there is a problem because it isn't what its customers are buying.
Apple's customers buy a mix of hardware, software and services under a brand that assures a certain quality of experience. This bundling and integration of otherwise disparate things is why the brand is such a success.
This anomaly between what Apple is thought to sell and what buyers actually buy can leave the casual observer confused. As a result the company's categorization as vendor of hardware deeply discounts its shares. It is, in other words a less valuable business. This is because a seller of consumer electronics does not benefit from "system valuation" since there is minimal loyalty to the product after the sale.
The consumer electronics vendor has no network to leverage, no ecosystem adding value after the sale, no platform and works through multiple levels of distribution to reach the customer. In contrast, a system vendor can expect benefits from network effects, ecosystems, and a coveted relationship with the end user.
The result is that the valuation of a consumer electronics vendor is based on the momentum of individual products. Apple has always been valued this way. Each hit product is considered to be a stroke of luck/genius and the chances of recurring are discounted to about zero. Regardless of the fact that it has a track record of "home runs", Apple's hit rate is not considered sustainable. ((The P/E ratio is the primary indicator in this analysis)). Certainly Apple is not valued as being able to generate reliably recurring revenues.
But what if we were to value Apple on the basis of what people are buying rather than what it's thought to be selling?
The model is simple enough: determine the number of users, estimate the lifespan of the products, and figure out the services attached to the products; then, given the price, obtain a price per product per day. You then can get a recurring revenue figure.
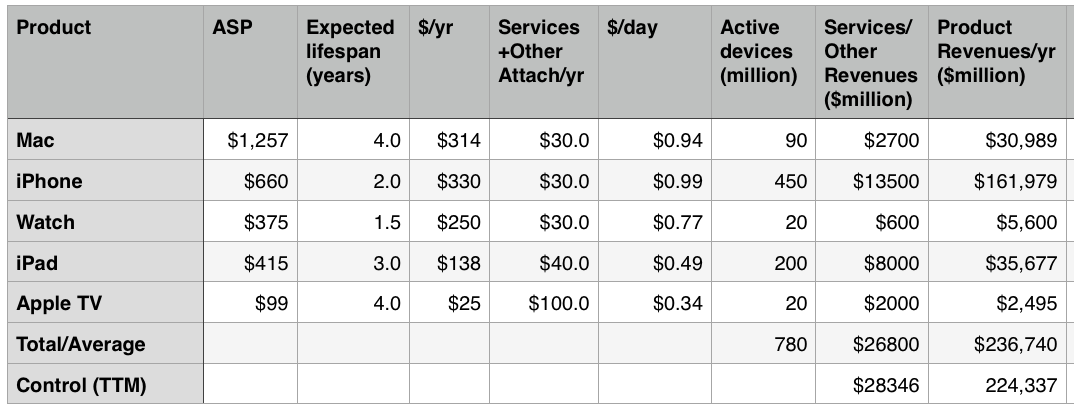
I did just that and the results are in the following table:
The first column is the product, the second is the Average Selling Price (ASP), the third is the expected lifespan of the product, and the fourth column is a calculation of the end user’s “spending per year” on the product.
The fifth column is an estimate of the revenues from Apple's Services and "Other" groups from post-sale revenues attached to the product. This Services revenue includes AppleCare, iCloud, Music, App Store, other stores, Beats, accessories, iAd, and Made for i (MFI) licensing. It also includes Google traffic acquisition revenues and other licensing.
The sixth column is an estimate of the consumer "spend per day" on Apple's product lines taking into consideration Services.
The seventh column is an estimate of the number of active devices in the hands of users. Note that these are expected to change over time.
The eighth column is a calculation of Services/Other income on a per-product allocation. This is a test of the Services+Other estimate and is meant to sum to nearly what Apple currently reports as Services+Other revenues.
The ninth column is a test of overall revenues on a per-product allocation. This should add up to total revenues (estimated for next year.) ((Naturally, the active devices estimate is the most sensitive but it should be tweaked to create a reasonable forecast for next year.))
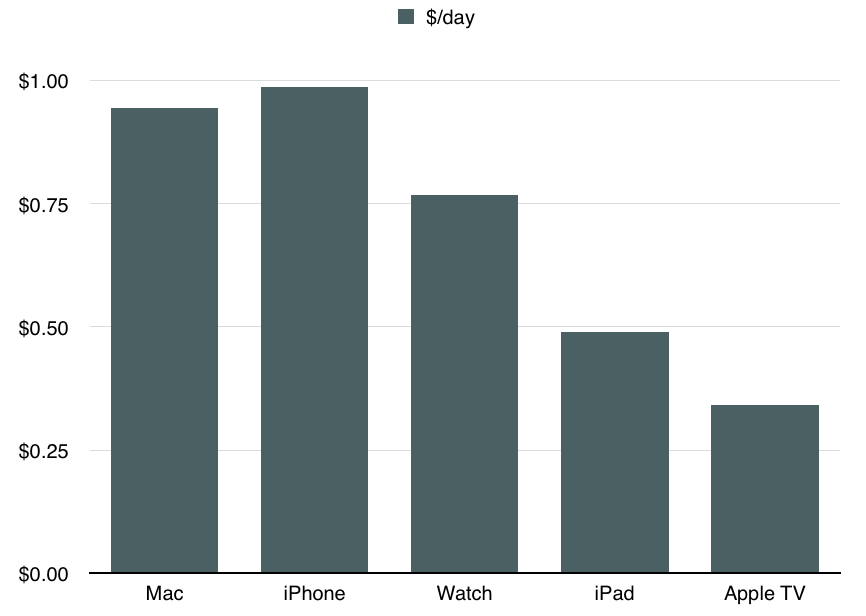
The bottom line is the following graph which shows the revenue per device per day inclusive of Services and Other income (The sixth column).
This is, in my opinion, a reasonable way to approach valuation of Apple as a business. It's also a way to inspect its strategy.
As a valuation we can easily obtain the net present value. The model gives us sales and by estimating a net margin (which is remarkably steady around 22%) we can get the free cash flow.Iterate into perpetuity with a discount rate, and you can get the net present value of the company. With a modest growth rate leading to a billion active devices in use and a normalized revenue per device of $0.92 you can easily see cash flows equivalent to $1 trillion in present value.
But much more interesting than this value is the notion that Apple is in business to deliver a product/service mix to loyal customers and to preserve their loyalty through constant improvement and innovation. You can see strategic intent in increasing the attach rate of services per device. You can see a strategic intent in building loyalty and the right customer base which is likely to be loyal. You can see strategic intent in the iteration of the product in a way that extends loyalty and expands the solid base but also increases the $/day rate. This analysis correctly informs almost all decisions the company makes.
What we just saw in the launch of a new Apple TV and a new iPad is consistent with this strategy. Apple TV will have a higher service attach rate with apps while keeping pricing well below consoles thus expanding the user base. The iPad is increasing in price and getting more accessories. The developers are encouraged to build richer and more valuable apps that are uniquely enabled by the new device.
The fact that Apple has just launched a subscription service for the iPhone makes what was clearly their strategy all along plain to see however it has been a strategy in effect for decades.
It isn't a difficult idea to embrace. It always surprises me that it's not more commonly held. The reason may be that Apple is mis-categorized.
Or perhaps the entire categorization of industries and sectors is obsolete in what is a new post-industrial age. Some have figured this out already. Others will take longer.