Asymco

Asymmetric Intelligence

advertising

  1. Do ads work? The ad budgets of various companies

    Research · 59 comments

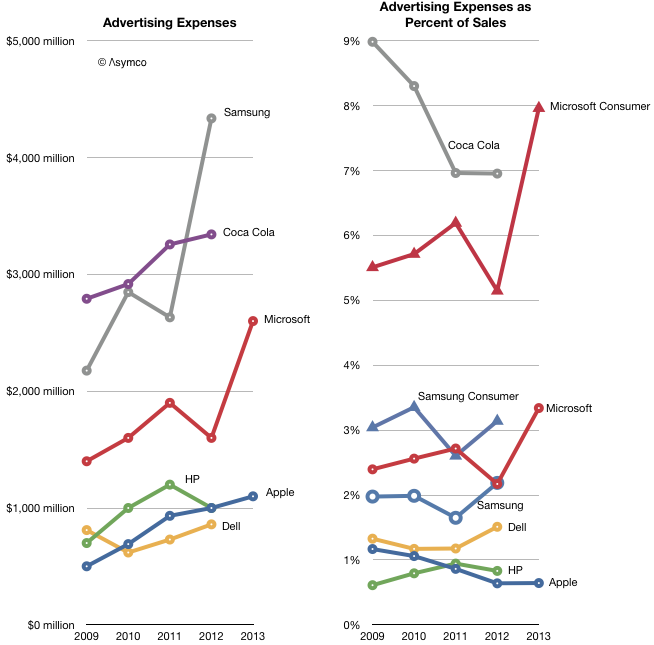
    Microsoft spent $2.6 billion for Advertising in the fiscal year ended June. Apple spent $1.1 billion in its fiscal year ended October.

    Other companies will report their full year ad spending later but their previous years' spending is shown below.

    Screen Shot 2013-11-04 at 11-4-4.55.03 PM

    I added a second graph showing the percent of sales that each ad budget represents. Note that Coca Cola retains the crown as the most prolific advertiser when it comes to budgeting. ((Think of it as 7 percent of every Coke purchase going to pay for the ad that presumably got you to buy it.))

    However, Microsoft is climbing into a region of 3 to 5% of sales. What's even more striking is that we can isolate the revenues which are actually being targeted by the ads: consumers. Microsoft's Business and Server and Tools divisions may have some ad budget but it's likely to be much smaller than the Windows, Entertainment and Online divisions.

    When the ad budget is measured as a percent of consumer sales, Microsoft suddenly looks like the biggest spender overtaking even Coca-Cola. ((Note that Samsung can also be similarly split into consumer vs. total.)) I don't know what to make of this. It seems extraordinary that Microsoft needs the same level of effort to sell software (and some hardware) as Coca Cola does to sell soft drinks. Coca Cola spends heavily to preserve brand value for what is essentially a commodity product. Is this the way to read Microsoft's marketing?

    It's also interesting that Apple spends the least (nearly) in absolute terms and fractionally less (one twelfth) in relative terms. This is in contrast to the alternatives above. The stronger, more differentiated the product, the less it needs to be propped up by the ad.


  2. Owing how much to how few?

    Research · 7 comments

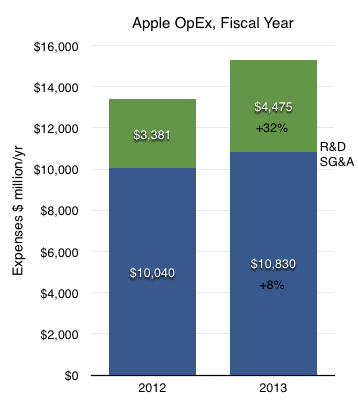
    For the year ending October Apple's R&D costs were $4.475 billion. These costs have been rising. Though, as the company explains, not faster than net sales:

    The growth in R&D expense was driven by an increase in headcount and related expenses to support expanded R&D activities. Although total R&D expense increased 32% and 39% in 2013 and 2012, respectively, it remained fairly consistent as a percentage of net sales.

    [My emphasis]

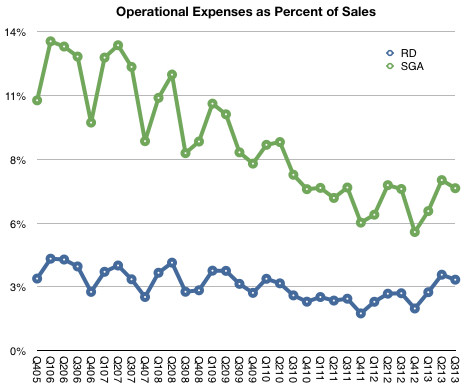
    We can see this in the following graph:

    Screen Shot 2013-11-01 at 11-1-4.37.48 PM

    R&D has remained very nearly 3% of sales since at least 2005.


    SG&A Expenses barely grew however:

    The growth in SG&A during 2013 was primarily due to the Company’s continued expansion of its Retail segment and increased headcount and related expenses, partially offset by decreased spending on professional services.

    The change in R&D and SG&A on a full-year basis is shown below.

    Screen Shot 2013-11-01 at 11-1-4.42.06 PM

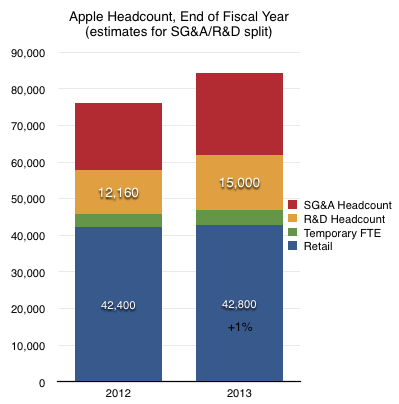
    I emphasized the mention of increases in headcount. We cannot know with any precision what portion of last year's $15 billion in operating expenses went toward wage expenses since there are other costs such as advertising ((Apple's advertising expenditures for fiscal 2013 were $1.1 billion or 10% of SG&A or 0.64% of sales.)) commissions and public relations in the case of SG&A and outside services, equipment leases, in the case of R&D. However, it's more likely that wage expenses are a far larger proportion of total R&D than they are of SG&A.

    My estimate, based on wage rates, is that there are approximately 15,000 R&D staff at Apple.

    Screen Shot 2013-11-01 at 11-1-4.42.49 PM

    If we divide sales by this number we get $11.4 million in sales per engineer.

  3. The newly integrated company

    Research · 25 comments

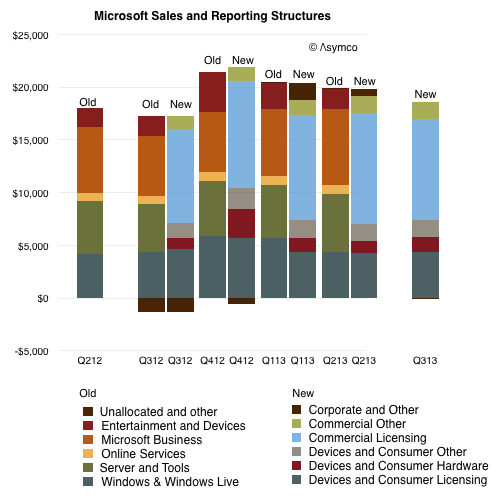
    During the first quarter of fiscal year 2014, we changed our organizational structure as part of our transformation to a devices and services company. As a result of these changes, information that our chief operating decision maker regularly reviews for purposes of allocating resources and assessing performance changed. Therefore, beginning in fiscal year 2014, we are reporting our financial performance based on our new segments; Devices and Consumer (“D&C”) Licensing, D&C Hardware, D&C Other, Commercial Licensing, and Commercial Other.

    The previous reporting segments were:

    • Windows & Windows Live
    • Server and Tools
    • Online Services
    • Microsoft Business
    • Entertainment and Devices
    • Unallocated and other

    The new are:

    • D&C Licensing: Windows OEM licensing, Consumer Windows, Consumer Office, Windows Phone (including related patent licensing)
    • D&C Hardware:  Xbox 360, second-party and third-party video games, and Xbox LIVE subscriptions; Surface; PC accessories
    • D&C Other: Resale, including Windows Store, Xbox LIVE transactions, Windows Phone Marketplace; search advertising; display advertising; Subscriptions including Office 365 Home Premium; Studios including first-party video games; retail stores.
    • Commercial Licensing: Windows Server, Microsoft SQL Server, Visual Studio, System Center; Windows Embedded; volume licensing of Windows; Microsoft Office for business (Office, Exchange, SharePoint, and Lync); Client Access Licenses;  Dynamics, Skype.
    • Commercial Other: Enterprise Services, including Premier product support services and Microsoft Consulting Services; Cloud Services, comprising O365, other Microsoft Office online offerings, Dynamics CRM Online, and Windows Azure.

    From Microsoft's FY14 Q1 10Q via Microsoft Investor Relations - Press Releases

    The mapping between the old and new is not straight forward. There is overlap between D&C Licensing and the old Windows and perhaps between Entertainment and Devices and D&C Hardware but there are many gaps. There is also some overlap between the old "Business"/"Server" segments and the new "Commercial" but, again, they cannot be matched.

    I show the difference between the two structures in the way revenues are allocated below, using color to try to show similarities.

    Screen Shot 2013-10-25 at 10-25-11.25.07 AM

    Given the re-stated quarters it's possible to compare one year's historic performance at a segment level. For example, the company states that "Devices and Consumer revenue grew 4% to $7.46 billion" while "Commercial revenue grew 10% to $11.20 billion".

    Since we don't have data older than one year, our ability to assess the company over longer time periods will be drastically reduced and a new picture will take a long time to emerge.

    There is however one aspect of the new structure that needs to be appreciated right away: the allocation of costs has changed fundamentally. The company explains:

    Cost of revenue is directly charged to the D&C Hardware segment. For the remaining segments, cost of revenue is directly charged in most cases and allocated in certain cases, generally using a relative revenue methodology.

    We do not allocate operating expenses to our segments. Rather, we allocate them to our two segment groups, Devices and Consumer and Commercial. Due to the integrated structure of our business, allocations of expenses are made in certain cases to incent[sic] cross-collaboration among our segment groups so that a segment group is not solely burdened by the cost of a mutually beneficial activity as we seek to deliver seamless experiences across devices, whether on premise or in the cloud.

    [my emphasis]

    In that brief paragraph Microsoft has formally and in a financially binding way declared itself to being a functional organization. ((Welcome to the club.))

    The mechanism seems banal: operating costs are no longer assigned to product divisions but to two large buckets. In practice this means that profitability (P/L) cannot be assessed or assigned to individual managers. The lack of P/L responsibility means that incentives from top to bottom have to be re-engineered. If this goes wrong, the Assets ((read: people)) of the company could evaporate.

    If the assets go, then processes and priorities are for naught.

    In other words, what the company is undertaking is a priority shift (to a  functional structure to create integrated experiences) which requires a process change (whereby employees work according to new incentives) while preserving the fragile assets the company depends on (a motivated and skilled base of employees.)

    This makeover is as ambitious as a re-org gets and the context, scope and target are as difficult as they can be. This is, after all, the largest software company operating the the most dynamic industry whose multi-sided markets are notoriously volatile due to disruptive forces.

    The challenge also suggests why Ballmer left and who should replace him. A priority transplant operation requires a different set of skills than those held by the manager who created the processes for the previous set of priorities. That's the manager's dilemma: even if you foresee the changes needed and push for them to be enacted, your reward might be to be replaced by someone who can make the changes happen.

    Those who envision and persuade for change are rarely allowed to enact it.

  4. Making rain

    Podcast · 72 comments

    The following is a slightly edited transcript of a portion of the Critical Path podcast #79. I am reproducing it here for the sake of brevity and focus of discussion.

    ---

    I'm going to try to put together an analogy together here that maybe will help us think through the Facebook Home and the Google Fiber issue.

    I've been thinking a lot about how to illustrate Google's business model. The problem is that discussion has been polarized: Two camps have formed. One camp suggests that Google is a benevolent entity that does great things and only asks that we indulge their hobby of a business model called advertising. Fundamentally they are about pushing the envelope on technology, making wonderful things happen.

    That is one camp. I call them the utopians. It may not be a nice thing to call them but I frame it as being exceedingly idealistic.

    The anti-utopian camp is one that suggests that Google is an advertising company primarily, and fundamentally and overwhelmingly. And anything they do technologically is in support of that. The implication is that Google is sinister and manipulative, bent on getting away with as much privacy extraction as possible.

    I believe that the anti-utopians dismissing Google as an advertising company sounds a bit incomplete. It's not incorrect. It's not erroneous. It's just not a complete story.

    And also the utopian view that they do everything for us out of the goodness of their hearts and that advertising is something that they are reluctant to do, saying in effect, "We only do it because it earns us enough money so that we can do good deeds." That too is not an accurate picture. Google is a business and its business management team is hard nosed and knows what they're doing and they are not purely idealistic in that sense.

    And so the question could be where across this spectrum does Google lie? Possibly it moves around between these points. Where they are becomes a question of motivation and what they want to become.

    But this is only one dimension. It does not help us answer the question of Home, or Fiber or Reader or Blink. Their actions seem contradictory. Holistic or selfless in one case, greedy and capricious in another.

    Let's step out of this spectrum and try to think of different ways which can describe the situation.

    I propose a way to think about it as: Google tries to make a business succeed through having a huge amount of _flow_ in terms of data, traffic, queries and information that is indexed. So think about this idea of them tapping into a vast stream. The more volume that is flowing through the system the more revenue they generate.

    As so given this very rough analogy I try to sharpen it up by saying: imagine it more as a river. And even more than a river, as a watershed, a river basin. Perhaps a giant basin the size of a continent. The business is, let's say, capturing fish at the mouth of the biggest river, before it exits into the ocean at its delta.

    And so your job (as Google) is to catch fish mostly at one point. It's the most efficient way to catch fish because you have the most flow of water at that point and building nets is not trivial.

    But in order for you to improve your business, to create more opportunity, presumably, you want to essentially have more water flowing.

    And so how would you do that? Think of the Mississippi river. If you've got a net down at the bottom of the river, the question is how would you engineer, through civil engineering, or shaping the earth itself, a way of catching more fish.

    The answer I think, in terms of the way Google might be thinking, is that they want to create more sources of water. So they would look to connect tributaries and lakes. "How about having another river join our river?" Let's make sure that we have "everything east of the Rockies" flow into our river system.

    Now, think of it this way: After you've gotten all the tributaries, what are the remaining sources?

    First, you'll want to make sure that no-one can dam or stop the flow of water into your main channels. And so you become extremely anxious about people building dams. That's the number one concern.

    So your strategy becomes one of "how do we avoid dam building"?

    That's one part of your strategy.

    The other thing you could do to improve your business would be to make it rain more. So there's the question in your mind of: If we had more rainfall, then everything will flow more rapidly and we'll get many more tiny rivers forming and joining together into our main river.

    Android and the Fiber business and even Facebook fit into this analogy rather well. In this context more rainfall means more people using the Internet. If you have more people you'll have more rivers and you'll have more water and hopefully more fish. Fiber means the water will flow more rapidly: you're essentially dredging the riverbed.

    But the two are very disconnected (rain, dredging and fish). So your strategy amounts to not really worrying about the ratio. You don't create incentives to people who make rain in the form of fish catch quotas next quarter.

    In other words, your performance as a manager of cloud seeding efforts should not be measured in fish.

    Leadership should instead simply put out the mandate of "Go out and make it rain".

    So that's the notion of Google going out on these projects and doing all these "great things" for us. They make it rain. The Internet expands. There is minimal censorship.

    By the way, censorship is a dam. Being blocked out of a country is a huge dam. It's actually more like building a mountain range that diverts water flow away from your watershed.

    And so they have these notions of how to prevent these things from happening.

    So it sounds like they are doing good things. It sounds like asking for it to rain; they want to make sure that people don't divert resources; they want to make sure that there are no barriers between the raindrop and getting access to the channel to the ocean.

    So it sounds like they're doing all the good things like a good civil engineer. Like the US Army Corps of Engineers who developed the irrigation, flood control, energy generation and waterway transportation of the United States.

    Google seems to be the world's "internet civil engineer". They are building all these things to make sure that we have good water (i.e internet) supply. That we have plenty of navigable channels. That's the analogy.

    But let's not forget that the only reasons those things are happening is because they are catching fish at some point down the Mississippi.

    From that point of view you have to ask yourself: do they deserve this concession? Because they are ultimately affecting the environment to such a degree; and the environment is the internet; and the whole scope is how the world operates.

    That is where people have to step back and ask themselves: Even a group of civil engineers that have all the best intentions may realize that they didn't think of all the consequences of their actions. A lot of the criticisms may come decades later. From people who'll note an effect on the environment. Dams get silted, a lack of floods reduces nutrients to crops which then need fertilizer, which has a whole other set of problems.

    That is when you have to reflect more deeply on what is right and what is wrong. So saying, as the City Council of Austin might: thank you for coming and paying for installing broadband for us. Fine, but we just don't know what the unintended consequences might be. It all _sounds_ good but we don't know if it _is_ good.

    And similarly, in the case of Facebook, there is a subtle hijacking going on where Android creates more rain, and Facebook and Amazon are essentially putting down nets and catching fish upstream. They're not damming the tributaries. They're not putting up mountain ranges and saying they'll make sure the water flows away from the Mississippi. But rather they are putting nets and saying "Thanks for the rain". They took advantage of what amounts to a public resource. Here the failure of anticipating consequences falls on Google. But they could not have possibly foreseen all that? Or could they?

    Then there is the question of measuring success. It's complicated and hard to measure performance. Even Google's own performance. We don't really know if the cloud projects work. We don't get to run this as an experiment that can be tweaked as data comes in.

    Google does not report performance. When they go off on these rain making projects, it's natural to ask how many fish were caught as a result. Is that incremental new rainfall causing more fish to get caught. And Google won't say anything about the profitability of rain making. They will never give you a profit and loss statement for all these projects: the dam eradication project, the project dredge a channel, the project to seed clouds. They will say that these are projects that will result in only one thing, which we do measure, which is the number of fish we catch in the delta of the Mississippi down by New Orleans. But so far although rainfall seems to be increasing exponentially there are not that many new fish.

    So that's where we struggle as analysts: is rainmaking good? Is the dam destruction process working? We can't answer these question. And we don't even know if Google themselves can. They might think of it as a strategic thing: it's always better to have more rain than less and more water flowing. End of discussion.

    To borrow a phrase from Zuckerberg, it's above my pay grade to know what all the consequences are. I have opinions as environmentalists have opinions and sometimes they have some data to back up those opinions. For instance whether a dam project is a good thing on balance. But they are bound to have partial answers because the cost/benefit analysis is definitely missing a lot of the costs and missing a lot of the benefits as well. You can't put a number on a lot of these things.

    That's where we are today. Google and Android are forces which are are very powerful but which are, to a large degree, uncontrolled, even by their own managers.

     

  5. Samsung vs. Google: an Interview with Rafael Barbosa Barifouse of Redacao Epoca

    Research · 60 comments

    On Mar 18, 2013, Rafael Barbosa Barifouse - Redacao Epoca - Editora Globo asked (and I answered):

    Q: Why is Samsung creating Tizen?

    A: I believe they are collaborating on Tizen development because they want an alternative to Android and because Bada was not good enough to meet that goal. Tizen's roots include contributions from Intel, Nokia and several Japanese companies so it's not Samsung's OS per se. Historically it was the "open" alternative operating system for embedded and mobile systems. See https://github.com/kumadasu/tizen-history/blob/master/tizen-history.pdf for a historic perspective.

    In some ways Tizen seems to be a blend of several pieces of code including proprietary Samsung user interfaces. Samsung is presumably interested in having a unique, differentiated experience. This is something every device maker seeks. Put another way, if they did not seek this then it's unlikely that they would be profitable which would also imply that they would not invest in marketing and development of products. As Samsung invests both in marketing and development it can be concluded that they seek to offer a unique value proposition and, in today's market, that means a unique experience.

    Does it make sense to create a new mobile OS when it has had so much success with Android?

    Samsung would argue that the success it's had is not due to Android but to its products. Arguably they are right because if Android were the valuable component in a phone then buyers would buy the absolute cheapest device that runs Android regardless of brand. That is not the case. People still seek out a particular brand of phone because of the promise it offers. Consumers have been buying more Galaxies than no-name Android phones.

    Why is Samsung the most successful company between the Android devices makers?

    In my opinion it's due to three reasons:

    1. Distribution. Success in the phone business depends in having a relationship with a large number of operators. Samsung had these relationships prior to becoming a smartphone vendor [because it sold all other kinds of phones]. Few alternative Android vendors have the level of distribution Samsung has. For comparison Apple has less than half the distribution level of Samsung and most other vendors have less than Apple.
    2. Marketing and promotion. Samsung Electronics spent nearly $12 billion in 2012 on marketing expenses of which $4 billion (est.) was on advertising. Few Android vendors (or any other company) has the resources to match this level of marketing. For comparison, Apple's 2012 advertising spending was one quarter of Samsung's.
    3. Supply chain. Samsung can supply the market in large quantities. This is partly due to having their own semiconductor production facilities. Those facilities were in a large part built using Apple contract revenues over the years they supplied iPhone, iPad and iPod components. No Android competitors (except for LG perhaps) had either the capacity to produce components or the signal well in advance to enter the market in volume as Samsung did by being an iPhone supplier.

    Tizen was being treated as an OS for low and mid level devices, but recently Samsung said that it will launch a high-end device with Tizen on Q3, an area where it's very successful with Android. What has changed? What does this announcement mean?

    Planning for these product launches is done a few years prior to launch. I believe alternatives to the Android line (i.e. Galaxy) have been planned for a long time. Note that Samsung also has a line of Windows Phones and historically has supported Bada, Windows Mobile, Symbian, PalmOS and LiMo smartphone platforms. Samsung's involvement with Android is only about three years old, and arguably only enjoyed two years of prominent growth. That's less than one product launch cycle and far less than a platform or OS development cycle.

    I believe the company has a long term perspective and that includes a time span beyond the likely lifetime of Android [Note that platforms do have finite lives]. Keep in mind that phones last less than two years. If users are not loyal to a platform then they will very quickly move on. The "stickyness" of a platform depends on media or software consumption by the user. That level of consumption is not particularly high for most Android users. The same phenomenon happened with Symbian and BlackBerry and Windows Mobile users. Hundreds of millions switched or will switch out of those platforms. This happens far less with iOS, Mac OS X and Windows because of the significant investments users make in the ecosystems above the OS.

    Is Google dependent on Samsung's sucess with Android? Or Samsung is more dependent on Android since its the most popular mobile OS nowadays?

    Google is not dependent on Samsung because it's not dependent on Android. Samsung is not dependent on Google because Samsung is not dependent on Android. Android is valuable in theory but in practice its value is hard to identify. Historically it was planned as a defense against the hegemony of Windows, BlackBerry and iOS. In that respect it has succeeded. But playing defense is not enough to win a game. For Google to truly succeed in mobile it needs to define a better business model.

    So far its profitability from mobile is very weak and has not shown up in the bottom line. Furthermore, it's probable that Google has 'control' over only about 40% of Android devices in use. Control here means a guarantee that users will use those devices for the benefit of Google, and, more importantly, not for the benefit of its competitors.

    You can also think of it this way: If they "divorced" there would be minimal to no impact to their fortunes in the foreseeable future. Buyers of Samsung phones will still buy Samsung phones because they will look and feel very similar and Google services will still be available through browsers or apps (e.g. Google maps on iOS). Conversely, users of Google services will continue to use them because they will be available on Samsung devices, no matter what OS is running. The services Google offers are independent of Android and are cross-platform. They will make sure they are available on all major platforms (as they were before and during Android). Google is far more loyal to Search and Maps and Gmail and YouTube than they are to Android.

    Do you think Google is going to merge Android with Chrome OS?

    Google's chairman said they would so I assume they will.

    If so, how this could make an impact on Samsung?

    It depends on how the new OS would enforce licensing terms. If the result would be a restriction on Samsung services like S Pen, AdHub, Samsung Wallet, SmartTV, ChatON etc. then Samsung might reject the OS and either fork Android or move to Tizen more broadly.

  6. The cost of selling Galaxies, updated

    Research · 63 comments

    Thanks to @jtk0621 via twitter I was able to obtain a quarterly view into Samsung's SG&A expenditures by cost category.

    The value of this data is in being able to understand why Samsung SG&A as a percent of sales remains fairly constant. To recap, the discrepancy with Samsung's SG&A is that it has grown in proportion to rapidly rising sales. Normally, when sales grow, SG&A grows but when sales grow very rapidly, SG&A grows a bit more slowly since it's primarily a function of headcount and hiring is necessarily organic and hence slower as a process.

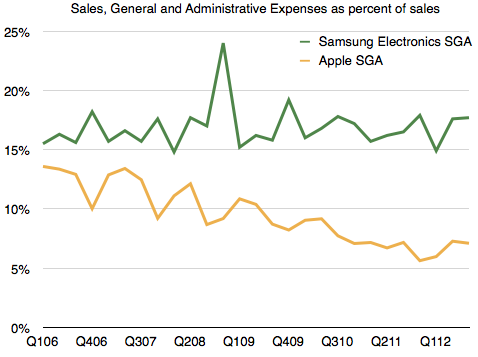
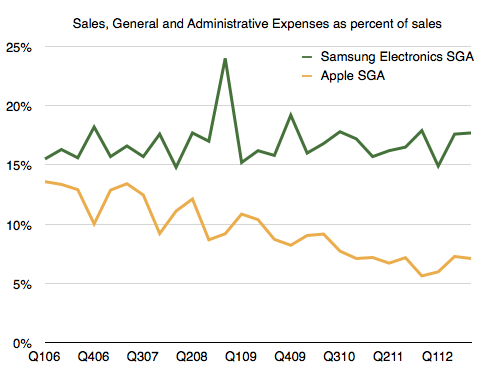
    The contrast is shown in the following comparison between Apple's SG&A and Samsung's SG&A as a percent of sales. [For more detail on Samsung revenue composition see: The Cost of Selling Galaxies].

    Screen Shot 2013-04-02 at 4-2-3.09.39 PM

    Apple's SG&A has declined as a percent of sales, as one would expect, but Samsung's hasn't.

    I have hypothesized that the reason for this might be in the practice of "outsourcing" many marketing functions. As Samsung expands promotional efforts, it does so partially by hiring people but even more so by farming out a lot more work. In this way, if and when sales subside, it can pare costs. This practice ensures that it's not exposed to a huge cost structure that is hard to control. The downside to this approach might be obtaining "quality" marketing as oversight is still depending on inside teams who still have limited resources.

    To test this hypothesis, I looked at the types of costs it reports and divided them into two categories:

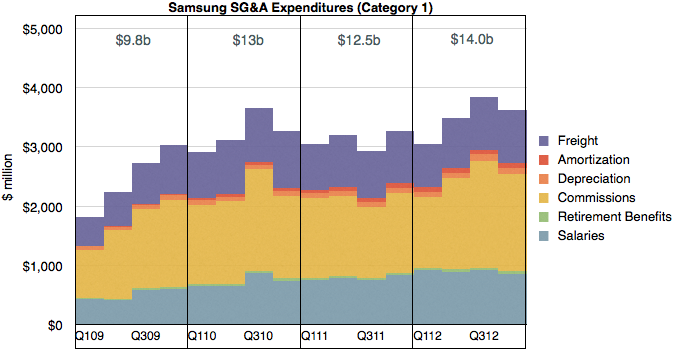
    Category 1 are what might be considered "internal" costs which are in function of employees or operations. These costs are:

    • Salaries
    • Retirement Benefits
    • Commissions
    • Depreciation
    • Amortization
    • Freight

    I graphed these costs over time below:

    Screen Shot 2013-04-02 at 4-2-3.12.09 PM

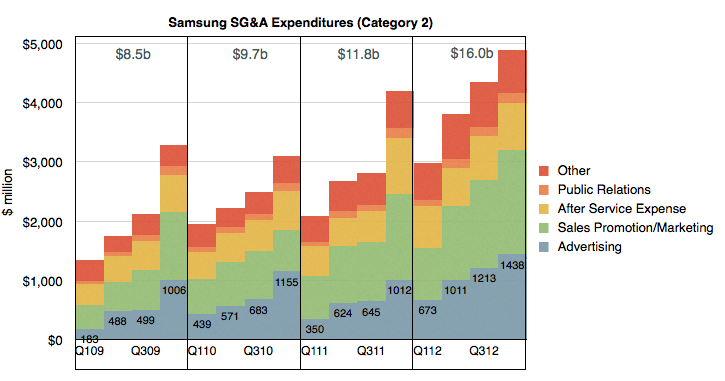
    Category 2 costs are those which can be "outsourced" and are in function of budget items. These are:

    • Advertising
    • Sales Promotion/Marketing
    • After Service Expense
    • Public Relations
    • Other

    I graphed Category 2 costs below:

    Screen Shot 2013-04-02 at 4-2-3.12.58 PM

    In both cases I created year-sized buckets summarizing these expenditure categories.

    It becomes apparent at first glance that through the period shown (2009 through 2012) Category 2 costs grew much more rapidly than Category 1. In 2009 Category 2 were less than 1 but the order was reversed in 2012. On a yearly basis Category 2 nearly doubled while Category 1 grew by about 40%.

    When seen in this context, the hypothesis is proven. The growth in Samsung SG&A has been driven by a vast expansion of primarily Advertising and Sales Promotions.

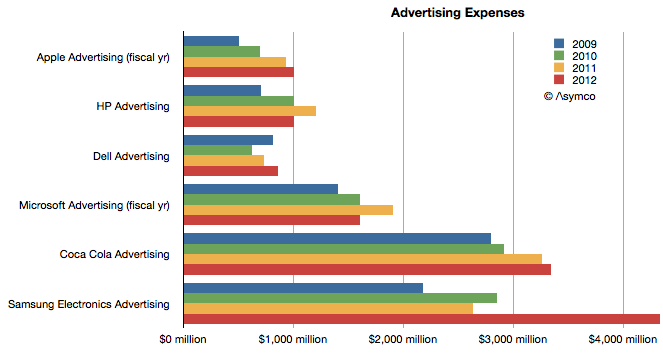
    It's hard to get an appreciation of the scale involved due to the lack of comparable SG&A category reporting from other companies.  What we do have however is that US companies typically report their advertising spending on a yearly basis.

    So taking only the Advertising figure from Samsung Electronics, we can get the following comparison with Apple, HP, Dell, Microsoft and Coca Cola.

    Screen Shot 2013-04-02 at 4-2-3.20.48 PM

    In this context we can see that while both Apple and Samsung grew their  advertising almost at the same rate, doubling their budgets during the last four years, Samsung Electronics has a far higher ad budget. More than four times higher, actually.

    Regarding Sales Promotions however, the comparison is far harder to make. I haven't any way to guess how much Apple spends relative to the $5.3 billion Samsung spent.


  7. Interview with Anouch Seydtaghia of Le Temps regarding the Galaxy S4

    Research · 78 comments

    This interview took place on the eve of the launch of the Galaxy S4. Anouch Seydtaghia is Deputy Head of the Economic & Finance Section chez Le Temps Geneva, Switzerland.

    ---

    Q: How can you explain that Samsung organizes such a huge event in NY for the S4?

    A: The S4 is a very important product as it's probably the second most profitable mobile phone in the world. Samsung is trying to position it as a premium product and is using every means available to do so.

    What are your thoughts about the huge marketing budget of Samsung?

    Samsung's marketing budget has been a constant percent of their sales (approximately). As sales have risen, the budget has risen. This is not considered a normal situation if sales grow very rapidly but Samsung seems to consider x% of sales to be appropriate spending level. Note that Apple's marketing has fallen as a percent of sales while its sales have grown dramatically.

    If we read the media, we see a lot of speculation about the features of the future S4. Can we now compare that to the expectations before a new iPhone?

    There are speculations about all phones, from Nokia to HTC and BlackBerry. I don't see the speculation to be different between all the major companies.

    Can Apple regain the lead in the smartphone market? If yes, how?

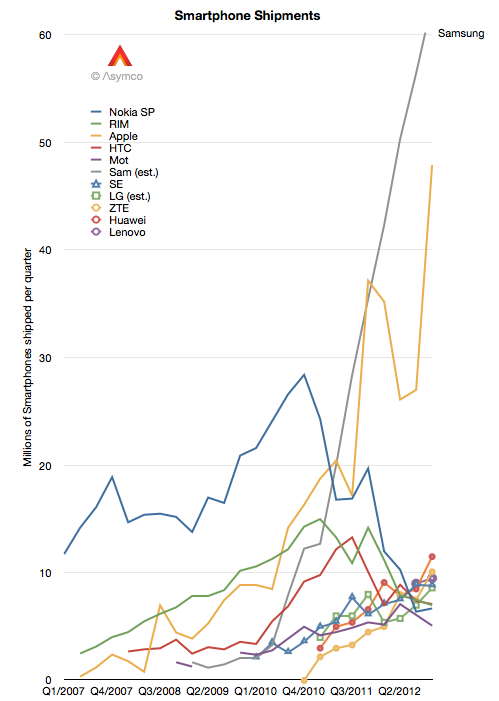
    Apple had leadership in the phone market for two quarters (see graphic below.)

    Screen Shot 2013-03-14 at 3-14-6.09.03 PM

    It's a myth to think that Apple was dominant for any extended period of time. The top spot is very difficult to obtain unless a company has a large portfolio of products which are sold in all markets. Apple has less than half the operator distribution of Samsung and keeps only one new product in the market each year.

    Apple also has a very high price due to the distribution model it uses for the iPhone. The primary buyers are operators who made large volume purchase commitments a few years ago. The iPhone strategy can be summarized as "skimming" where they pick the most profitable customers rather than "penetration" where there is a focus on market share. It's therefore very surprising that Apple was able to ship as many phones as it did.

    Is there a difference between what Samsung and Apple invest in R&D?

    Of course, but we don't have details. Samsung Electronics has to develop semiconductor processes and build large fabrication plants. Apple has a vast software engineering operation. Apple has iTunes and web services while Samsung has appliances and TVs. The two R&D efforts are vastly different.

    What could be the new features in the next smartphone?

    The most important innovation in smartphones will be a product that is not a smartphone. The category will be eliminated through a disruptive approach just like all other technologies that have come before it. My expectation is that when it comes it won't be recognized as important or relevant.

    As a follow-up:

    - Thank you very much! So do you mean that for Apple, marketing is just 1% of sales?

    It's difficult to compare the two exactly.

    We don't have specific data on Apple's marketing. We have either Advertising or SG&A (which includes marketing.) Samsung reports “Marketing Expenses” every quarter but these figures appear to be the sum of Ad spending, Sales Promotions, Public Relations and a portion of “other” expenses as a part of SG&A.

    You can see a comparison here:

    What seems to be happening is that Samsung increases its spending in proportion to sales while Apple grows marketing a bit more slowly.

    Basically, Samsung is treating SG&A as a "variable" expense which is tied to sales whereas Apple is managing it as organic growth.

    The difference might be that Marketing at Apple is mostly an internal effort and thus depending on headcount while Samsung might be spending mostly externally. If costs are internal then it would be hard to pare them down if sales slow whereas if they are external then they can easily be made variable.

    I've received comments suggesting that Samsung's approach is unorthodox and that the quality of marketing cannot be maintained if it grows as quickly as Samsung has grown it. This is a matter of speculation however.

  8. The mystery of Samsung Electronics SG&A

    Research · 40 comments

    Samsung Electronics' SG&A expenses are curiously high. Consider the following graph:

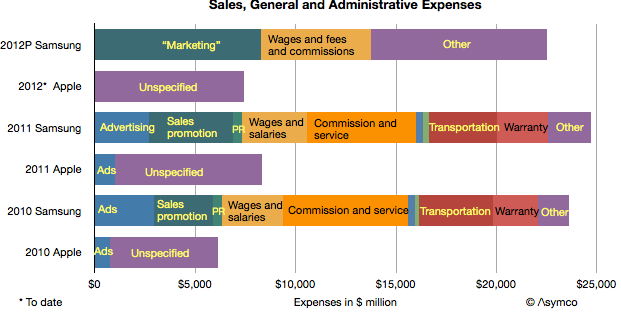
    It shows SG&A as reported by Samsung and Apple over the periods 2010, 2011 and the sum of the first three calendar quarters of 2012. Note that Samsung appears to be spending three times as much as Apple on sales and administration.

    The company offers a break-down of these SG&A costs and they are also shown (Apple does not provide a break-down except for advertising in its yearly report). The suspicion that something is not right comes from looking not only at the overall picture but the notion that Transportation, Warranty and "Other" for Samsung are higher than overall SG&A for Apple.

    Note that Apple's SG&A includes the cost to operate its retail stores. This includes the salaries and operating costs of over 300 stores.

    Considering that many of these costs are borne in the sale of products for consumers (and not borne in the sale of components such as semiconductors,)  the percent of sales of some of these expenses are:

    • Advertising: 3% of consumer sales
    • Sales promotion: 5%
    • Transportation: 4%
    • Warranties: 3%
    • Public relations: 0.5%

    Excluding wages and commissions shows a total of 15.5% of consumer sales paid in SG&A expenses. Apple's total cost for SG&A was only 6.5% overall. Advertising was 0.78%.

    I also added to the graph data for 2012 (through first three quarters.) It looks like Samsung SG&A will easily reach $30 billion this year, staying at three times Apple for another year.

    I don't have any explanation for this disparity.

  9. The cost of selling Galaxies

    Research · 234 comments

    In the post "Google vs. Samsung" I compared the profits of Google and Samsung Electronics' mobile (aka Telecoms) division. It showed how Samsung has grown its mobile business to such a degree that, if sustained, could conceivably influence the way Android is controlled.

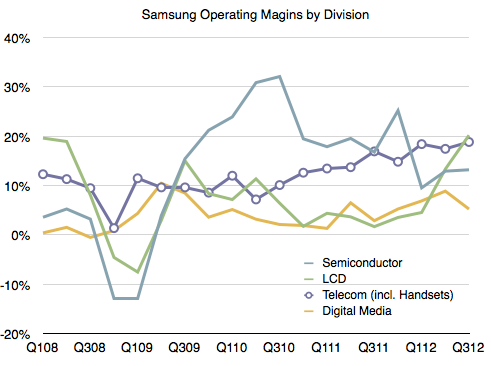
    However, we should not analyze Samsung's mobile group in isolation of the entire company. Samsung relies on internal transfer of technology and capacities of production which are quite unique for device vendors today. In other words, Samsung is a relatively integrated enterprise. Understanding the whole is necessary before understanding the part.

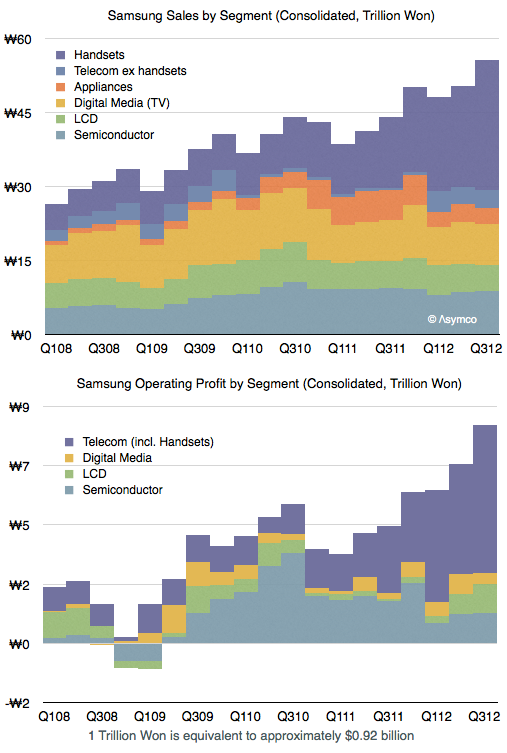
    The following graph shows the sales and operating profit for  Samsung Electronics as a composite of its divisions since early 2008.

    As one would expect, the mobile group (Telecom) is the source of both top and bottom line growth. The group has also been leading in terms of margins and increasing those margins steadily. 

    The margins averaged 11% during 2007 and 17% during the trailing four quarters. This 54% increase in margin has been matched by a 55% increase in average selling price (from $151 in 2007 to $234 in the latest quarter).

    One could argue however that a 17% operating margin from a group that is now leading in volume and price is still a bit weak. At its peak Nokia enjoyed a 25% operating margin, RIM 30% and HTC 27%. Apple's iPhone operating margin is around 45%.

    I think a large part of the margin story is a relatively high level of spending on SG&A (Sales, General and Administrative) which includes advertising, sales promotion and commissions. In the case of Samsung Electronics, as sales has grown these expenses have grown in proportion. As a percent of sales SG&A have held relatively steady at around 17%.

    Note that as Apple's sales have grown its SG&A has grown less rapidly resulting in a smaller percent over time. We might see Apple's SG&A drop to 5% during the present quarter, an all-time low.

    So one of the more remarkable aspects of Samsung's success has been their willingness to increase promotional spending. Considering that their other divisions don't require as much "marketing expense" (semiconductors, LCD certainly, and TVs and Appliances to a lesser degree due to a smaller sales growth) we can imagine that the vast majority of this promotional spending has been in support of their mobile brands, Galaxy in particular.

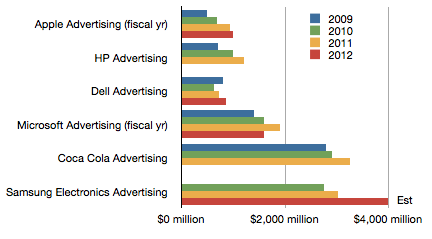
    In fact, we can obtain advertising spend data from annual reports.

    The chart above shows comparable ad spending from a cohort of technology companies as well as Coca Cola and Samsung Electronics.

    It might be surprising to note that Samsung spends considerably more than Apple and Microsoft. But it also spends more than Coca Cola, a company whose primary cost of sales is advertising.

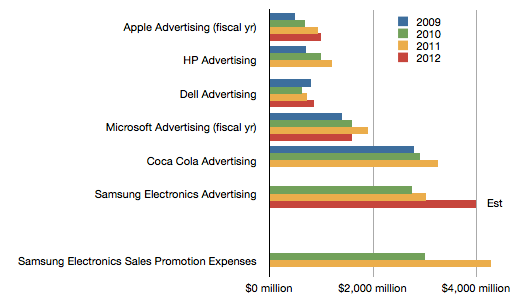
    However, advertising is not the only form of promotional spending. Samsung also pays commissions and "sales promotion". The following chart shows the value of these sales promotions relative to the ad spending budgets above.


    We don't have data on the current year since that is released after year's end, but it's interesting to note that promotions cost more than ads, which themselves are substantial relative to other companies.

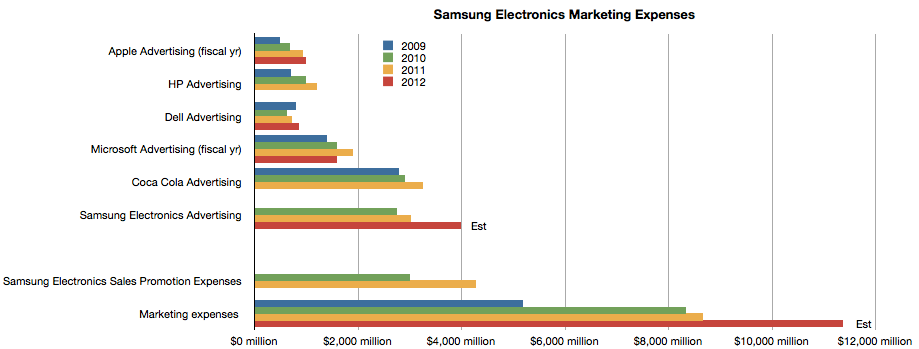
    The company also reports "Marketing Expenses" every quarter[1]. These figures appear to be the sum of Ad spending, Sales Promotions, Public Relations and a portion of "other" expenses as a part of SG&A.

    When considering all marketing expenses, Samsung Electronics' sales efforts begin to look quite astonishing.

    ---

    Notes:

    1. The data used in the latter three charts are available as a Google spreadsheet here.
  10. Nokia's Lumia brand strategy for the US

    Research · 29 comments

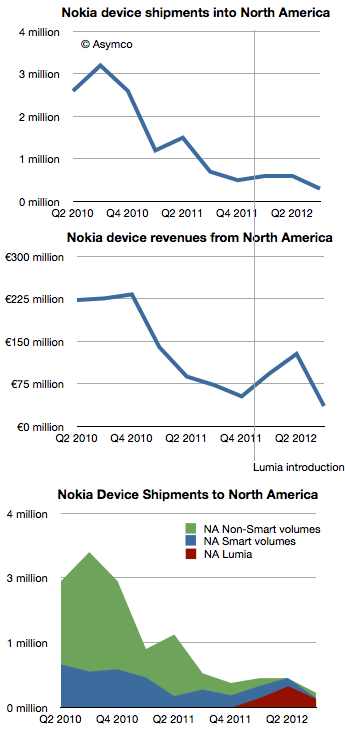
    Last July I asked the question "How many Lumia phones were shipped in the US?"

    My answer was 630k through the first half of this year.

    I revisit this question following Nokia's latest quarterly report.

    As a quick review, Nokia reported the following performance for its mobile phones operations:


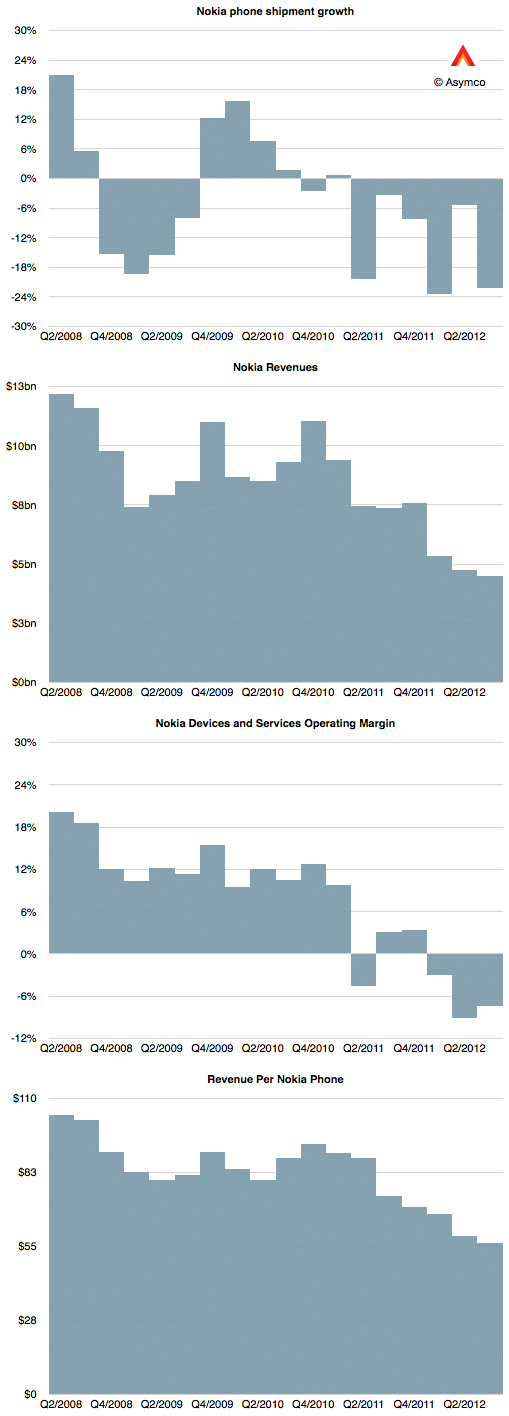
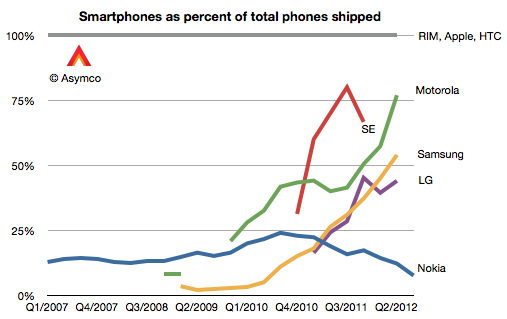
    The most worrying thing of all however is that Nokia's smartphone performance has collapsed. With only 6.3 million units shipped, the company may be the worst performer among eight competitors I track. They were below RIM's shipment total.

    The value of 6.3 represents only 7.6% of their overall phone shipments.

    As the graph above shows, Nokia is going in the wrong direction with respect to moving to a smartphone portfolio.[1]

    Of the total 6.3 million smartphones (aka smart devices, as per Nokia's reporting nomenclature) 2.9 million were Lumia Windows Phone units.

    Using information about average selling prices and total volumes into North America, I was able to estimate that there were about 180,000 units sold into North America during the last quarter.

    Since launch, my estimate is that Lumia has sold 810k units in the North American market.

    This cannot be seen as a good performance. There are mitigating factors such as the lack of upgradeability to Windows Phone 8 which probably deflated demand[2]. However, it's a poignant observation that during the last quarter the US reached 50% smartphone penetration by users. As traction is still absent from both Nokia and Microsoft in the US market, we are back to the question of how to compete.

    As the market in the US transitions from competition against non-consumption to competition among rival platforms, the Lumia brand is being forced into targeting smartphone "switchers" rather than smartphone "adopters". The switching option is expensive, requiring aggressive advertising (see Samsung Electronics' $11 billion ad budget).

    There's only one source of cash for that sort of strategy.

    ---

    Notes:

    1. The caveat is that they market some of the Series 40 phones are "smartphones" on the basis of having "smartphone-equivalent" performance. However, smartphone equivalency is and has been purely subjective. On that basis there were many times in the last decade and a half that we could have counted Java-based or BREW-based or i-Mode-based phones "smartphone-like". Smartphone has been defined on the basis of running an operating system with native APIs for developers.
    2. I imagine that the upgrade path could have been known to Nokia, AT&T and Microsoft nine months ago when the Lumia was unveiled for the US by the three CEOs and therefore expectations could have been modulated accordingly.
  11. Android's contribution to Google

    Research · 42 comments

    Yesterday I presented the estimated Android income statement vis-à-vis Apple's income statement. In this post I'll compare Android as a part of Google's overall business.

    Recall that Google has already been compared in terms of overall revenue, growth and profitability to Apple and Microsoft here.  The argument can be made that mobility has not yet had a measurable impact on Google (certainly not noteworthy enough to be reported by management).

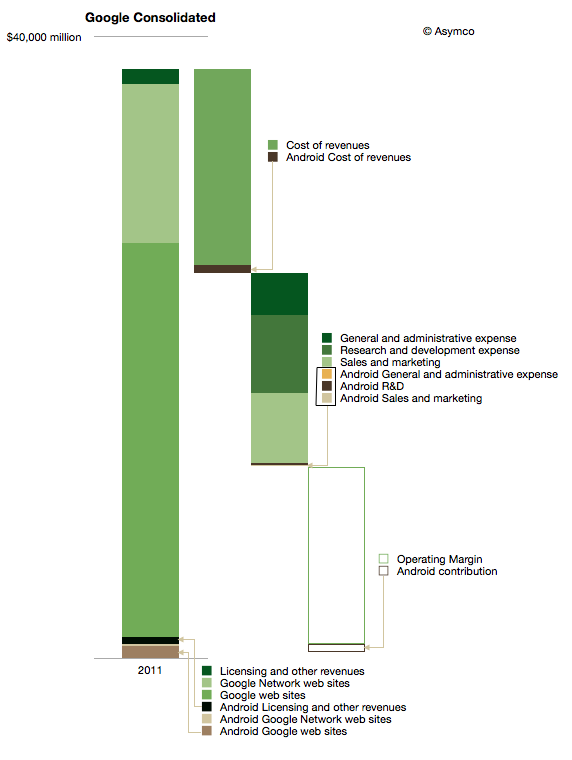
    The impact on Google of Android can be shown in the following diagram:

    I used color coding to identify non-Android (Green) and Android (Brown) segments of the business. Overall, Android could amount to about 3.5% of total Google revenues and about 5% of operating earnings.

    It's important to note that this is not all the revenue that Google obtains from mobility. This diagram represents Android only and there are revenues also coming from alternative platforms and operator deals.

    iOS contributes between 3 and 5 times more ad revenue to Google than Android.[1] The contribution to earnings is even more difficult to assess. We don't know the terms between Google and Apple for search revenue sharing and placement. One analyst suggests that the cost of sales (TAC) for mobile Safari search could be as high as 60%, far above what Android traffic costs.

    The other observation is that Android cost structure is quite small (see third bar from the left above.) My estimate is that Android R&D is only about 3% of total Google R&D. I'm projecting $200 million for 2012. That implies between 700 and 900 headcount. It's interesting to compare that total to the 20,000 or more that came with the Motorola acquisition.

    Having these estimates allows one to calculate many ratios and potential valuations. I'll refrain from putting a value on Android using multiples or sales or earnings, but would come out well below what was paid for Motorola's $12.5 billion.

    Which again compels one to ask what is the strategy at work here.

    ---

    Notes:

    1. There are various reports of the ratio including congressional testimony and reports to courts. BlackBerry, Docomo and KDDI were listed as significant other sources of ad revenue by Google in 2010.