There is finally enough information to try to give an estimate of the smartphone market as a subset of the overall phone market.
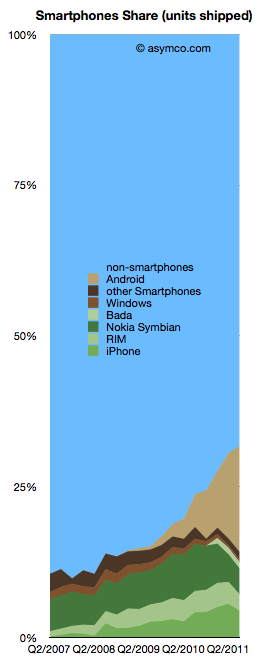
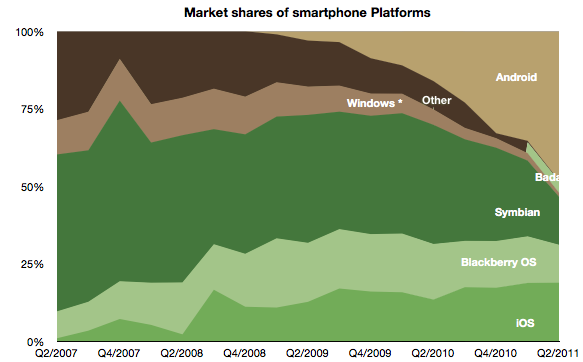
The chart to the left shows the overall picture.
To sum up: The smartphone market has now reached over 30% of shipments. Non-smart devices are at 69% of total. The individual phone platform shares are as follows:
Android (and Android-like): 17.6%
iOS (iPhone only) 4.4%
Nokia Symbian: 4.3%
BlackBerry: 2.76%
Bada: 1%
Windows Phone 0.5%
The past quarter was the first where there is evidence of significant non-seasonal decline in incumbent platforms. Both RIM and Symbian saw two sequential drops in volume. The iPhone had a seasonal (or, more accurately, transitional) decline. Windows Phone had a very modest increase in share from 1.3% to 1.7% share though this is well below a margin of error in the estimate.
Android (and Android-like) shipments ballooned to nearly 70 million but sell-through could be about 10 million less. Nearly one in five phones sold is now powered by an Android variant. A remarkable story since the share was zero less than three years ago
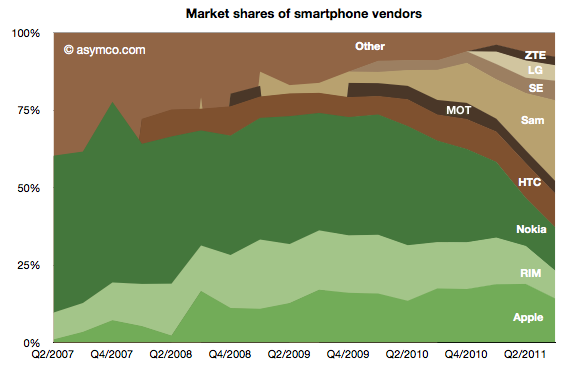
Of the vendors involved, here is the division of share:
Samsung achieved 26% share, nearly swapping share with Nokia over a single year. Nokia reached below 14% while Apple maintained above 14% but down from 19% the quarter prior. HTC overtook RIM with 11% vs. 9%. Sony Ericsson is around 6% and Motorola probably slipped below LG with 4% vs perhaps 5% respectively.
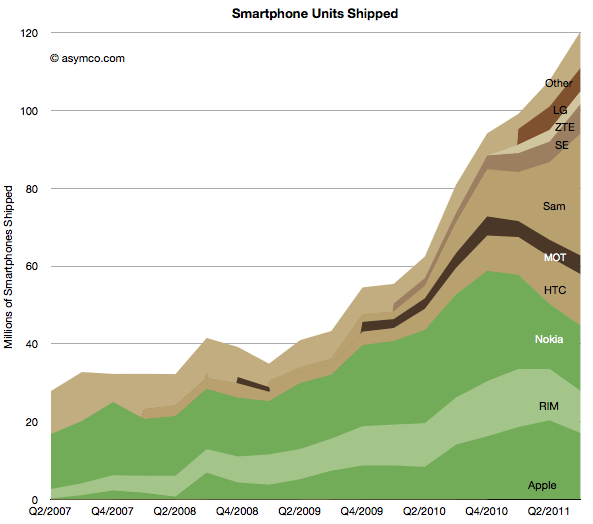
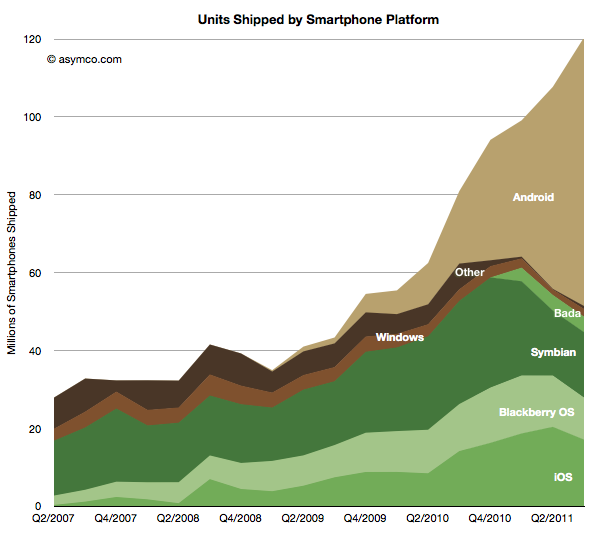
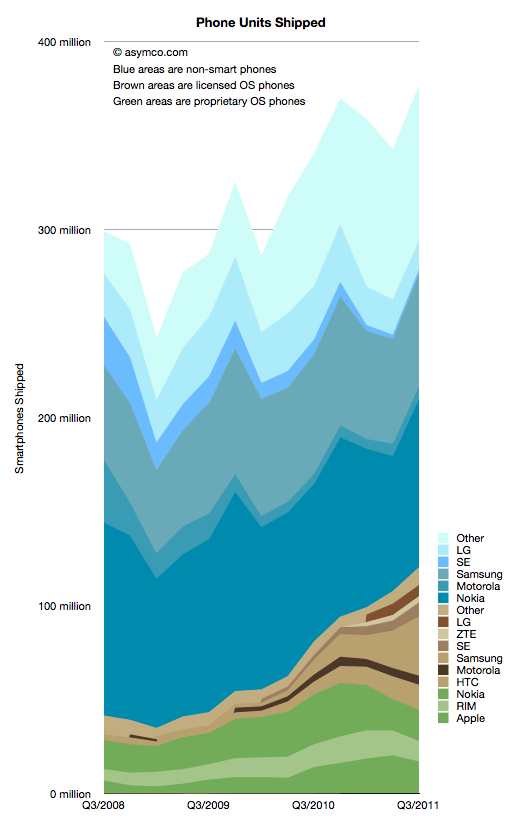
The absolute performance of shipments by vendor and platform follows:
I maintained the historic distinction between integrated (green) and modular (brown) OS strategies to show how the value chain evolved. As Nokia swaps its share to a licensed Windows Phone the share held by integrated vendors is likely to shrink even further.
Does this mean it's the end of integration? Or even more importantly, as I have previously suggested the link, is this the end of innovation in the mobile phone market?
It would appear that with 30% smartphone share, the vast majority of phone vendors are ready to abandon any ambition to obtaining extraordinary profits from mobile devices.[1] Apart from Apple, there seems to be complete capitulation to being manipulated by platform orchestrators with unpredictable or opaque intentions.
The thesis of perpetual innovation rules this out. While new input methods offer a clue that visual interaction and the platforms that depend on it are not permanent, the fact remains that cloud computing and the coupling of additional intelligence that comes with it will enable new points of integration and the positioning of these points on new jobs to be done.
Stay tuned as we discuss the future of mobile computing. The best is yet to come.
Notes:
By extraordinary I mean margins above what a component assembler and distributor would be able to obtain--see the PC industry.
On October 27th, Nintendo published half year results for the fiscal year ending in March 2012. Management stated that the company lost over $900 million with a negative outlook. Nintendo cited weaker than expected sales of Nintendo DS hardware and 3DS software and Yen appreciation as the main reasons for the miss. Is this the end of Nintendo?
Before we look more closely, here is a quick summary: The company is exclusively involved in selling game hardware and software. Their console platform is the Nintendo Wii, which will be followed by the Wii U late in 2012. The Nintendo DS and Nintendo 3DS are the company’s portable game consoles. The Wii and the DS are nearing the end of their product cycles. On the software side, the company is known for gaming titles such as Super Mario and Zelda. Nintendo also pioneered the licensing model to allow third-party developers to produce games for its hardware products.
A closer look
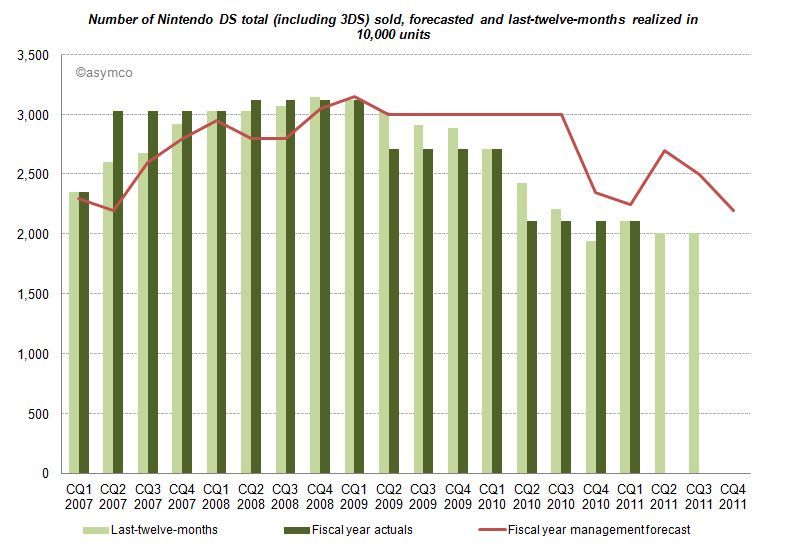
The good news for analysts is that Nintendo publishes their estimates for hardware and software unit sales. This allows us to measure management predictive accuracy. The red line (management forecast) should be as close as possible to the dark green pillars (realized unit sales in the fiscal year).
Until CQ1 2009 devices sales grew in excess of forecasts. A similar pattern can be found for consoles and game titles. After Q1 2009 forecasts have been always higher than results, and more worryingly, the deviation between forecast and sales is widening. Management missed and lowered forecasts for two consecutive years. Management's hope for an increase on the back of initial 3DS sales in the launch quarter (CQ1 2011) did not come to pass and they subsequently lowered forecasts again in the following two quarters.
Looking at all categories, management lowered forecasts almost continuously. The deviation remains the largest in the portable hardware business segment indicating that management was largely surprised about the development.
What caused this reversal of fortune?
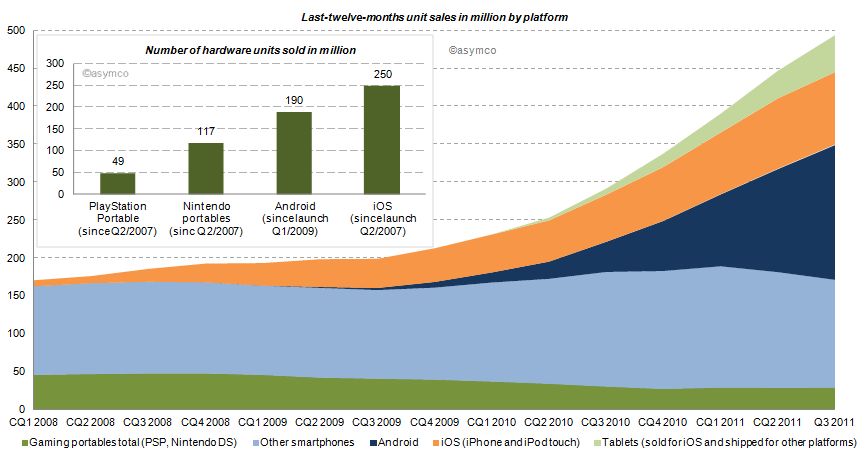
Two years earlier the iPhone had launched and by CQ1 2009 iOS reached an installed base of about 38 million, half the number of Nintendo portables in the same period. Furthermore, in CQ1 2009 Android phones came to the market. Smartphones (light blue area of the chart below) sold before (and after) the debut of iOS, but the iPhone redefined the category and an avalanche of smarter phones running iOS and Android followed (blue and orange area). Portable gaming devices from Nintendo and Sony declined ever since: 17% in 2009, 31% in 2010 and already 16% in the last twelve months.
How do the game players stack up?
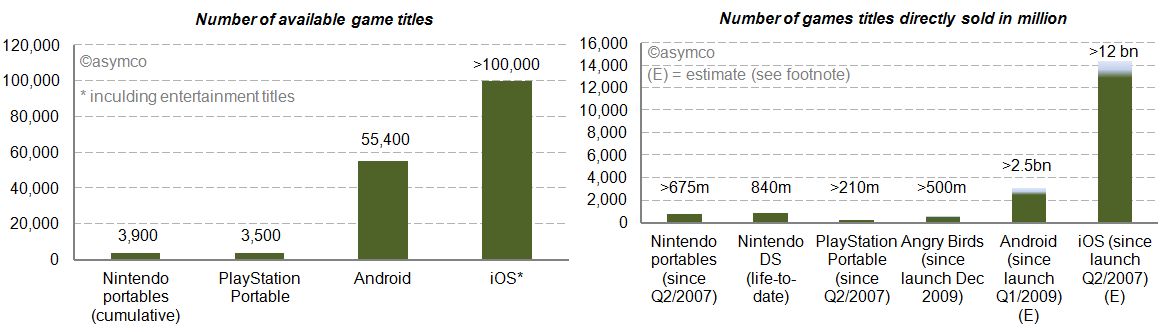
We already looked at the installed base in the chart above. iOS and Android have outsold Nintendo portable units by a factor of 2.1x and 1.6x. Furthermore, we can see (in the charts below) that the two main mobile platforms have 14 to 26 times more game (and entertainment) titles available. Nintendo and Sony also publish unit sales of directly sold software titles. For Android and iOS we know the cumulative app download statistics. By taking the share of Septembers’ paid and free app downloads as a proxy, we can conclude that also by this measure Android and iOS dwarf Nintendo and Sony [1]. The reach of iOS and Android is further underlined by the more than 500 million downloads of Angry Bird game titles - first released only two years ago - for any platform having sold more than twice the amount of Sony’s cumulative portable game titles and almost as many as Nintendo’s cumulative games titles since Q2/2007.
Who else has skin in the game?
Besides Nintendo, Sony, Apple and Google, who else is making a push into mobile gaming? Before investigating, let’s first have a closer look at Sony. Sony, just like Nintendo, is also active in stationary gaming segment with the PlayStation franchise. The Sony group also has access to entertainment most notable through Sony Pictures Entertainment and Sony Music Entertainment. Furthermore, Sony recently decided to buy Ericsson’s stake in the mobile phone joint-venture Sony Ericsson and is making a push with Android to bring its gaming titles as a differentiator for its own products to the platform. And the other major suspects? Microsoft, also active in the stationary gaming segment with its Xbox franchise, is pushing to bring the Xbox experience to mobile phones with Windows Phone. Amazon has retailed software and games for years and has started to distribute software and games via direct download on its own Kindle devices but also for the Mac. On the Kindle, Amazon is relying on a forked Android version on which it leverages its eBook and other entertainment assets. And then there is Facebook, a social network that wants to be on any platform or device. Out of 800 million users, 350 million access Facebook via a mobile device. Around 50% of Facebook members play games on the desktop. With Project Spartan, Facebook is aiming to bring the desktop experience to the mobile device including a stronger focus on gaming and video.
The competition between Apple and Google is already asymmetrical. Including the other contestants in the competitive landscape reveals Nintendo’s key weaknesses in the portable gaming market: attraction as a platform for developers in terms of ease and reach, pricing of hardware competing with operator-subsidized mobile phones and the jobs-to-be-done or value preposition. The new generation of mobile devices is standing against Nintendo’s dedicated approach. Although slowly adding features such as a browser and “app store” to its portables, Nintendo devices fall short in the variety of jobs-to-be-done compared to smartphones, let alone making a call.
Average selling prices and financial impact
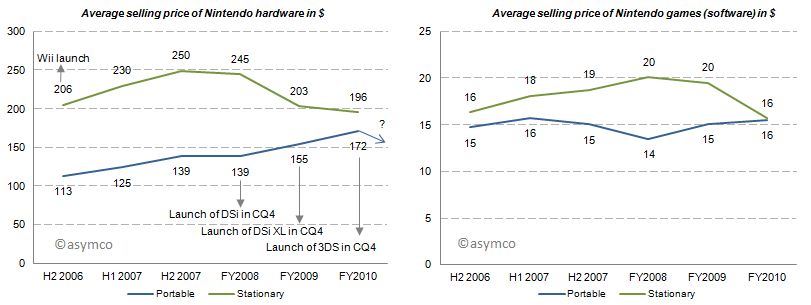
With this market pressure one would imagine that average selling prices decreased for Nintendo portables. But for the last three fiscal years average selling prices for portables have increased, all things equal, mainly due to new product launches. Game title’s average selling prices have remained relatively flat. Note that these are wholesales prices for hardware and a mix of retail and wholesale prices for games. In 2011, for which we do not have data yet, the price of the newest portable, Nintendo 3DS, was lowered from its U.S. debut of 320 250$ in February to 170$ in July which will have a negative impact on ASP going forward.
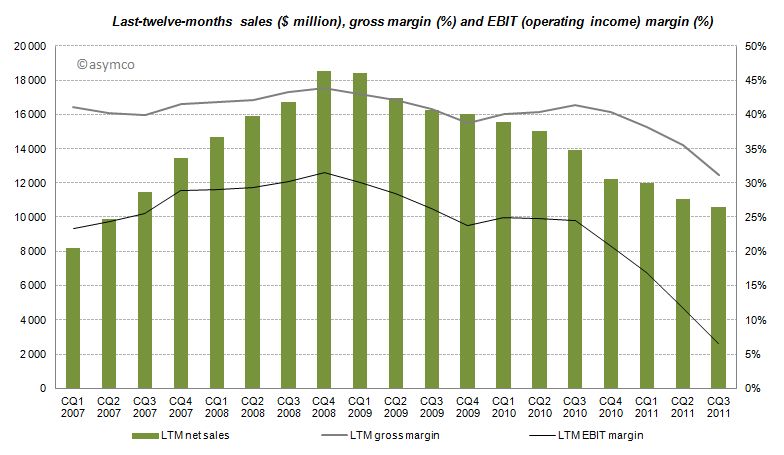
The effects of Nintendo’s rigid strategy and the fast changing competitive landscape are manifested in the devastating financial performance over the recent quarters with LTM sales, gross margins and EBIT margins declining starting from CQ4 2008 and even accelerating to decline after CQ3 2010.
Furthermore, even though the company has recognized its own difficulties, Nintendo has no intention of adjusting its strategy:
CEO Iwata on the question of whether Nintendo plans to bring its game library to other platforms:
This is absolutely not under consideration. If we did this, Nintendo would cease to be Nintendo. Having a hardware development team in-house is a major strength. It’s the duty of management to make use of those strengths. It’s probably the correct decision in the sense that the moment we started to release games on smartphones we’d make profits. However, I believe my responsibility is not to short term profits, but to Nintendo’s mid and long term competitive strength.
Although realized and obvious, the disruption’s invisibility is often manifested in the paralysis of the incumbent.
Conclusion
According to Isaacson, Steve Jobs apparently always worried who could eat Apple's lunch. The lunch of the iPod, he concluded, was ripe for mobile phones. Subsequently, Apple entered the mobile phone space. Google followed. Since then more powerful mobile phones have eaten the lunch of the dedicated gaming device. The jobs-to-be-done and their priorities in people’s life have not changed, but the tools people use to get them done have. Permanently.
---
Notes:
Estimated by multiplying total cumulative app downloads with September’s share of game downloads: For iOS ranging from 72-80% based on Top 150 free and paid app downloads, for Android ranging from 38-47% respectively. This is a very crude estimation, but the gist of it is that 4% for iOS and 11% for Android game downloads as percentage of cumulative app downloads would outsell Nintendo.
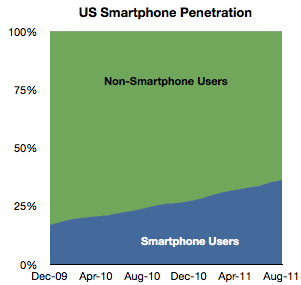
comScore published the latest data regarding US smartphone installed base. To summarize:
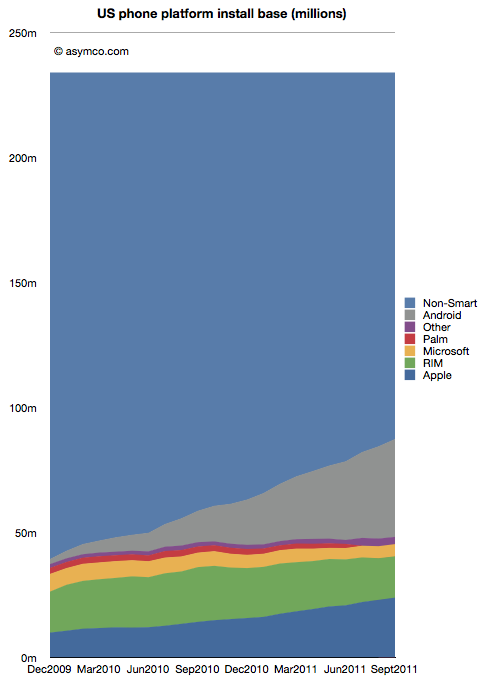
Penetration reached 37.4%, an increase of 2.9 million or 1.24 points of percentage.
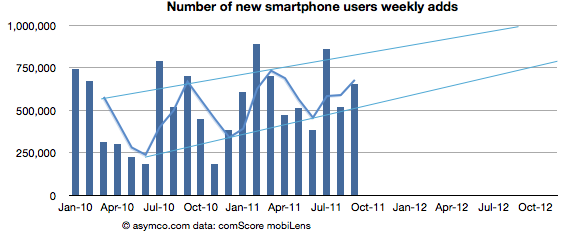
Approximately 650k consumers switched from non-smart to smartphones every week during September
Based on trailing average of six months' growth, 50% penetration will be reached by end of September 2012, though the trend is for accelerated adoption (see chart below).
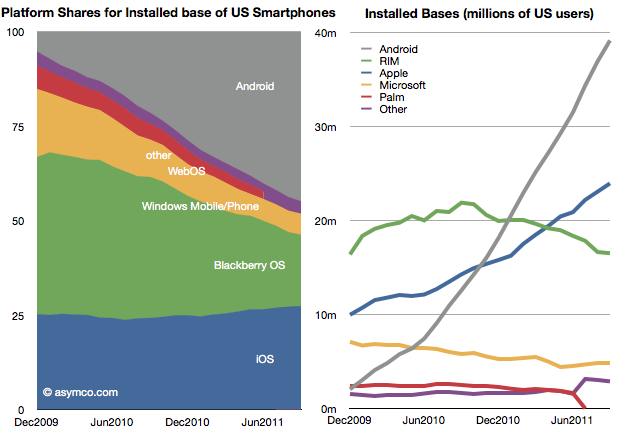
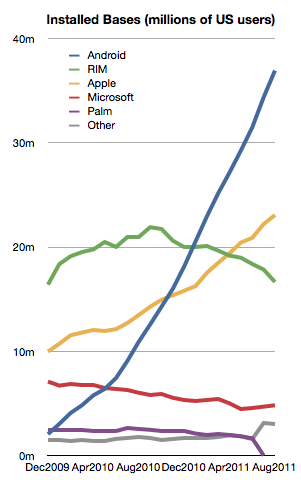
Of the platforms available, Android reached 39 million users, RIM 16.5 million, Apple 24 million and Microsoft about 5 million. Smartphone non-consumers dropped to 147 million. Among platforms, here are the shares and total users:
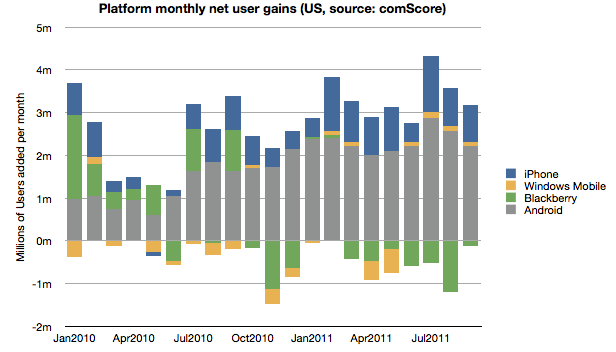
In terms of user gain/loss here is the tally:
Android and iOS have continued to increase consumption fairly consistently while RIM has moderated user losses. Microsoft has also shown the fourth consecutive month of usage increase having increased users by 440k since May. The new Windows Phones seem to have at least stopped erosion of user base though that base is still nearly a third of RIM's.
Overall, smartphone non-consumption continues to be the largest competitor though one which is steadily losing.
Even though China may overtake it in the new few months, the US is the largest smartphone market and it's a good leading indicator of the way the industry in evolving. It's also being measured by multiple observers[1] and we thus have a better chance at understanding the rate at which change is happening.
---
Note:
Nielsen reports that 43% of the phones in use in the US now are smartphones in the US with Ages 25 to 34 having 62% penetration.
I collected all the data available so far and created a new graph that illustrates the complete market evolution over a three year period.
I chose a particular color scheme where shades of blue represent non-smart devices (think blue ocean), shades of brown are smartphones with licensed operating systems (Android for the time frame above) and shades of green as proprietary operating system smartphones. Multiple vendors are shown and those which sell both smart- and non-smart phones are shown twice. Note that the legend shows the vendors in the same order as the stacked areas.
There are several observations that are easy to make from this type of view:
The smartphone market is growing rapidly, not surprisingly. However, the overall market is also growing. Smartphones as a percent of total units sold is at around 31%, up from 14% in Q3 2008. Smartphone units however have tripled in the same time frame (from 40 million to about 120 million). This means that almost all of the market's growth has been smartphones with non-smart units barely increasing from 258 million to 272 million over a three year span.
Non-smart phones are far more seasonal than smartphones. As smartphones increase in share, seasonality should match that of the other phone types.
The number of branded smartphone vendors has increased significantly with "others" becoming a small part of the total. In contrast, the opposite effect is taking place in the non-smart market. Non-smart phone shipments have concentrated in two main brands and a large set of "others". This bi-polar industry structure points to where the value is migrating and hence where rivalry is increasing. We can use these shifts as indicators of industry maturity.
The opportunity for smartphone growth remains in the 70% un-penetrated blue area. However there is evidence that smartphone "switchers" are increasing with a noticeable decline in Nokia/Symbian and RIM. Apple's decline in Q3 is likely to be reversed in Q4 but Apple's share of all phones remains under 5%-- a five-fold increase in share from 2008 but a sign of how much is left to be done.
As Nokia shifts its Symbian portfolio to a licensed Windows Phone model the licensed cohort will tip over into an "all but two are licensees" line-up. This should be particularly worrisome as value is shifting to software and services and "super-platforms". But before the disruption is complete, there are still some cards to play. Samsung and Nokia have vast non-smart volumes to convert and it's unclear if they will do it with Android and Windows vs. layering their own proprietary Bada and future Nokia Linux platforms.
In the next few weeks I'll publish details of all the measures of the market but this first "landscape" view gives a good initial perspective. In the mean-time the data is accessible from the Asymco "cloud" here.
Analysts have to count things in order to measure value. It sounds easy but it can be tricky. As I pointed out with PCs vs. iPads, if you count an iPad as a PC you can get into a lot of trouble with your clients. But if you don't you end up directing them away from confronting an existential threat. Only very rarely is a market report published in contradiction to widely held sustaining beliefs. More often than not analysts bow to the source of their paychecks and in so doing show their rear end to the truth.
This comes up again now with respect to how to count tablets. Consider that there is little difference in architecture, software or design between an iPhone and an iPad. They run the same OS, use the same microprocessors and have similar communication methods, inputs and sensors. However they are considered completely different products and counted as part of separate markets. The only physical attribute that differs is the screen size. So we have to conclude that the size of the screen is a huge determinant factor in deciding whether a product is a tablet but not a smartphone (or music player).
But what about tablets themselves? Their screen sizes vary widely. A 10" screen is certainly a tablet device, but a 4" screen certainly isn't. Where is the boundary exactly? It seems that a 7" device is still a tablet but a 5" may not be. The Dell Streak 5 device is presumably not a tablet. The arguments then descend into an arbitrary definition of tablet based on whether it fits in one hand or in a bag of a certain size.
This begins to sound academic. Why should it matter what size is or isn't a valid tablet? Buyers are not in the market for screen sizes. They are in the market for products that can be hired to do jobs or address pain in their lives. So as far as consumers are concerned, these categories are meaningless. If you want to design something you'd better segment according to jobs to be done.
However, buyers are not the target audience for the analyst. Nor are product designers (hopefully anyway.) Part of the reasoning of offering market research is that it presumably helps ecosystem participants (vendors, developers, retailers, etc.) decide where to invest their time and money. They are the target audience. They don't spend their lives reading tech blogs. For them it's important to understand "which way the wind is blowing" and that's where an analyst should be helpful with data.
But then if we are to measure ecosystems, we have more difficulties.
The iOS ecosystem is pretty well understood. Apple publishes the number of devices it sells and the number of apps on its store and downloads, etc. We can assume Microsoft will do the same with Windows 8 as they do already for Windows in general.
For Android, it's a challenge. Google measures activations, but that may not cover the actual units sold. Google admits that it does not know how many Android devices are sold or even how many are for sale. It's in the nature of open source that it's not controlled and hence not measurable.
But analysts still try. Consider the estimate that about 27% of all "tablets" shipped are Android. That's not something Google helped with. Google can report the number of activations of a certain version of the OS, but they themselves don't know what the device looks like or what size screen it has. A device vendor can put any version of Android on a device of any size. To find out how many tablets run Android, you need to try to estimate "bottom up" by adding the output from various vendors.
However, it's clear that a large number of these devices are not exactly Android. Consider what Kevin C. Tofel writes for GigaOm:
I asked Strategy Analytics to clarify both of those points and received the following email response from Neil Mawston, the analyst who wrote the report: ”Yes, the press release refers to shipments, not sales. All sub-versions of Android are included. Yes, the B&N Nook Color tablet is included in the tablet figures.”
So the B&N Nook is counted as an Android tablet and part of the 27% share of Android. But Google itself does not count the B&N Nook as an Android tablet. It's not something that can even use the Android brand. From Google's own documentation:
We define an "Android compatible" device as one that can run any application written by third-party developers using the Android SDK and NDK. We use this as a filter to separate devices that can participate in the Android app ecosystem, and those that cannot. Devices that are properly compatible can seek approval to use the Android trademark. Devices that are not compatible are merely derived from the Android source code and may not use the Android trademark.
In other words, compatibility is a prerequisite to participate in the Android apps ecosystem. Anyone is welcome to use the Android source code, but if the device isn't compatible, it's not considered part of the Android ecosystem.
So to summarize, whereas the Nook is counted as an "Android tablet" it...
cannot be called an Android device without violating the trademark
may or may not compatible with Android Apps
does not include Google Services like Google Maps
cannot license the Android Market client software or brand
is not considered to be a part of the Android ecosystem by Google
All this is also true for the Amazon Kindle Fire and whatever Baidu, Alibaba and other Google competitors will be selling. Furthermore, Google can define compatibility and therefore what "being Android" means arbitrarily and can change that definition at will. It can even withdraw compatibility on the basis of business priorities.
It matters because these devices might end up very popular (see Amazon's reporting of Fire's pre-orders in its quarterly earnings call) and in aggregate could even be the majority of "Android tablets".
The result is that most analysis of the Android ecosystem (and by comparison, all mobile ecosystems) depends on classifying as Android devices those that compete with Google, and indeed, with Android. For the purpose of assessing value, growth and opportunity for third parties such reports fall short.
So what should be done?
The solution is simple: Count as Android devices those that are allowed to be called Android as per Google's own definition. It makes clear that developers can reliably sell their software through the Android Market. It makes clear that those devices are designed to use Google services and it makes clear that those devices are not designed to compete with Google.
Those devices which are using "derived" Android source code and are not compatible (as per Google's definition) and are not allowed to be called Android by their vendor should be called something else. Maybe "Android-like" or "Android derivative" or "Non-Google Android" or just "Other".
Windows Phone is in limbo. The company acknowledged that it has performed below expectations. During the last quarter for which we have data (ending June) I have an estimate that Windows Phone sold only 1.4 million units (Gartner's sell-through analysis suggests 1.7 million). That gives Microsoft a 1.3% share of units sold (Gartner 1.6%), a new low.
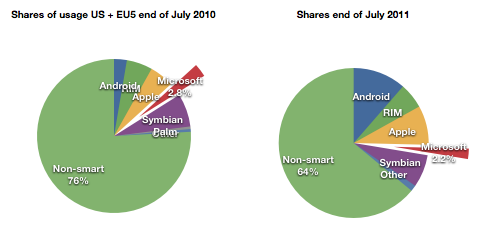
At the same time, comScore data shows that user erosion in the US and EU5 has slowed and is holding at about 2.2% of all users.
For its part Microsoft has lain low during the last few months. It released version 7.5 (Mango) last month to manufacturers. It has a number of Windows Phone SKUs in the market or recently announced (27 with version 7 and eleven with version 7.5)
It also sued Android vendors successfully and obtained royalties from the largest Android licensees Samsung and HTC. Patent royalties from Android are probably going to be higher than license revenues from Windows Phone for quite some time.
Something is missing from this analysis. Clearly Microsoft has a plan. It's always had a plan. The plan is not easily perceived because the market Microsoft addresses itself to is not directly to the consumer--we cannot read the message. Microsoft needs to work through partners. Device vendors and operators mainly. In order to persuade them Microsoft deploys its check book.
Put another way, the plan is that Microsoft intends to buy market share. Before we get into exactly how, we need to understand the most important but least discussed contributor to device sales: channel incentives.
Before a phone is sold it needs to get through a mine field of obstacles: it needs to appeal to operator or distributor priorities; it needs to fill a slot in a portfolio of products for the manufacturer and the channel; it needs to acquire shelf space; it needs to appeal to some end users and, unless it has a blindingly strong brand, it needs to offer incentives to the retailer.
This last piece of the puzzle is something of a mystery. Although not a universal practice, in many cases retail staff are paid commissions directly or indirectly by the device vendor. This relationship between the retailer and the vendor is not transparent. A buyer typically does not know what incentives are attached to a given device. Stories of salespeople steering people to and away from certain devices abound.
Microsoft acknowledges this:
Both Samsung and HTC Corp. have committed to increasing marketing budgets for the phones, said Andy Lees, president of Microsoft’s mobile unit, in an interview. While manufacturers will determine how the money is spent, some of it will probably go toward spurring retail staff to tout Windows Phone models, he said.
Q: It seems like one of the challenges is getting the salesperson in the store to push the phone.
A: Absolutely. I think that's a number of things:
One — they get influenced by how good the product is. The reviewers have influence with that and also their own experience.
The second thing is the alignment with the operator. I think we're already pretty aligned and over the life of this release, we'll get even more aligned.
Even prior to the launch of the Nokia relationship, with the original Windows Phone launch exactly a year ago, Microsoft made clear that it had a budget for promoting Windows Phones ($400 million in fact). In the event, the money seems to not have been spent, or spent sparingly because LG made public its disappointment. The coded language can be interpreted as a snub to Microsoft for withholding promised funds.
Perhaps the funding was withdrawn because by the time the launch was scheduled, the Nokia deal was being negotiated. Perhaps Microsoft felt it better to put more effort behind the re-launch of the platform with Nokia on board. A re-launch which has yet to happen but seems to have already had $127 million allocated to it by Nokia alone.
Microsoft is proud of what it has accomplished with Windows Phone because they were able to update the OS in 11 months and took only about two years to completely rebuild Windows Mobile into Windows Phone.
But the dependence on a complex value network means that products do not reach users quickly enough and when they do the marketing message is weak, even when backed by large budgets. The real problem with Microsoft's approach is that it's neither viral like Android (because it has a price and a contract associated with it) nor is it focused and agile like Apple's. It seems to suffer from the worst aspects of modularity (market lag) without benefiting from the control over the ecosystem and end user experience that differentiates it.
Microsoft will muddle through but the 20% share that it says is "conservative" seems anything but.
The August comScore mobile survey (MobiLens) is out. It measures the penetration or consumption of various mobile products and services in the US over a three month period.
I track the change in this data over time. Here are some highlights:
In August about 520,000 users switched to using smartphones (from non-smart phones) as their primary phone. This is a bit down sequentially from July but about average for the period starting January 2010.
Penetration increased by about 1 % to 36%.
Extrapolating this growth implies 50% penetration by September 2012. However growth is accelerating slightly so that tipping point may come sooner. Separately, T-Mobile reported that 75% of its device sales during this year have been smartphones, so if this is indicative of overall US market, then by next year it may in fact be quite difficult to find any non-smart phones to buy.
Among the smartphones, the different OSs have the following installed bases:
The growth in both Android and iOS has been fairly constant for the last 18 months.
Microsoft seems to be stabilizing at around 6%
But RIM shows an alarming deterioration. The company has lost 4.3 million users in the last year and is now at about the same number of users it had in late 2009. This is in a market that has more than doubled.
With only about 16.5 million US users and an average loss of half a million users per month, unless something drastic happens, RIM could lose its entire US user base by the end of next year.
During the last month alone RIM lost 1.2 million users. Management insists that new devices will boost sales but here we're measuring the erosion in core users, not upgrades. It's much more likely that those 4.3 million who left BlackBerry went to other smartphones. To move from a BlackBerry to a feature phone seems very improbable to me.
That means that BlackBerry's pain is probably iPhone or Android's gain. This sort of switch is often painful and I can only imagine that it's done with some reluctance. All the more remarkable then that RIM could not offer incentives to stay. The BlackBerry brand is fading rapidly and brand value is very hard to re-build.
There's one more thing.
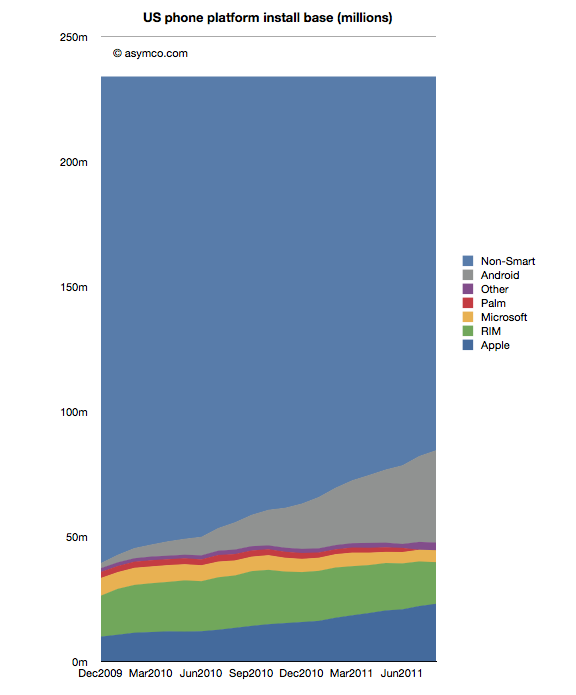
We can see platform rivalry in the installed base chart but the bigger battle is the competition with non-consumption. The following chart shows how overall platforms are faring as they carve up the feature phone market.
There are still 150 million Americans whose primary phone is not a smartphone. The conversion of those users is happening at a consistent pace but there are many years of growth remaining. I've often wondered if and when this pace would moderate. I suggested perhaps at 50% there would be an inflection point as the "easy money" would already have been made.
Much of that will depend on how the product (device + service) will be priced. It's hard to get data on overall pricing. We can get some subsidized phone prices (for example now ranging from $0 to $400 for iPhone and probably similar for Android). What we don't have is an average device+service price point for the industry. That's what I would like to keep an eye on.
I've been asked what will be the effect on the market of the iPhone 4S. Actually the question was what would be the effect on the market of there being no iPhone 5.
I'd answer that the iPhone 4S is a product designed to compete for two markets: (1) half the current iPhone users who bought a phone prior to the iPhone 4 and (2) non-iPhone users, typically non-smartphone users.
I'll describe each market briefly.
The current iPhone users
Tim Cook said that half of all iPhones sold to date have been iPhone 4's. That means that about 70 million iPhone 4's have been sold. Those are not a target market because of three reasons:
The vast majority of those users are still paying for their iPhone 4 through the subsidy model used to sell them and to change phones today would incur a cash penalty.
Customer satisfaction surveys show that they have 90%+ satisfaction rating for their iPhone 4 and we can therefore assume that they are not looking for something better
Their iPhones are practically new and they still work and are upgradeable.
The other 70 million or so iPhone users have either a 3GS or a 3G iPhone. These are a very different market for three reasons:
They have already paid off their iPhones. They would not face any extra costs in switching to a new iPhone
Earlier customer satisfaction surveys showed that they once had 90%+ satisfaction with their product so they are likely to stay with the brand.
Their iPhones are getting old and beaten up after two years of use.
The current non-iPhone non-smartphone users
This market is so vast that it's practically infinite. Over 1.5 billion phones are sold each year and Apple only has about 5% share. Therefore there is a vast pool of users who probably have been interested in getting an iPhone. These potential buyers will find the iPhone 4S an attractive alternative to buying a non-smart phone. They will also notice that there is now a range of price points for various iPhone models starting as low as zero.
Current non-iPhone smartphone users
I'll add this market to complete the picture. This market is similar to the current iPhone 4 market because, except for Blackberry, most smartphones have been purchased in the last 12 months. This is especially true for Android phones. These owners of smartphones are unlikely to be interested in switching a phone that is "brand new" unless they have a very poor satisfaction with it. If they are not satisfied, there are many options, and iPhone is one of them. There are too many conditionals in this market and I therefore don't think it's a good target for the iPhone 4S.
So What are the prospects for the iPhone 4S (and other iPhones)?
The market for the new iPhones could then be summarized as follows: 70 million early generation iPhone users who are eager to upgrade (with 90% probability) plus a subset of a billion buyers of new phones next year who are looking for their first smartphone. These two markets iPhone 4S is targeting are "easy" because the competition is weak. It's either "don't upgrade my old iPhone" or "buy a dumb phone or another smartphone for almost the same price as an iPhone".
I don't see the result for units sold being different if there was a hypothetical iPhone 5 vs. the current iPhone 4S (and 4 and 3GS as a portfolio). In fact, a "better" iPhone would not be better at winning this competitive battle because the bar is so low.
So to answer the question in the headline: because an iPhone 5 is not needed meaning that it would over-serve the market and price itself out of contention.
The question will be very different a year from now when most early Android buyers will be looking for a new phone and when most iPhone 4 users (all 70 million of them) will be looking for a new iPhone. That would seem like a good time to introduce a new iPhone "5".
[Updated with new charts including data from StatCounter and not NetMarketshare]
Generally speaking there is an equivalence drawn between iOS and Android as technologies and even as user experiences. However, as I've pointed out on several occasions there is a very clear nonequivalence in business models and thus the "fuel" which keeps each platform running. But does this difference in models lead to some difference in the way the products are "hired" to do what they do. Does it imply anything about how the products are likely to evolve?
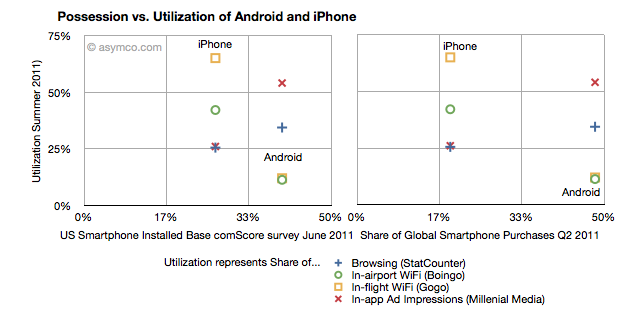
I collected into one place all the data I could find about utilization (how much of a service and how often it's used) and possession (both in terms of current ownership and new acquisitions) of iOS and Android.
Possession data comes from comScore survey data of share of US installed base of smartphones by platform at the end of June 2011 (first chart) and share of Global Smartphone Purchases as of Q2 2011 sourced from company reports and IDC (second chart).
Utilization data (vertical axes) comes from August 2011 shares of mobile browsers (from StatCounter June 2011), in-airport WiFi associations from Boingo in June 2011 (iPhone vs. Android), in-flight Wifi associations from Gogo in June 2011, and In-app Ad impressions from Millenial Media also in June.
The charts are divided into nine sections corresponding roughly to "low", "medium" and "high" utilization vs. possession.
The first chart compares a US-only population for possession vs. a mixture of global and US-only populations for utilization. The second chart compares a global population to the mix of US and global metrics.
What I found interesting is that if we take ad impressions (red X) and browsing (blue +) data out, the two platforms are indeed quite distinct. iPhone has a medium level of possession with a high level of utilization of data services while Android has a high level of possession with a low level of utilization. The data is also nicely clustered.
If we take just the ad impression or browser data then the platforms are quite similar: medium utilization for medium possession and high utilization for high possession. If the two platforms were to swap places in possession (i.e. market share) then they would probably also swap places in utilization (i.e. impressions).
What the data seems to suggest therefore is that for data services the iPhone is a far more popular tool than Android. But for in-app ad impressions and browsing the products are used in a similar manner.
The big difference is however that the services where iPhone utilization is high are those where users have to pay something. Most (if not all) of the ad impressions in apps are for free apps. So ad consumption scales with possession. But non-free services don't. This data seems to support the hypothesis that Android users are disproportionately less willing to spend money (note that the data does not say that users don't have money, but simply that they are not spending it). The other data which backs this hypothesis is that paid app sales on Android trail quite far behind the rate of purchase on iPhone. That could be due to payment problems in the Android marketplace but this data shows that there is some other effect as well.
Why is this important?
We can argue that Android is a low end product and that it disrupts and that this is consistent with that positioning. However it also indicates that the value is not in that ecosystem. And ecosystems are what sustain a platform in the long term. This debate will continue but I am reminded of other platforms which had similar patterns.
Both the Blackberry and Symbian had high possession (in terms of share) with very low utilization. There were lots of surveys which showed that browsing, app downloads and "monetization" of services after the sale of the handset were low. Much was written about it being due to poor experiences. But learned observers today insist that the experience on Android is as good as on the iPhone.
So why is there less economic participation from Android users? It's not just about these proxy services, but all manner of activities which enrich an ecosystem. Possession without utilization implies a product that does not do its job. Its features are not being absorbed. Why would that be?
I'm glad Windows 8 is named the way it is. With Windows 7 Microsoft went to a numbering system which is much more rational than the mixed naming of the past. The number 8 actually corresponds to the actual sequential number of major versions of Windows released to date.
Windows proper actually did not start with what was called "Windows 1.0". Windows actually started in April 1992 when Windows 3.1 was released. It was the first Windows which was an operating environment onto itself, apart from DOS. It was followed by Windows 95 (which we can call "2"), Windows 98 ("3"), Windows 2000 ("4"), Windows XP ("5"), Windows Vista ("6"), Windows 7 and now Windows 8.
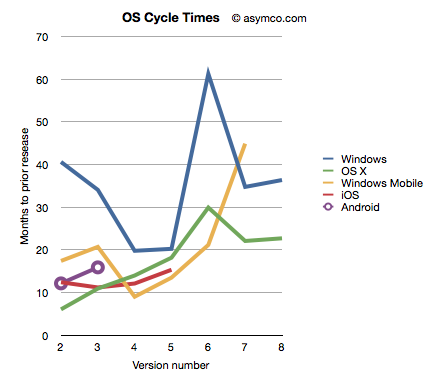
Given this nomenclature and the dates of general availability of said versions, we can derive a measure of the frequency of upgrades. For example Windows "2" followed about 41 months after "1" and "3" took 34 months after "2". If we continue this for all the versions, and assume "8" will launch by October next year, we can plot the cycle times of new Windows versions.
To make the story more interesting I added the same data for other OS platforms. OS X, iOS and Android have version numbers which correspond to the sequential order in which they were released. I am assuming that the numbering system (1.0, 2.0, 3.0 etc.) are meaningful and that major releases are given a new integer value.[1]
I also added Windows Mobile which suffered from the same confused numbering that Windows suffered until the current Windows Phone 7. To create a map to integer values I used the following: Pocket PC 2000 is "1", Pocket PC 2002 is "2", WinMo 2003 is "3", WinMo 2003 SE is "4", WinMo 5 is "5", WinMo 6 is "6" and Windows Phone 7 is "7". There is no clarity when and what Windows Phone 8 will be so that is left off the chart.
The chart above does give a clue that Windows is a bit slower (more months between releases) than alternatives. However, the point I want to convey is that this cycle time can be a strategic advantage. A faster upgrade cycle means more rapid adoption of improvements, not to mention more revenues. Rather than a line chart, the better way to visualize it is as a turning circle.
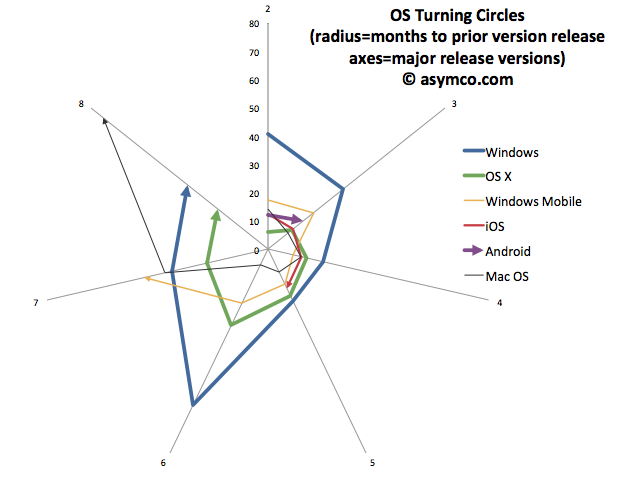
The analogy is from aerial combat where a plane that can "turn inside" an opponent can get into a firing position. The tightness of turning circles also means that a competitor can iterate more quickly and thus move up the trajectory of improvements necessary to remain competitive more rapidly. To that end, I re-plotted the data above with radial axes.
The chart clearly shows how among desktops, OS X has been tighter than Windows[3]. Furthermore, mobile OS's have been, typically, more agile than desktop OS's. The exception being Windows Mobile which had significant architectural and business model challenges. It will be interesting to watch the radius of Android. So far it seems to be tight, but as tablet functionality has been added, the speed of change has slowed slightly.
However, the big contrast is between mobile and desktop. Microsoft tries with Windows 8 to merge the two. But these are different ecosystems. Buyers, OEMs, users, all have different behavioral patterns (jobs-to-be-done) for mobile OS vs. desktop/portables. Will the cycle time for Windows 9 and Windows 10 tighten up? Can Microsoft operate its OS division at this new cycle time?
What is even more bad news is that the most important customers for Microsoft, enterprises, actually upgrade every other version. The Windows "radius" is nominally averaging about 35 months but large account adoption is closer to 60 months.
The contrast is then striking: Consumerized devices with over-the-air updates on a 12 month cycle are five times more agile than a traditional corporate Windows desktop. Another way to look at this is that for every change in a corporate desktop environment, the average user will change their device experience five times. Although Microsoft might find comfort in Enterprises' leisurely pace of change[2], those are the wrong customers to keep happy going forward.
The implications are left as an exercise to the reader, but I would argue that along with the asymmetry in business model around pricing that I highlighted in the last Critical Path podcast, Microsoft has a significant operational asymmetry with devices as a new class of computers.
---
Notes:
The dates of general availability of various versions of operating systems.
Version Windows OS X Windows Mobile iOS Android 1 4/6/92 3/24/01 4/19/00 6/29/07 10/21/08 2 8/24/95 9/25/01 10/1/01 7/11/08 10/26/09 3 6/25/98 8/24/02 6/23/03 6/17/09 2/22/11 4 2/17/00 10/24/03 3/24/04 6/21/10 5 10/25/01 4/29/05 5/9/05 10/1/11 6 11/30/06 10/26/07 2/12/07 7 10/22/09 8/28/09 11/8/10 8 11/1/12 7/20/11
While at Nokia's Enterprise Solutions I was witness to this difference between the cycle time of devices and the pace of adoption of Enterprises. The fundamental disconnect was that the sales cycle for a "solution" was longer than the shelf life of a device upon which that solution was predicated. Needless to say, Nokia Enterprise Solutions did not last long. Nor do we see today any significant Enterprise-focused mobile device businesses (RIM itself moved to consumerize its products years ago.)
I added Mac OS data to the second chart to also illustrate that no company is immune from spinning out of control. Mac OS clearly went spun out after version 6 with increasing delays leading to its demise and replacement. You can also note that its replacement (OS X) was able to straighten-up and fly right. The lesson may be perhaps that ditching and starting over is a viable option.
RIM shipped 10.6 million Blackberries and 200,000 PlayBooks in the last quarter. Management noted that their sell-through was significantly higher for Blackberry (13.7 million) but seems to be very weak for PlayBook as the prior quarter saw 500k units shipped. Additional PlayBook units this quarter probably mostly went into new channels in Asia and there were no additional sales into North America or Europe.
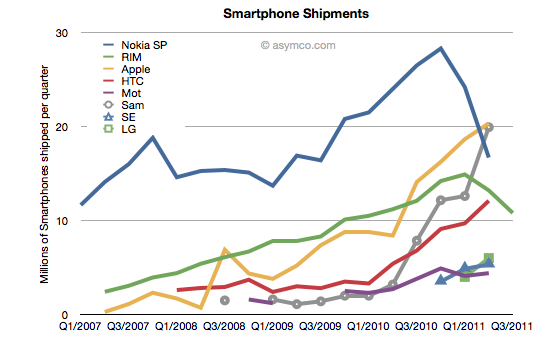
The figures for units are very poor. How poor depends on the frame of reference. Consider the shipment chart below:
In terms of the competition, 10.6 million units is less than half what Apple or Samsung sold in its prior quarter. It's also less than what HTC sold. RIM's volume rank will likely go to fifth place as a smartphone vendor.
In terms of its performance relative to its own history, the Blackberry volume dropped by 11% year-on-year and 18% sequentially. This is the second quarter that shipments shrank.
In terms of market share, we'll have to wait for the competitor data over the next six weeks but the market has been growing at an average of 77% for four quarters so any continuation of this trend would imply RIM's share dropping to single digits.
Finally, the biggest shock has been the decline in profitability. It seems that operating margin dropped from 21% to 13%. The company did incur some one-time charges for recent layoffs, but even without that charge, the margins would be around 16%. This is most alarming. The reason for such drops is that as volumes decrease fixed costs don't decrease as rapidly or at all. The company still needs to keep sales, administration and engineering staff around and they become a larger part of the operating expenses (vs. the component costs which vary with volume of goods sold).
This effect is well understood by financial analysts and the stock price shows it with a huge drop.
But stepping back to look at the picture above, there is a clear turning point in the company. You can see the elbow in the curve for volumes whose effect is felt so deeply. What's curious is why the pivot occurred when it did. We can point the finger to competition as the cause. But why was there no effect in the company's fortunes when the competition actually emerged. It's been years since the iPhone and even Android entered the market. Yet we see an impact on Nokia and RIM individually at apparently arbitrary points of time.
This is the lament of the analyst: you can clearly and accurately state what will happen but when remains a mystery. It's the elasticity between obvious causes and their effects that makes this an inexact science or not a science at all. In retrospect, you can say that Nokia's pivot was triggered by its public execution of Symbian, but that assumes that it was preventable--which we know is not the case. But what caused RIM's change of growth, exactly? Why did it happen this past spring? Why didn't the company volumes begin to decline as iPhone and Android boomed in 2009 or 2010? For quite some time RIM seemed immune to competitive pressure. We all were made fools as we called its imminent demise. Then, as Steve Jobs would say, boom!
---
Footnote:
Piecing together RIM's performance is becoming more difficult each quarter. The data being presented is increasingly obfuscated by irrelevant detail while major information is omitted. This last management presentation was full of holes, namely:
We have no idea of device pricing. Valiant efforts have to be made to piece together that aspect of the business. Matt Richman does a good job but it still requires some guesswork regarding PlayBook pricing to back out Blackberry pricing.
Management detailed where Blackberries were selling-out but only detailed sell-in for the PlayBook. Obvious spin.
They are cherry picking the data they present and each quarter it's a different story making pattern recognition impossible.
This leads to an erosion of trust. Observers are faced with the problem of increasingly guessing what is happening each quarter. For instance, regarding pricing I prefer to include service revenues in the analysis of device sales because device+service is what is being bought by the user and vendors which can offer services as part of the device get a justifiably higher value for the product--value that I think needs to be considered as advantageous. Nokia and Apple also account for services (though not apps) as part of device sales and it makes it more convenient to compare these businesses.
Given RIM's smokescreen, this quarter I decided to stop trying to guess Blackberry pricing and used Operating Income/Units sold as the average selling price.