Asymco

Asymmetric Intelligence

App Store

  1. App Story

    Research · 21 comments

    The App Store is almost 9 years old. In that time it has generated about $100 billion in revenues, of which about $70 billion has been passed on to developers and $30 billion was kept by Apple. It's very likely that running the App Store for 9 years did not cost $30 billion so, if it were an independent "business unit" it would probably have been and still be quite profitable.

    But Apple does not run "business units" with separate Profit and Loss statements. The App Store is a part of Services which is an amalgamation of non-hardware sources of revenues but that does not mean it's a business. The purpose of Services isn't to turn a profit or define its value through some metric of financial performance.

    The purpose of Services is to make the experience for the Apple user better. The combination of good experiences allows Apple to be perceived as a valuable brand and that allows it to obtain consistently above-average profitability through pricing power. I like to emphasize that the iPhone at over $600 in average price is more than twice the average price of all the other smartphones and captures over 90% of all available profits.

    This is something that remains after a decade and indeed the price is rising in the face of overall price erosion, all without a decrease in volumes. The sustainability of this exceptionalism is due to no one single thing. It's due to the persistence across all the things Apple does: product, stores, software and services and many other details too numerous to count.

    The result is a large and expanding base of satisfied customers and a large and expanding base of partners both in hardware and software and services. The WWDC event this year showed how the ecosystem of Apple is booming with over 3 million new developers and Keynote screenfuls of partnerships. All this makes for a complex picture but it's a real picture.

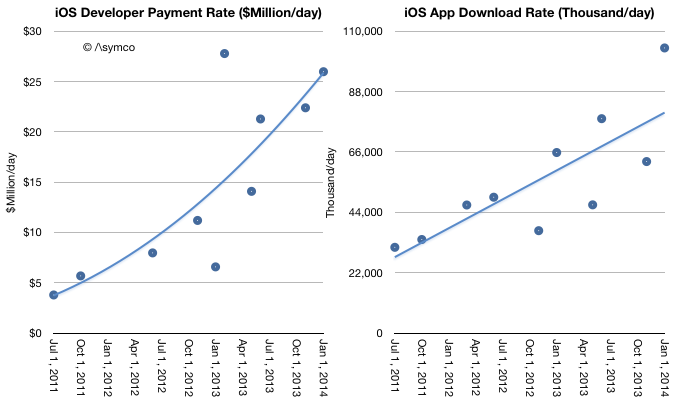
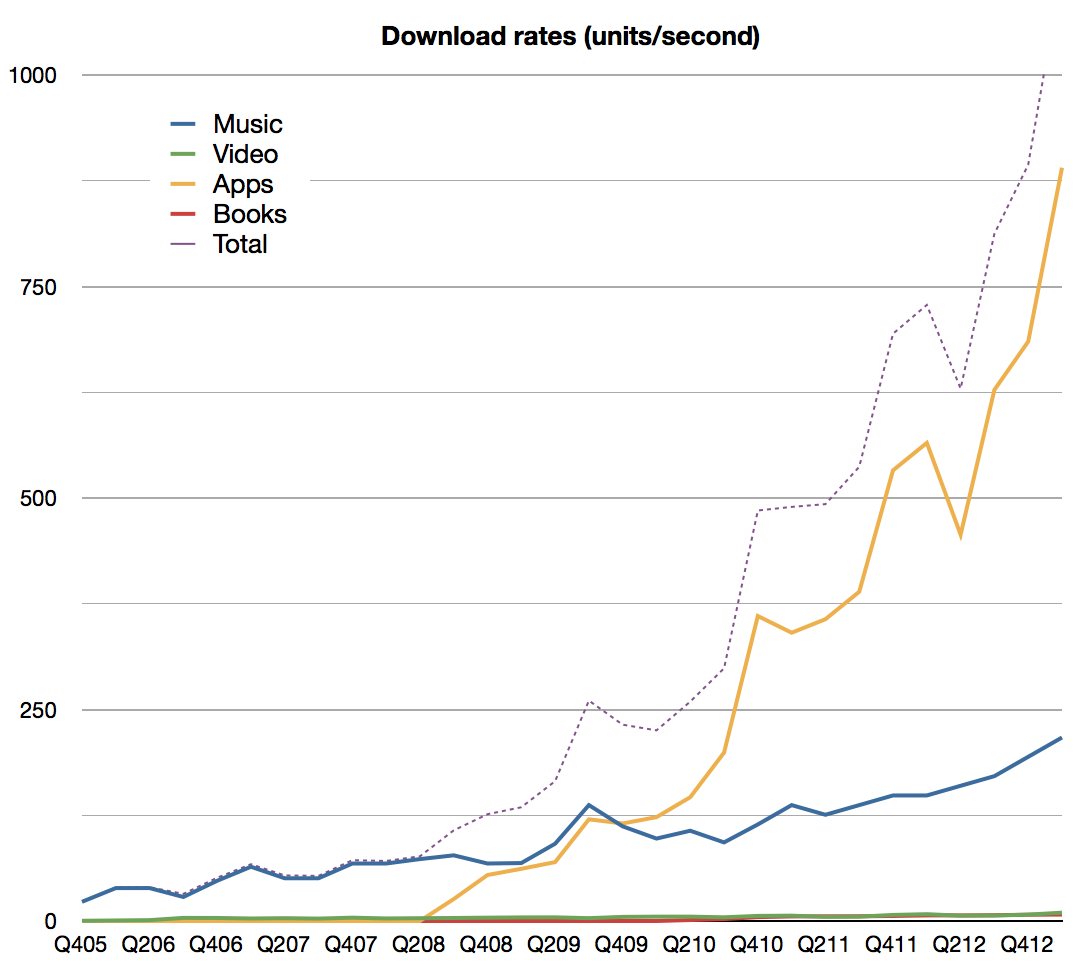
    The latest numbers on Services try to tell this story: 180 billion App downloads from 500 million App store weekly visitors. The download rate is accelerating as shown in the following graph:
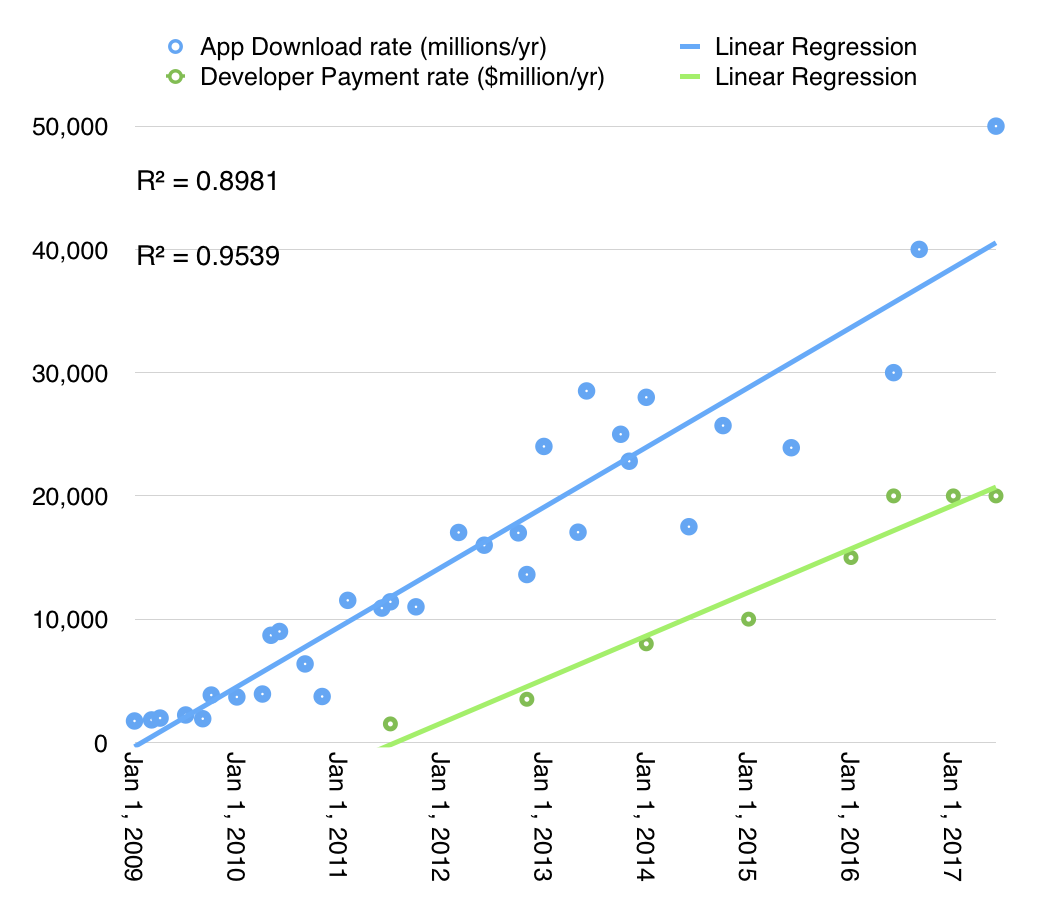
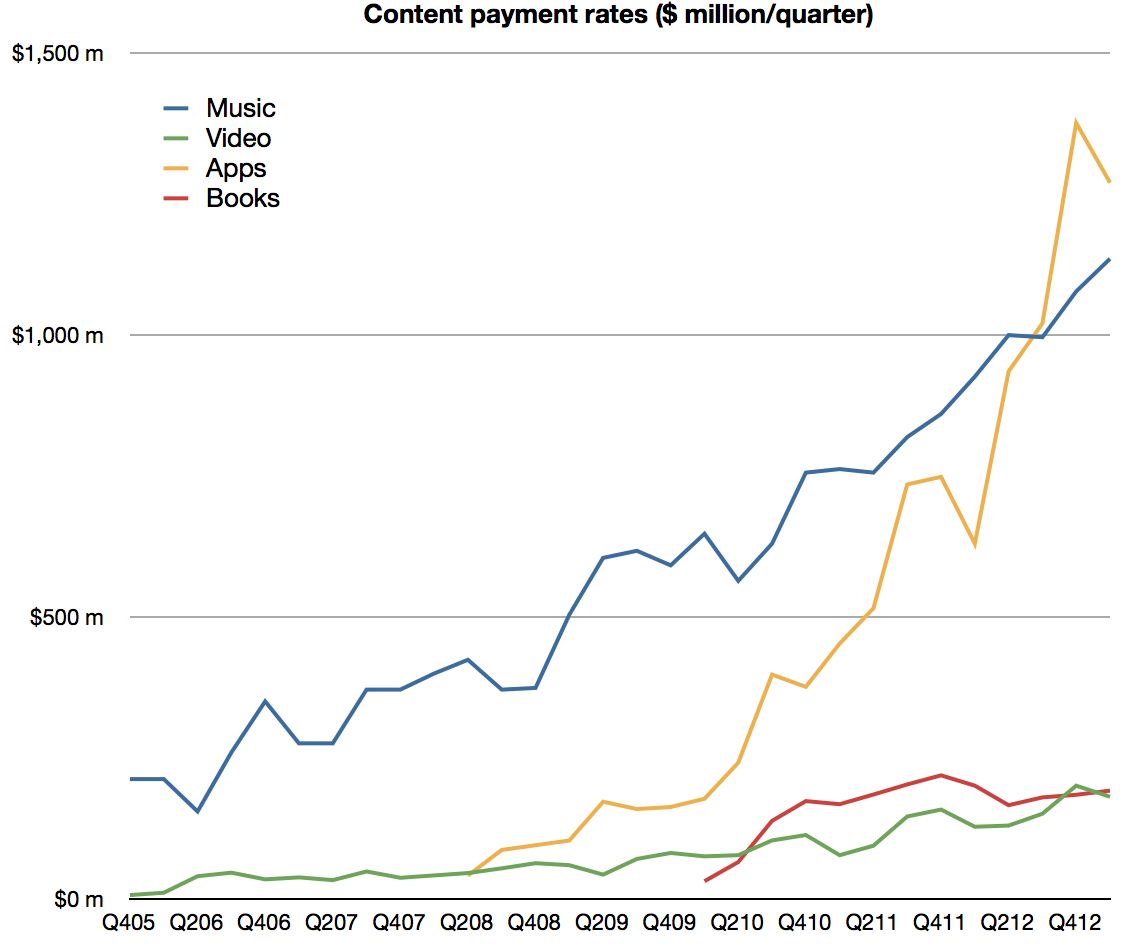
    The revenue or payment rates can also be shown as accelerating though at a different rate. In both cases, the story of apps is not yet over, regardless of commentary to the contrary. Much of this growth comes from new markets like China and as India joins the iOS world, there is yet more opportunity emerging.

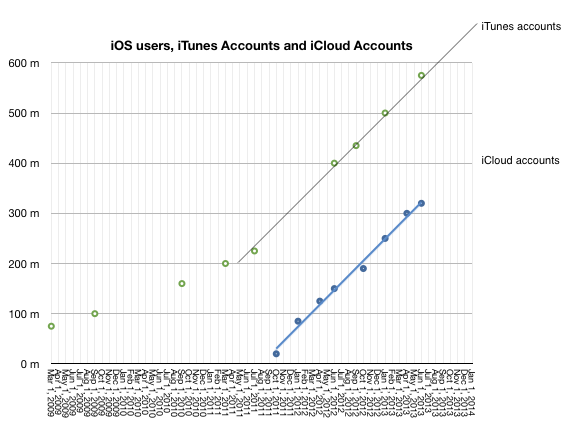
    This enables part of the story of Services which can be tracked with several other metrics: reported revenues, iCloud accounts, active devices, and iTunes accounts are highly correlated.
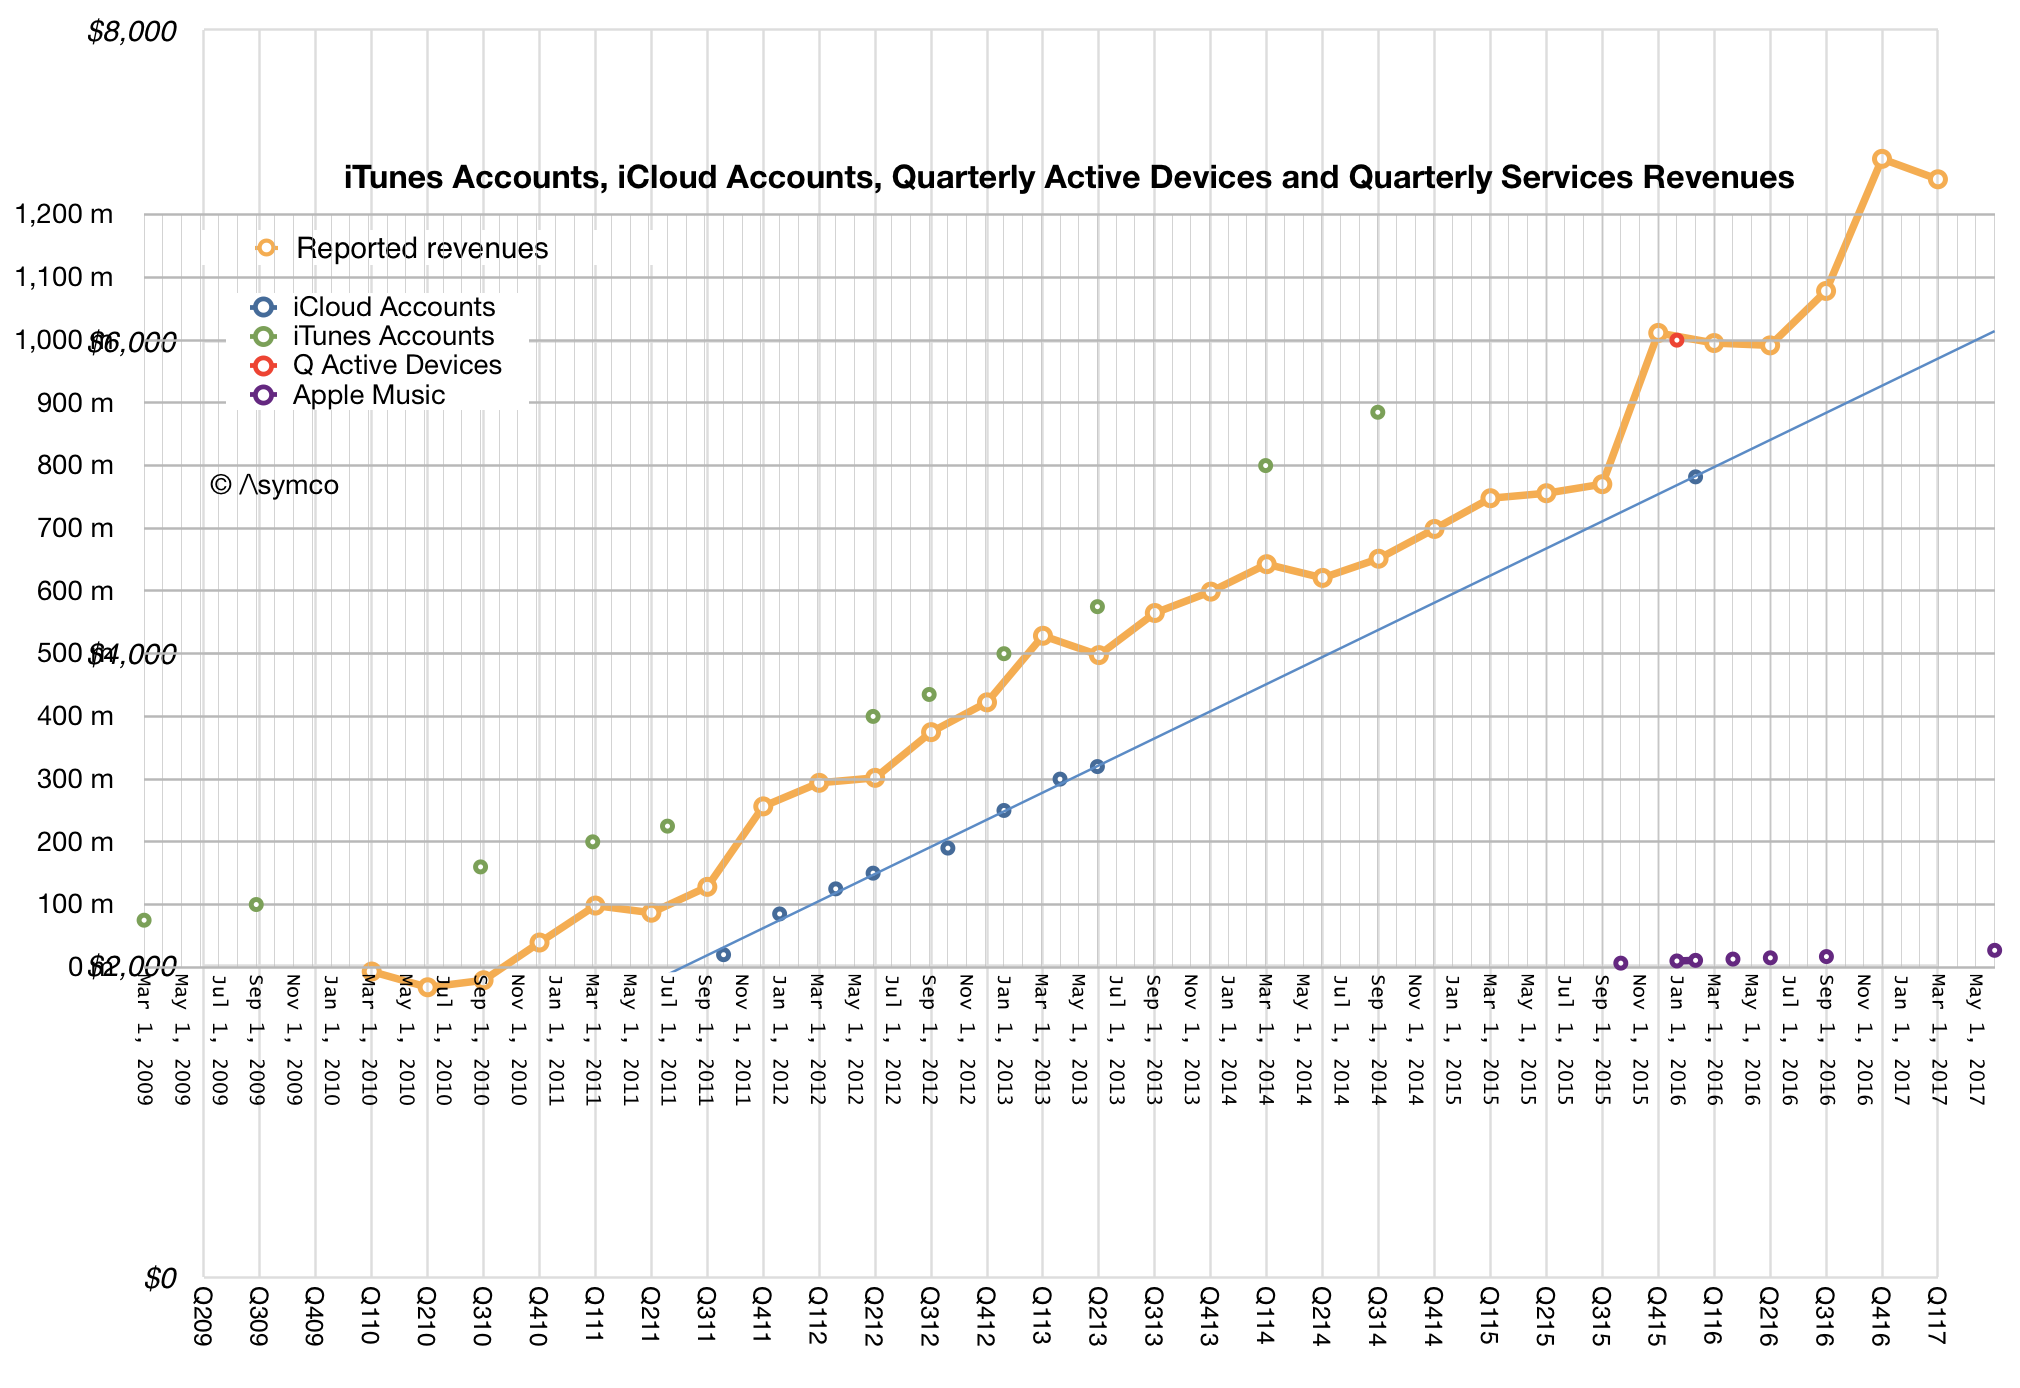
    The patterns after a decade are remarkably consistent. One would have thought that with mobile saturation in advanced markets, the content story would be told through horizontal lines. What we still see is the same slopes we've seen since the earliest days.

    But the biggest story at WWDC was the re-design of the App Store as a curated content market. The changes are profound: discovery, curation and the surfacing of content have been revamped. It's hard to predict the implications of this but one of the indications of direction was the separation of "Games" from "Apps". This is a jarring idea since if all Apps are content, what makes Games different from other Apps? Is this a genre elevated to a new medium?

    I can't yet get a sense of where this is heading, if anywhere, but the remarkable story of Apps is that it's still an ongoing story. We may be on chapter 2 and we can't predict how many chapters remain.

    Keep an eye on Apps and Services and developers. They are not lagging indicators of success for Apple. They are very much leading.
  2. (Much) Bigger than Hollywood

    Research · 47 comments

    Eddy Cue seems like a nice guy. I can't say that for sure as I've never met him, but he seems to be amiable enough. Maybe it's because he has a seat on Ferrari's board of directors. Maybe it's because he enjoys dancing.

    Or maybe it's because he's in charge of the only real "division" at Apple. All the other senior managers have functional roles. Eddy has a bona-fide business unit called Services.

    Services is Apple's division of many things. It has the iTunes stores (Music, Video, Apps and iBooks). It has Software with consumer bundles like iWork and iLife and Pro tools like Aperture, Final Cut Pro and Logic Pro. It still has OS X as a product, though revenues are pretty low as updates are now free. It also includes Services with iCloud, Apple Music and Applecare.

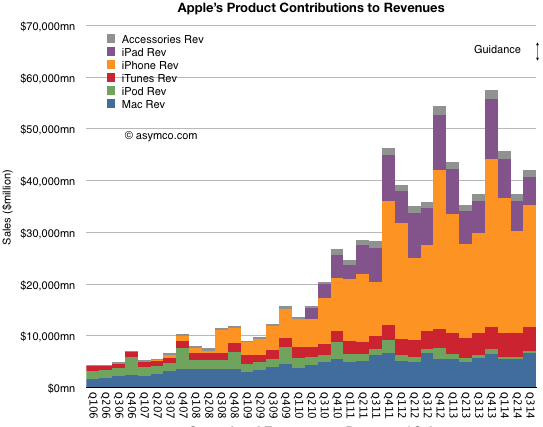
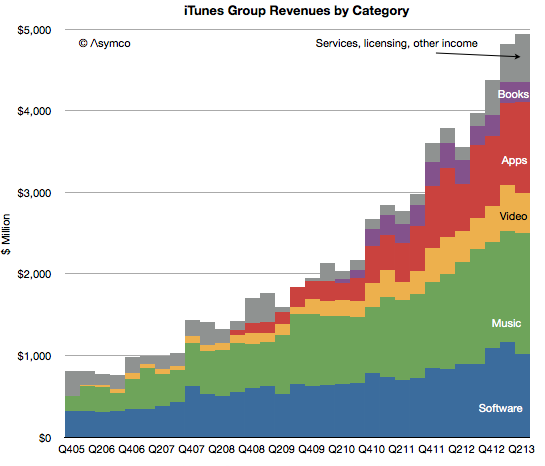
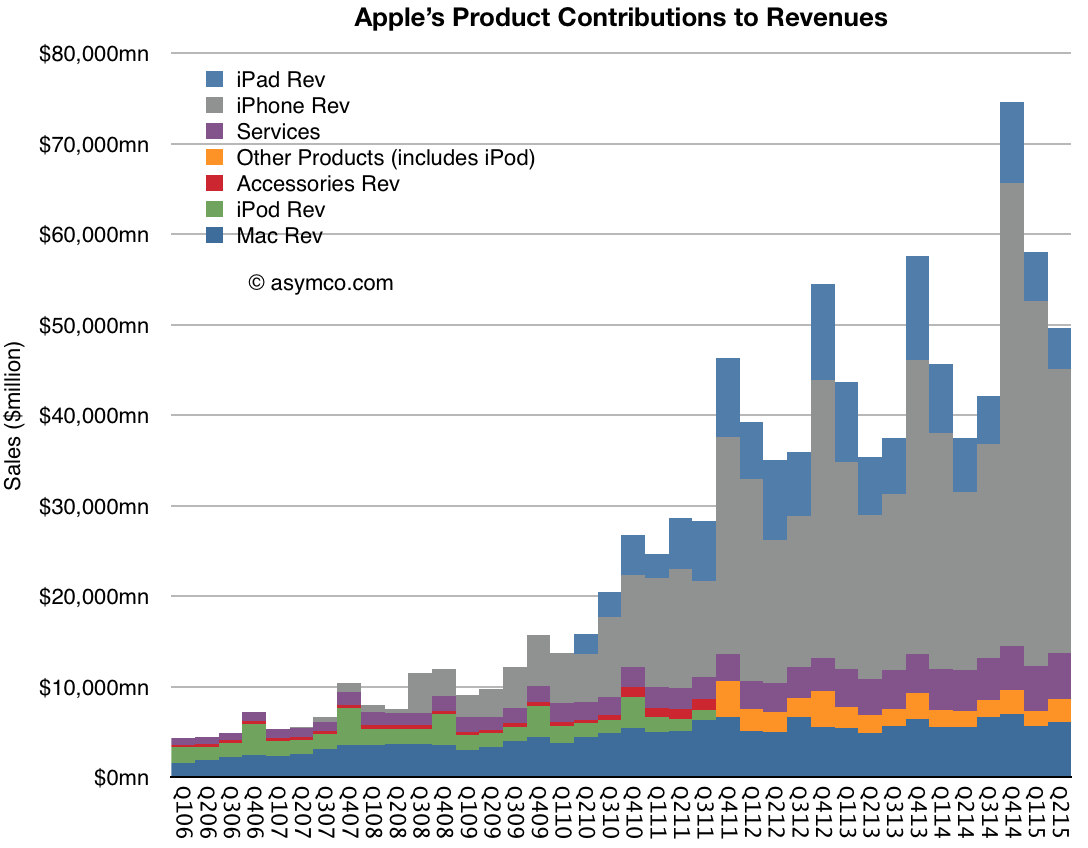
    These things are not iPhones or iPads but they are many and all together they form a modest little unit. I say modest because not much is said about it. When seen in contrast to the other Apple product lines, it's hard to be impressed. In the graph below it's the purple area.

    Screen Shot 2015-08-25 at 5.56.19 PM

    Apple does not help much. Occasionally  Apple offers updates on iTunes/Services using various (rarely the same) metrics. For example, in early August, Eddy Cue offered an update during an interview with USA Today on Apple Music relating how many users there were one month after the service started (11 million).  It was worth a few headlines.

    However he also noted in passing that the App store did $1.7 billion in transactions during July. If you convert that to a yearly run-rate it comes out to about $20 billion/yr. Digging through previous announcements, the equivalent figure for 2014 was about $13.7 billion. Nice growth.

    But is $20 billion of "transactions" of any significance? It's not even a figure that Apple reports as revenue. For apps, Apple reports only the 30% fee as revenues so 70% of that transaction value passes through to developers and is therefore not part of its statement of accounts. ((From SEC filings: For third-party applications sold through the App Store and Mac App Store and certain digital content sold through the iTunes Store, the Company does not determine the selling price of the products and is not the primary obligor to the customer. Therefore, the Company accounts for such sales on a net basis by recognizing in net sales only the commission it retains from each sale. The portion of the gross amount billed to customers that is remitted by the Company to third-party app developers and certain digital content owners is not reflected in the Company’s Consolidated Statements of Operations.))

    However perhaps we should consider the figure in some way. It represents transactions in an economic sense--the amount people spend on apps. It's therefore comparable with what people spend on other forms of entertainment. Movies for example.

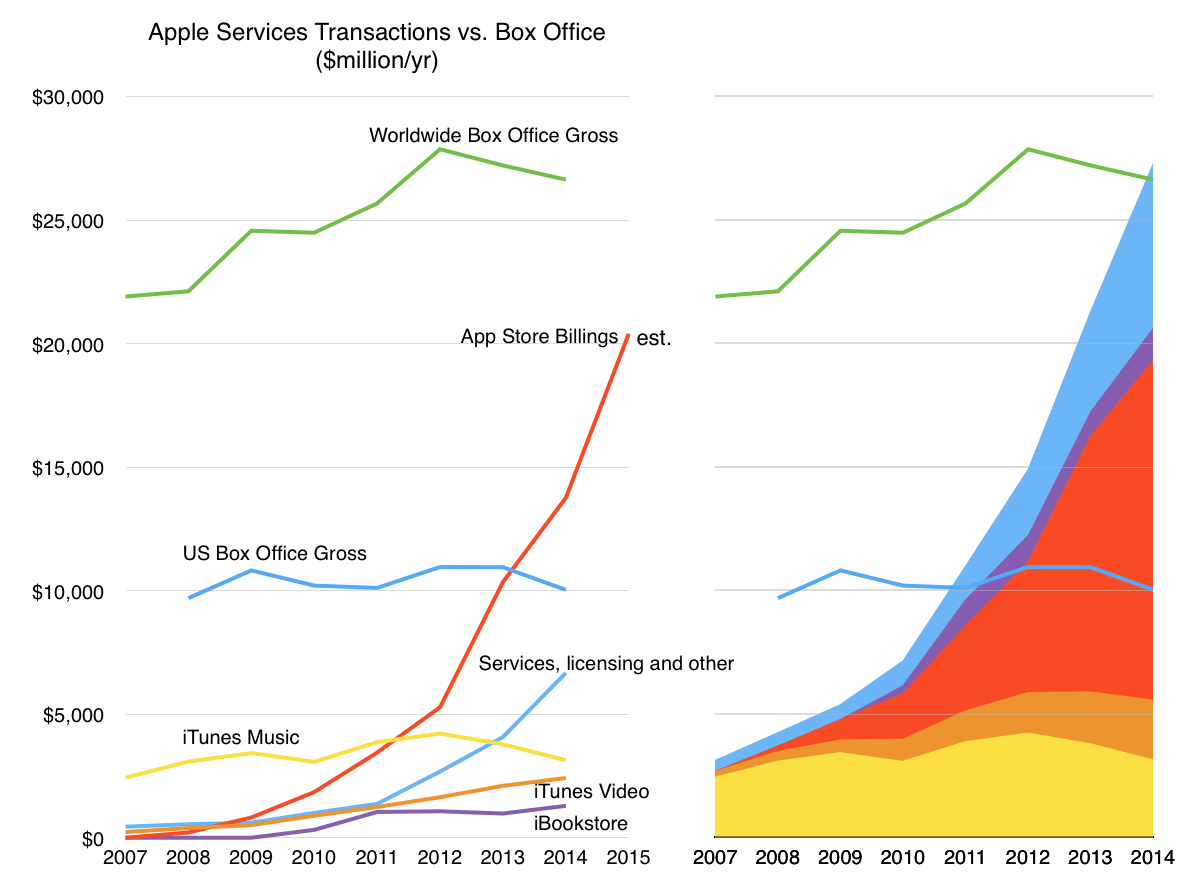
    The following graph shows the spending on apps within the iTunes App Store ((note that this does not include Google's Play Store whose transaction values are not public and is therefore not a gauge of all apps.)) as well as spending on other forms of iTunes stores as well as Services. It also shows how all the services compare with box office revenues from movies. Both the US and World-wide. And how these figures changed over the few years that the App Store has been in existence. The individual service line items are shown in the graph on the left and the stacked totals are on the right.

    Note that already last year App Store Billings overtook US Box Office gross revenues and that Services a whole overtook Global Box Office gross revenues. It's not likely to happen this year but next year Apple's Apps will almost certainly overtake global Box Office in revenues.

    Screen Shot 2015-08-25 at 5.39.08 PM

    This contrast with movies gives some perspective on the creation of a new market. Apps did not exist as a medium in 2007. But, together with Android apps, apps are likely to have already overtaken revenues from an industry that is a century old. And not just any industry. Hollywood represents more than an economic power, it has a cultural power affecting perceptions and political opinion. And although universally envied, it has not been successfully replicated.

    So having created this market and becoming bigger than Hollywood, and grossing more than what 90 countries produce, Apple's Services not something that is interesting to many who think about technology or even to many who think about Apple.

    Which is why I think Eddy's such a nice guy. No matter how little attention is paid to his economic empire, he always seems to be in a good mood. Maybe he knows something we don't.

  3. How iPad Educates

    Research · 20 comments

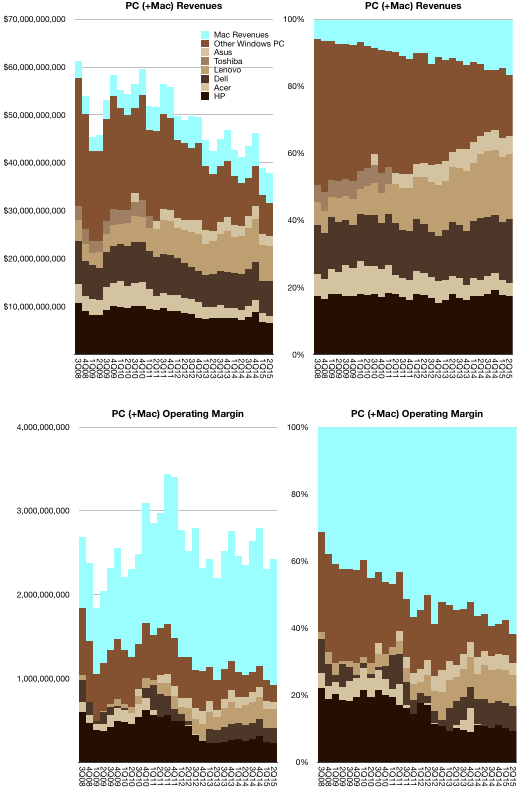
    The fact that the iPhone is contributing over 90% of the operating profits in mobile phone sales has penetrated even as far as the Wall Street Journal. However, it's not yet commonly known that the Mac captures a majority of personal computer operating profits, at least when considering the sale of hardware.

    My calculations suggest at least 60% of operating margin in personal computing hardware is captured by Apple. This is mainly due to the fact that the average Mac sells for more than $1200 while the average PC sells for less than $450.That is equivalent to $1.5 billion per quarter for Apple vs. $930 million for all the other PC makers combined.

    Screen Shot 2015-07-17 at 12.16.27 PM

    If we are to consider the iPad as a "PC equivalent" computer ((for a substantial minority of tasks)) then another $billion/quarter is contributed to the profit pool. It increases Apple's share of profits to 73%. As a result, Apple absolutely dominates computing profits.

    But, as we know, computing, even on handheld devices, is enabled by a multitude of business models. Selling hardware is one thing, but Microsoft showed that one could sweep up profits in the industry by selling enabling software. It's much harder to assign a share of profits if we try to consider all the business models associated with computing and all the form factors that computing has taken shape in.

    The problem can be acutely observed with the iPad alone. It's sold with a decent margin ((my estimate is a gross margin of around 27%)), though not one which approaches that of the iPhone ((my estimate of the iPhone gross margin is near to 48%)). It also enables an ecosystem with thousands of collaborating firms and users.

    Consider the uses of the iPad in education. 15 million iPads were sold to educational institutions. An unknown number of millions have been hired for education uses by end-users or teachers. The result is over 100,000 education apps are available in the App Store.

    The education sector's "jobs-to-be-done" has led to the product being associated with entire new processes for education. Education is not a product but a process and therefore any technologies must be hired as part of the process. In the App Store you can see the “Apps in the Classroom” guides along with impressively powerful apps being used in education. These are educator-created guides designed for other educators.

    There is no way to measure the "profit" in this endeavor.

    Nor is there a way to capture the "profit" in people engaging in exercise because they wear an Apple Watch.

    Nor is there a way to track the operating profit of HealthKit which has enabled 1000 apps to help people manage their health.

    These education and health efforts are not designed to be profitable. And yet Apple is very profitable. That is because creating valuable things generally leads to value being accrued by their creator. How that happens is not very important. Indeed, focusing of the how is actually often self-defeating. What matters is the why and the what is done.

    Understanding this leads us to understand the foundation of any great organization, not just Apple.


  4. Bigger than Hollywood

    Research · 72 comments

    Apple paid $10 billion to developers in calendar 2014. Additional statistics for the App store are:

    • $500 million spent on iOS apps in first week of January 2015
    • Billings for apps increased 50% in 2014
    • Cumulative developer revenues were $25 billion (making 2014 revenues 40% of all app sales since store opened in 2008)
    • 627,000 jobs created in the US
    • 1.4 million iOS apps catalog is sold in 155 countries

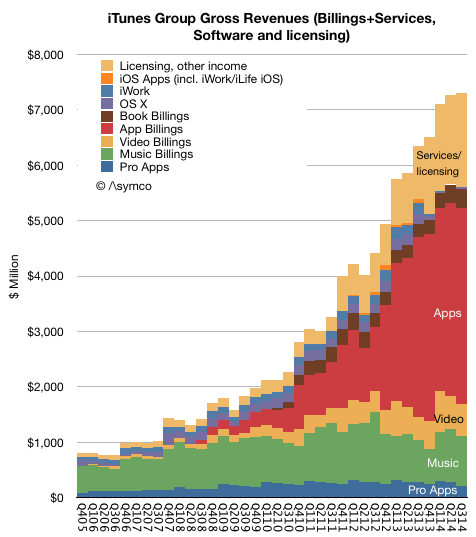
    Putting these data points together with others from previous releases results in a fairly clear picture of the iTunes/Software/Services ((soon to be renamed Services and encompass everything under the heading of iTunes software and services today including content, apps, licensing and other services and beginning Q4 2014 it will also include Apple Pay.))

    Screen Shot 2015-01-22 at 1-22-10.38.39 AM

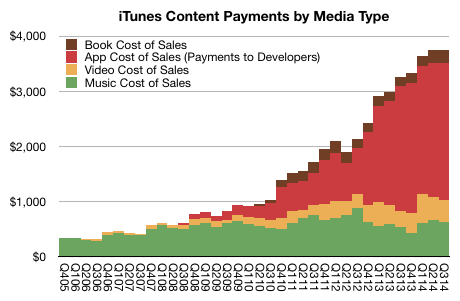
    The App ecosystem billings (what consumers actually pay) is shown in the red area above. 70% of those payments are transferred directly to developers and Apple reports the 30% remaining as part of its revenues. This view of the iTunes ecosystem shows the impact of Apps relative to the other media types. When we measure the payments to the content owners we can see that Apps also dominate: 

    Screen Shot 2015-01-22 at 1-22-10.44.16 AM

    The red area above adds up to the approximately $25 billion total paid to developers. This view of the payments to ecosystem contributors shows how apps are now a bigger digital content business than music (( Music payments due to iTunes Radio streams are not shown as part of Music cost of sales. Streaming revenues are included in the services/licensing income and payments come out that cost structure.)) and TV programs and Movie rentals and purchases put together.

    This is quite a story.

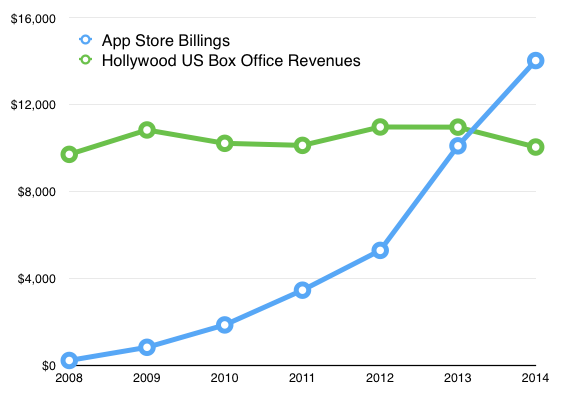
    Put another way, in 2014 iOS app developers earned more than Hollywood did from box office in the US.


    Although the totals for Domestic (US) Box Office are not the complete Hollywood revenues picture, Apple's App Store billings is not the complete App revenue picture either. The Apps economy includes Android and ads and service businesses and custom development.  Including all revenues, apps are still likely to be bigger than Hollywood.

    But there's more to the story. It's also likely that the App industry is healthier. On an individual level, some App developers earn more than Hollywood stars ((so do YouTube stars, but that's another story.)) and I would guess that the median income of app developers is higher than the median income of actors. ((A large majority of actors earn less than $1,000 a year from acting jobs)) The app economy sustains more jobs (627,000 iOS jobs in the US vs. 374,000 in Hollywood) and is easier to enter and has wider reach. As the graph below shows It's also growing far more rapidly.

    Screen Shot 2015-01-22 at 1-22-11.30.06 AM

    The curious thing is that even though the medium of apps is swamping other forms of entertainment in all measurable ways, comprehension of the phenomenon is lagging.

    Information asymmetry is a wonderful thing.

  5. How big is iCloud?

    Research · 24 comments

    Apple has declared that what used to be "Other Music Related Products and Services" ((Includes revenue from sales from the iTunes Store, App Store and iBookstore in addition to sales of iPod services and Apple-branded and third-party iPod accessories.)) plus "Software, Service and Other Sales" ((Includes revenue from sales of Apple-branded and third-party Mac software, and services.)) which was formerly known as "iTunes/Software/Services" ((Includes revenue from sales on the iTunes Store, the App Store, the Mac App Store, and the iBooks Store, and revenue from sales of AppleCare, licensing and other services)) is about to become "Services".

    "We'll also have a category that we refer to as services and this will encompass everything we report under the heading of iTunes software and services today including content, apps, licensing and other services and beginning this month it will also include Apple Pay."

    "Services" will therefore encompass a massive amount of revenue. The reported revenues for the fiscal 2014 were $18 billion. Including all billings, the turnover in sales is over $28 billion. For next year, assuming that Apple Pay, which is just getting started, is unlikely to contribute greatly to revenues, Services turnover will top over $35 billion. That figure would make Apple Services alone one of the top 90 companies in the Fortune 500.

    Screen Shot 2014-11-14 at 5.11.47 PM

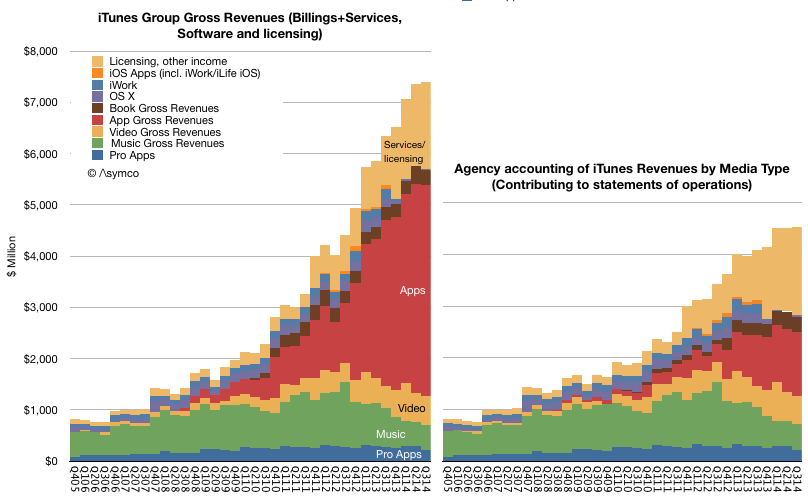
    Regardless, as a component of overall sales, the group formerly known as iTunes/Software/Services (shown in red above) was a modest 7% of total sales in the last quarter. Using all available information regarding downloads, payouts and reported financials, an estimate can be obtained on how this 7% is itself divisible into nine sub-segments:

    Screen Shot 2014-11-14 at 5.15.08 PM
    • Pro Apps
    • Music
    • Video
    • Apps
    • Books
    • OS X
    • iWork
    • iOS Apps
    • Licensing and other income

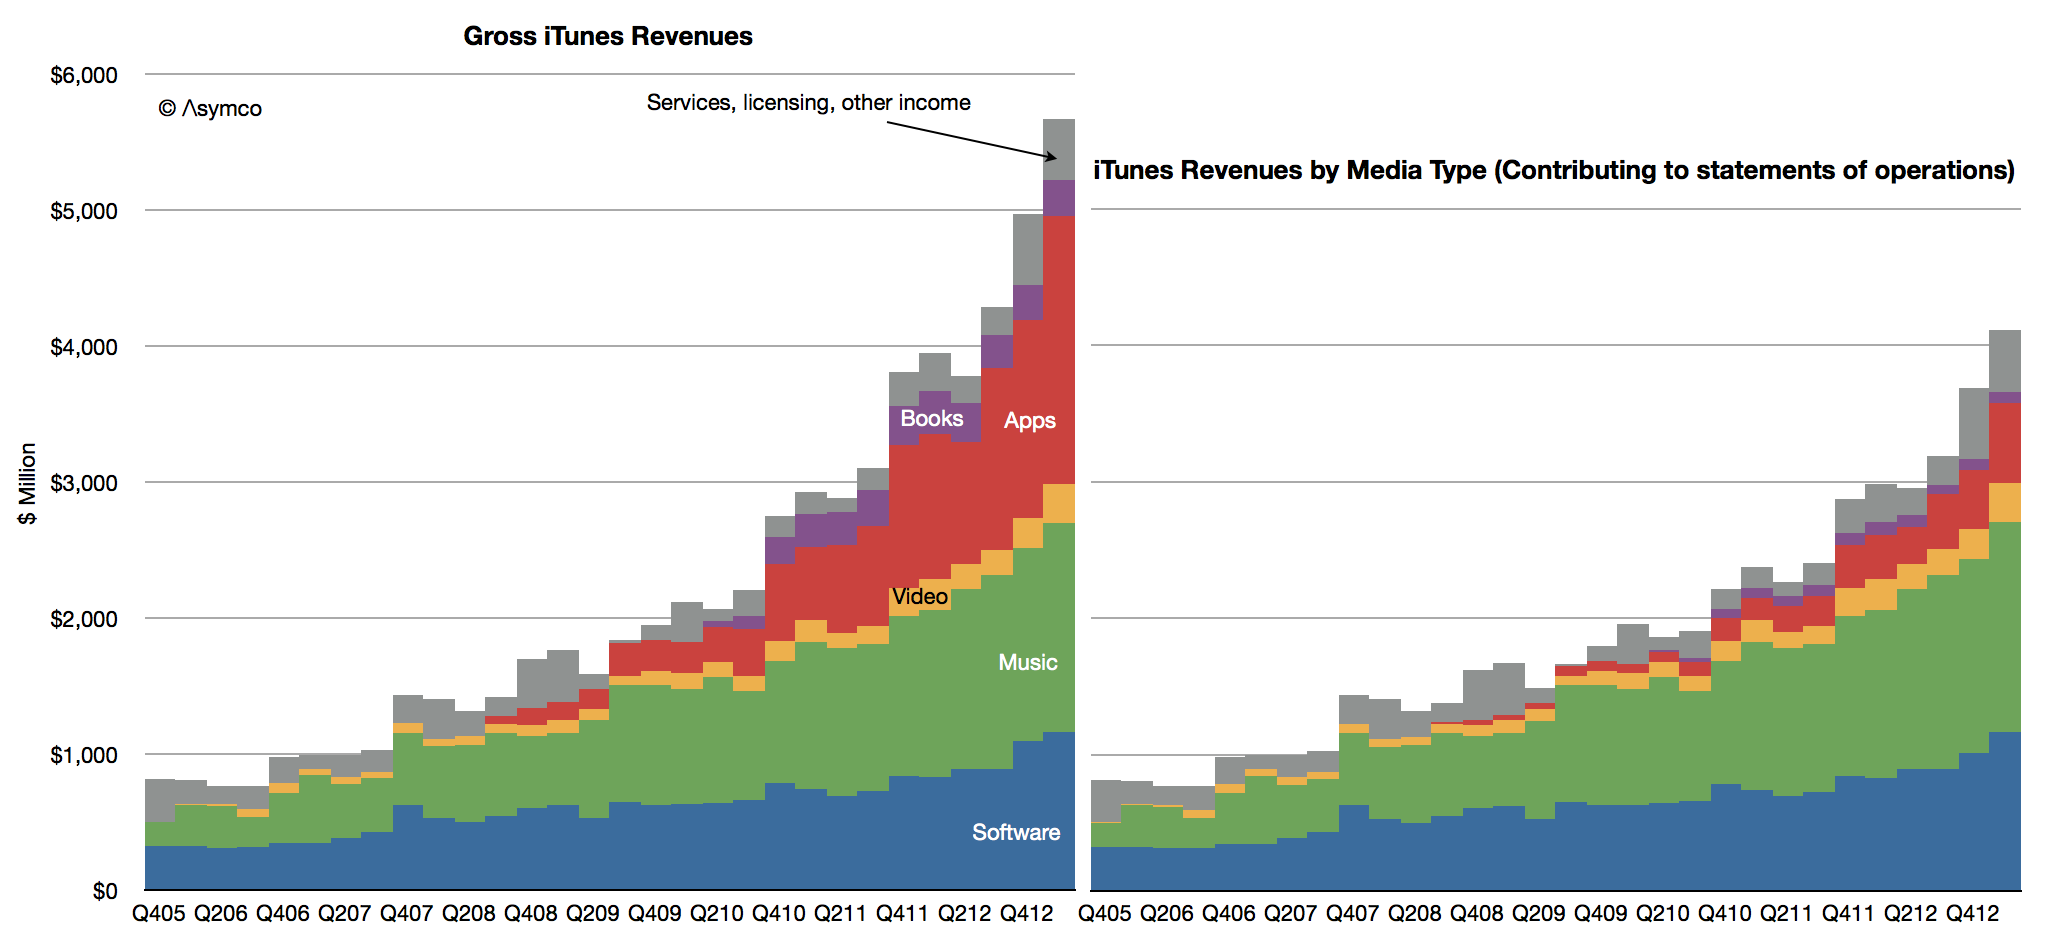
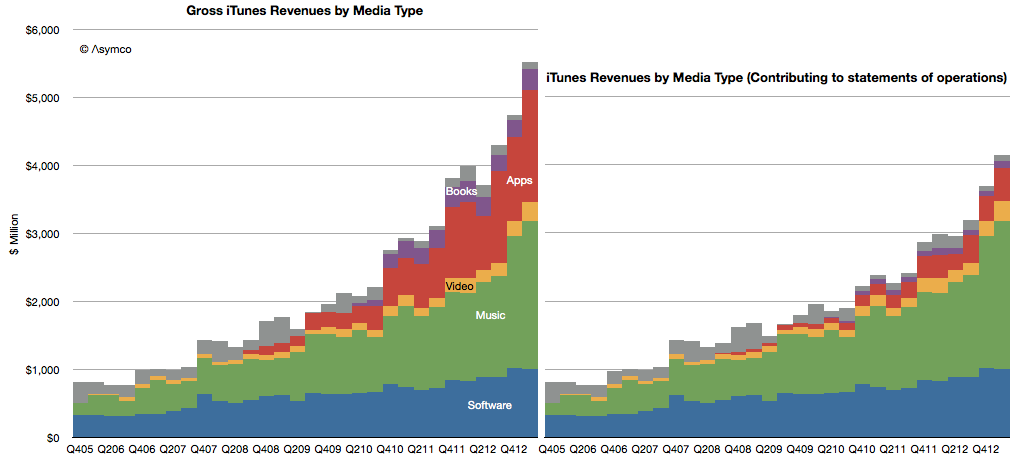
    These are shown above as either contributing to statement of operations (i.e. as reported, on right) or using billings (or the actual "cash register takings", on left). ((The primary distinction is in Apps billings where the 70% paid to developers is not shown as revenue.))

    What would be ideal in understanding this Services segment would be to break the "Licensing and other income" into its component parts. Namely:

    • Licensing revenues including Google's payments for traffic acquisition (TAC)
    • AppleCare
    • iTunes Match
    • iTunes Radio
    • iAd
    • iCloud
    • (and soon, Apple Pay)

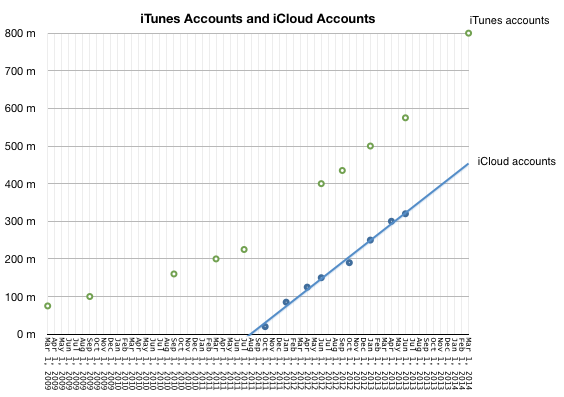
    In particular, it would be very interesting to know exactly how much revenue could be coming from iCloud. We have not heard from Apple on iCloud user numbers since mid-2013 and this was the data at the time:

    Screen Shot 2014-11-14 at 5.30.27 PM

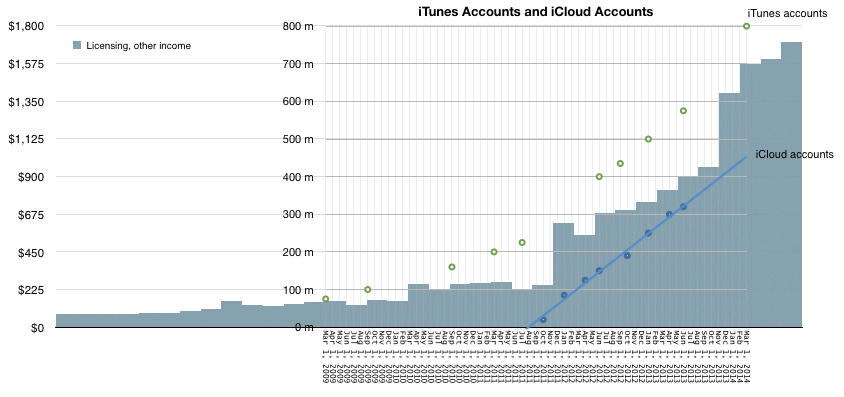
    Couple that to "Licensing and Other Income" as deduced from Services accounting yields the following picture:

    Screen Shot 2014-11-14 at 5.38.30 PM

    It would appear that iCloud accounts are growing in proportion to "Licensing and Other Income". Note that at the point that iCloud accounts were zero, revenues from Licensing were about $225 million/quarter and growing slowly. The real growth kicked in when iCloud accounts started ramping up. Since revenues from iCloud has to be in the "other income" and since no then it is, I believe, reasonable to assume that the iCloud user base growth is a principal driver of growth ((Of course, AppleCare could also be a driver but AppleCare should follow overall device sales patterns and this is not clearly evident in the Licensing/Other curve))

    Also, bursts in the Licensing and other income line occurred after several iCloud-specific marketing events:

    Mobile Me migration started in October 2011 and on September 30, 2013 the complimentary iCloud storage plans expired and were automatically adjusted to the free 5 GB plan (with an offer to upgrade to a paid plan). Correspondingly, Q1 2012 and Q1 2014 showed the largest increases in Licensing and Other Income.

    This is a multiplication of many assumptions, but there is some intuitive logic. The only place iCloud can be found seems to be growing in proportion to iCloud users and plan marketing.

    So how much does iCloud contribute to Apple's sales? My guess would be about $1 billion per quarter. That would be spread over 500 million iCloud accounts and therefore an average revenue per account of $2/user/quarter or $8/user/yr.

    The lowest non-free iCloud pricing is about $12/yr (5GB plan is free). This would imply that two thirds of iCloud users are paying users (and one third are opting for the 5G plan).

    I realize that this attach rate to a paid service is astronomical. Anything over 10% is unheard of. I would say the error in my estimates could be 20% but that still leaves a huge gap to what seems reasonable.

    [Put another way, if the attach rate were only 10% then iCloud revenues would have to be in the $600 million range and thus only about 10% of what Licensing and Other income seems to be. This would force the question of what could be generating the remaining $5.6 billion/yr.]

  6. Of bits and big bucks

    Research · 90 comments

    Exactly one year ago, on January 7th, 2013, Apple announced that the App Store reached 40 billion downloads ((Unique downloads excluding re-downloads and updated)). Here are additional data points from that release:

    • 20 billion downloads in 2012
    • 2 billion downloads in December 2012
    • 500 million active iTunes accounts
    • 775,000 apps
    • sold in 155 countries
    • 300,000 native iPad apps
    • over $7 billion in developer payments

    This year, on January 7th, 2014, Apple announced a new set of data points:

    • $10 billion spent on the App Store in 2013
    • $1 billion in December 2013
    • 3 billion app downloads in December 2013
    • 1,000,000 apps
    • sold in 155 countries
    • 500,000 native iPad apps
    • $15 billion in developer payments

    The obvious:

    1. 225,000 apps were added in 2013
    2. 200,000 native iPad apps added in 2013
    3. App download rate for December increased by 50%
    4. No new countries were added in 2013
    5. $8 billion was paid to developers in 2013 (more than in all previous years put together)

    The less obvious:

    1.  No update on iTunes accounts this time but there was a mid-year update (June 10th) which put iTunes accounts at 575 million. iTunes accounts have grown linearly since mid 2011 so it's quite probable that the current total is above 650 million. 
    Screen Shot 2014-01-08 at 1-8-9.28.41 AM
    1. Given mid-year updates to earnings/revenue and the October 22nd update that 60 billion total apps were downloaded and the May 15th update that 50 billion total apps were downloaded it's possible to estimate with confidence that there are now 68 billion total apps downloaded and that were about 27 billion app downloads in 2013. This is an increase of 35% in the yearly download rate. As noted above, the December growth alone was 50%.
    2. Given mid-year updates on developer payments, and download rates we can estimate revenues per app have increased. As in-app purchasing has taken off it's no longer meaningful to assign a "purchase value" to each download. The rate of payments to developers is increasing faster than the download rate. Currently $26 million is paid out every day while about 100 million apps are downloaded daily. Note that the trend lines below are arbitrary: 
    Screen Shot 2014-01-08 at 1-8-9.41.18 AM
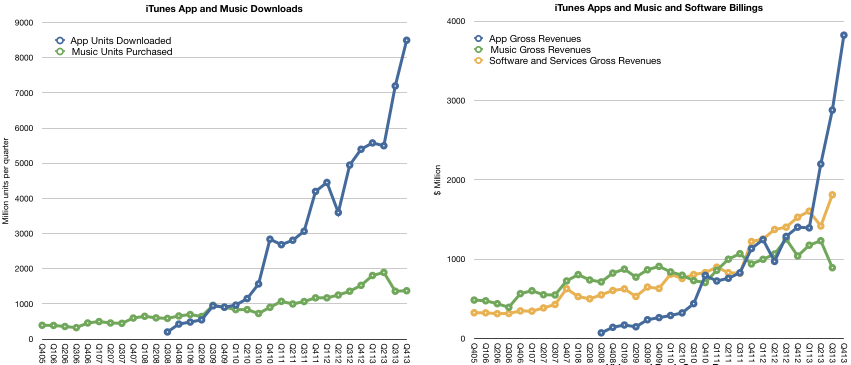
    1. As other reports have noted, there was a decrease in music downloads in 2013. This is also evident when backing into a download total for music given the earnings data and the above evidence of app growth. My estimates below may be overly generous for music unit downloads as they also assume lower pricing. Overall gross music revenues through the iTunes music store ((Excluding new iTunes radio and revenues from services such as Match)) are flat for the year and may even have begun declining precipitously. App revenues are more than compensating for this. 
    Screen Shot 2014-01-08 at 1-8-9.50.37 AM
    1. The iTunes content economy is grossing about $17.5 billion/yr. Apple's own software and services (reported as part of the iTunes segment) add another $6.2 billion/yr. The combined total of $23.7 billion/yr. is slightly lower than what Apple net sales were during its fiscal 2007 year or what Amazon sold in 2009.
    2. A complete report on the iTunes economy and pro-forma iTunes income statement is available for purchase at store.asymco.com.

    So much for the data. What is really happening?

    First, it's tempting to look at music and suggest that music downloads are suffering from streaming, just as it was tempting to suggest that CD buying was suffering from piracy (and later, downloads.) But this is falling into the trap of defining a product's use by the metrics used to measure transactions. These metrics are but a proxy for what consumers are actually doing with their time.

    Consumers have a fixed time budget, a more rigid constraint than their spending budget. Competition for a slice of a consumer's time budget is far tougher than competition for a slice of a consumer's wallet. So what's amazing is that apps have successfully grabbed a share of this time budget. I believe that the reason they succeeded is that they initially fit into niche time slices that were previously unoccupied. ((Interestingly, this was how music, especially digital music as enabled by the iPod, gained traction))

    Downtime or "boredom" was filled with app interaction. This includes some social media consumption. These are not immersive experiences. They are "casual",  inconsequential and trivial. At first anyway. And that's the rub. As apps enter a consumer's world they initially take on non-consumption, which is easy to beat. But as the experiences become increasingly compelling they "move upmarket" and compete more aggressively with existing media consumption patterns.

    For instance, one might allow casual gaming to take root in non-consuming contexts such as commuting, waiting, and escaping time niches. But if the experience becomes addictive, the gaming takes over time previously spent watching TV or using console games. The same can be observed for app-based experiences of social media, shopping and chatting.

    This is the insidious march of a disruptor. It gains a foothold in a context where it has no competition and then relentlessly gets better, eventually displacing the far better suited alternatives. This is what I believe is happening with apps. They are asymmetric in their competition with established media and as a result they are easily ignored and brushed off as irrelevant competition. That is until the incumbent media sees a sudden drop in consumption. Even then, the culprit blamed is not the upstart but some structural issue.

    Music would appear less vulnerable to this app-based substitution because it's an eyes-free experience and can be easily consumed concurrent with another activity. There is however, a subtle de-emphasis and hence devaluation of the experience as it fades into the background. The "job it's hired to do" changes.

    Second, and relatedly, the other meta-observation is that apps are media. They are produced, marketed and priced in ways analogous to other media types. This has implications for the artist/producer/creator. For them movement into apps is natural and effortless. It's how developers moved into them without thinking twice. Trouble is that this transition is not at all simple for those who distribute media.

    I tweeted that the media industry deplored the shift of "digital pennies for analog dollars" ((Original quote was made by Jeff Zucker, president of NBC Universal, in 2008 in reference to the future of TV)) as the packaging of their product changed. The angst and trauma suffered by the media industry when dealing with what could be seen as a trivial change in the encoding of content are the stuff of lore and legend. Moving to apps could be even more troubling. Mainly because there is already a distribution channel in place. And it's owned by a set of companies whose motives and business models are completely different.

    The app economy shows that there are big opportunities in "digital pennies" and that the figures are beginning to match even the "analog dollars". In fact, I suspect eventually digital pennies will dwarf analog dollars. The trouble is that these pennies will not be earned at the same control points. Bits are already big bucks. They're just not the bits we are used to.


  7. iTunes Update

    Research · 29 comments

    In the latest quarter the iTunes group top line grew by 25%.

    Additional newly reported items:

    • Quarterly revenues dipped slightly to $4 billion (second highest after $4.1 billion last quarter).
    • iTunes Stores billings (i.e. gross content revenues) were $4.3 billion
    • Reached the best month and best week ever for App Store billings at the end of the quarter.
    • iTunes billings translated to quarterly revenue of $2.4 billion, up 29% from the year ago but flat q/q. Company reports “strong growth in revenue in both content and apps.”
    • New content added includes HBO GO and WatchESPN available on Apple TV. Apple TV catalog now includes over 60,000 movies and over 230,000 TV episodes.
    • Users have downloaded more than 1 billion TV episodes and 390 million movies from iTunes to-date. They are purchasing over 800,000 TV episodes and over 350,000 movies per day.
    • iOS developers have now created more than 900,000 iOS apps including 375,000 apps made for iPad. Apps created grew by 50,000 overall and 25,000 iPad apps.
    • Cumulative app downloads have surpassed 50 billion.
    • App developers are being paid at the rate of $1 billion per quarter.
    • App developers have been paid over $11 billion for their sales through the App Store (half of which was earned in the last four quarters.)
    • There are now over 320 million iCloud accounts
    • There are 240 million Game Center accounts
    • Almost 900 billion iMessages have been sent
    • Over a 125 billion photos have been uploaded and over 8 trillion notifications were sent.

    Some observations and estimates:

    • Music revenue growth remains at around 15% while video revenue growth remains around 25%
    • Apps continue to accelerate with a near doubling of revenues
    • Book revenues are contracting as pricing pressure is being felt
    • The software group grew moderately at 15% as Apple’s apps are reaching saturation within the iOS user base and as Mac sales stagnate.

    As a reminder, you can order the iTunes Business Review from the Asymco Store.


    Screen Shot 2013-08-05 at 8-5-4.21.54 PM
  8. iTunes users spending at the rate of $40/yr.

    Research · 77 comments

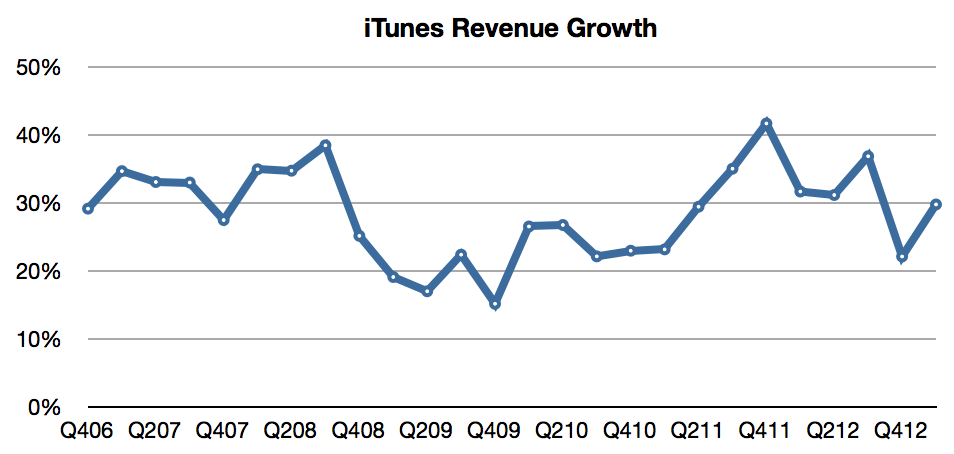
    In the latest quarter the iTunes top line grew by 32%. Additional newly reported items:

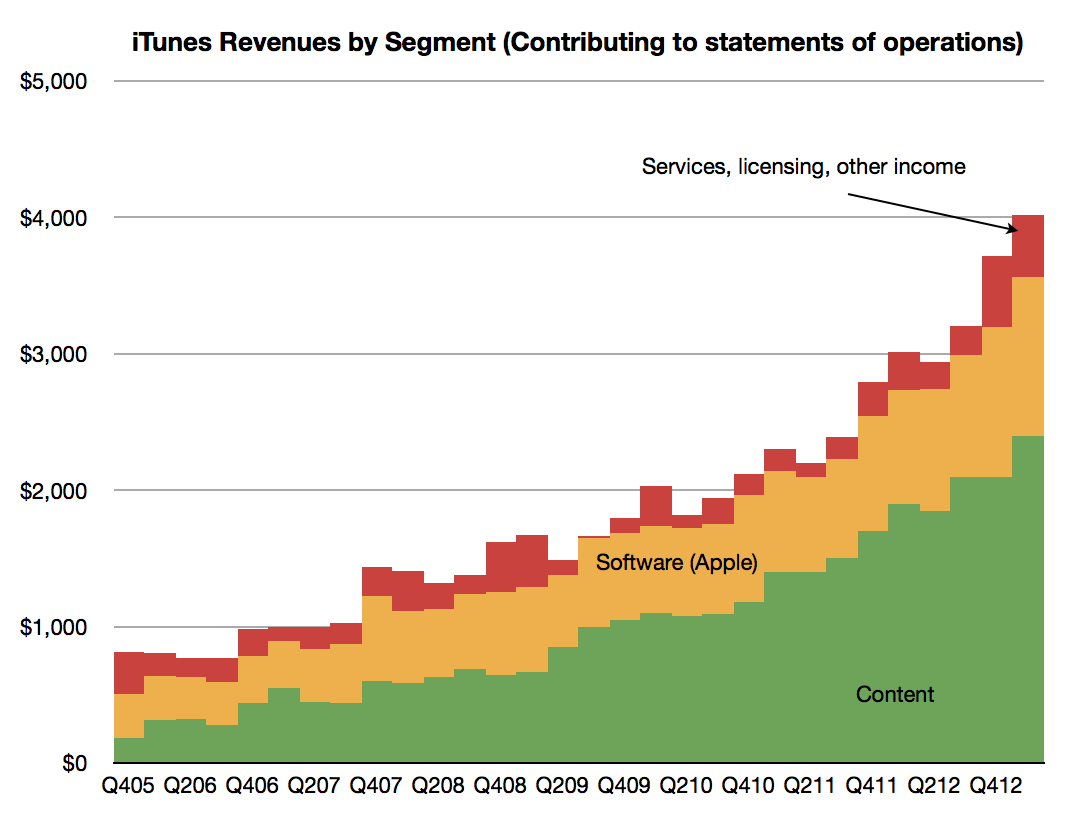
    • Quarterly revenues topped $4 billion (a new high) and the company suggests that this rate is maintainable by stating it has a “$16 billion annual run rate”. The pattern of revenues is shown below.
    Screen Shot 2013-05-12 at 5-12-8.12.30 AM
    • The content portion of iTunes revenues was $2.4 billion, up from $2.1 billion sequentially. Growth into Q1 is not unusual as many holiday iTunes gift cards are redeemed during January.
    • Revenue growth has been surprisingly steady, averaging 29%/quarter for more than six years.
    Screen Shot 2013-05-12 at 5-12-8.20.06 AM
    • Music is now available in 119 countries.
    • The Music catalog now consists of 35 million songs.
    • Movies are available in 109 countries. 60,000 titles are offered.
    • iBookstores are present in 155 countries offering 1.75 million iBooks.
    • There are iTunes App Stores in 155 countries whose residents make up about 90% of the world’s population.
    • iOS developers have created more than 850,000 iOS apps, including 350,000 made for the iPad.
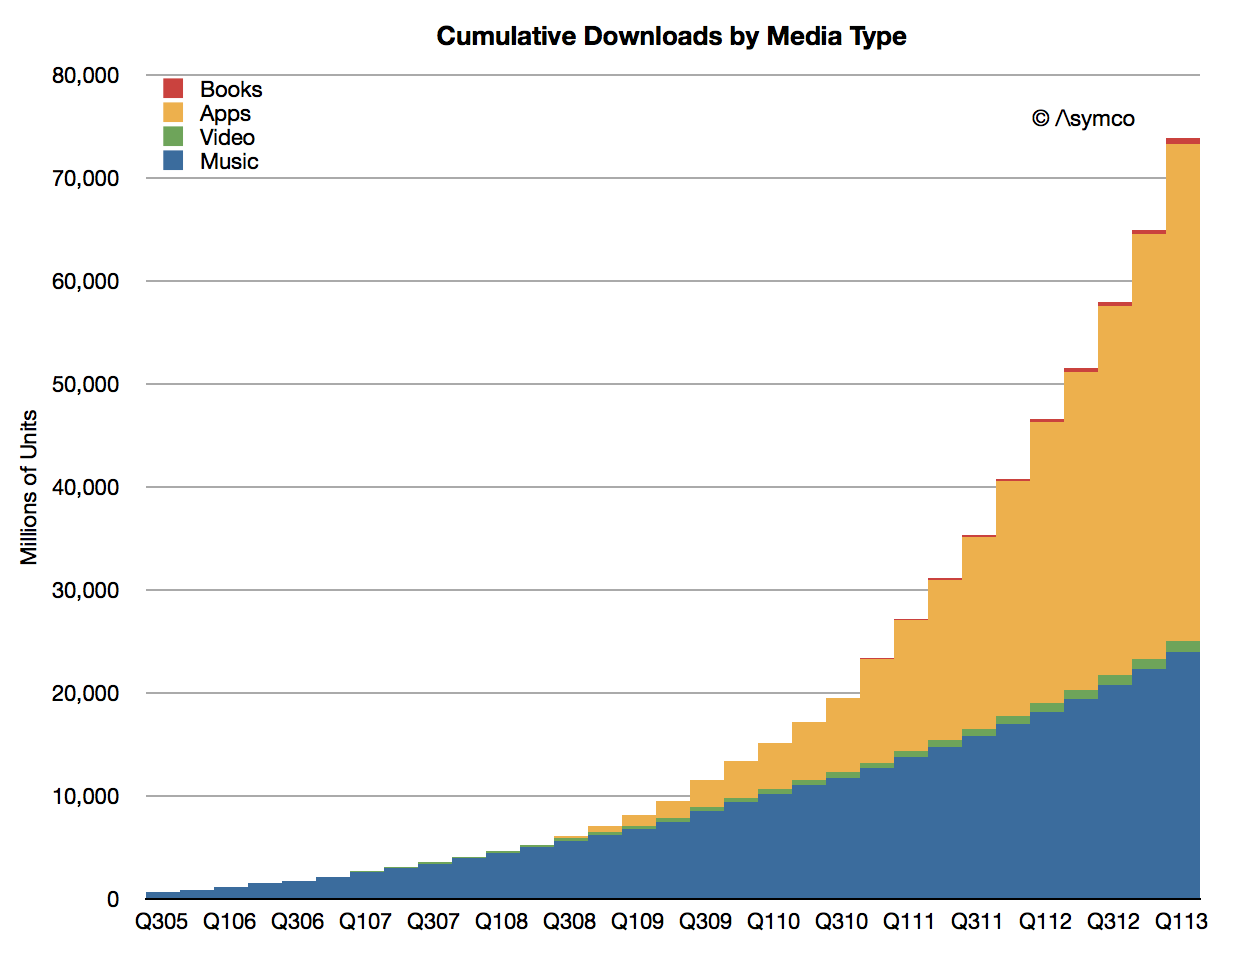
    • Cumulative app downloads have surpassed 45 billion and are on track to reach 50 billion at time of writing (estimated to be reached mid May).
    Screen Shot 2013-05-12 at 5-12-8.21.31 AM
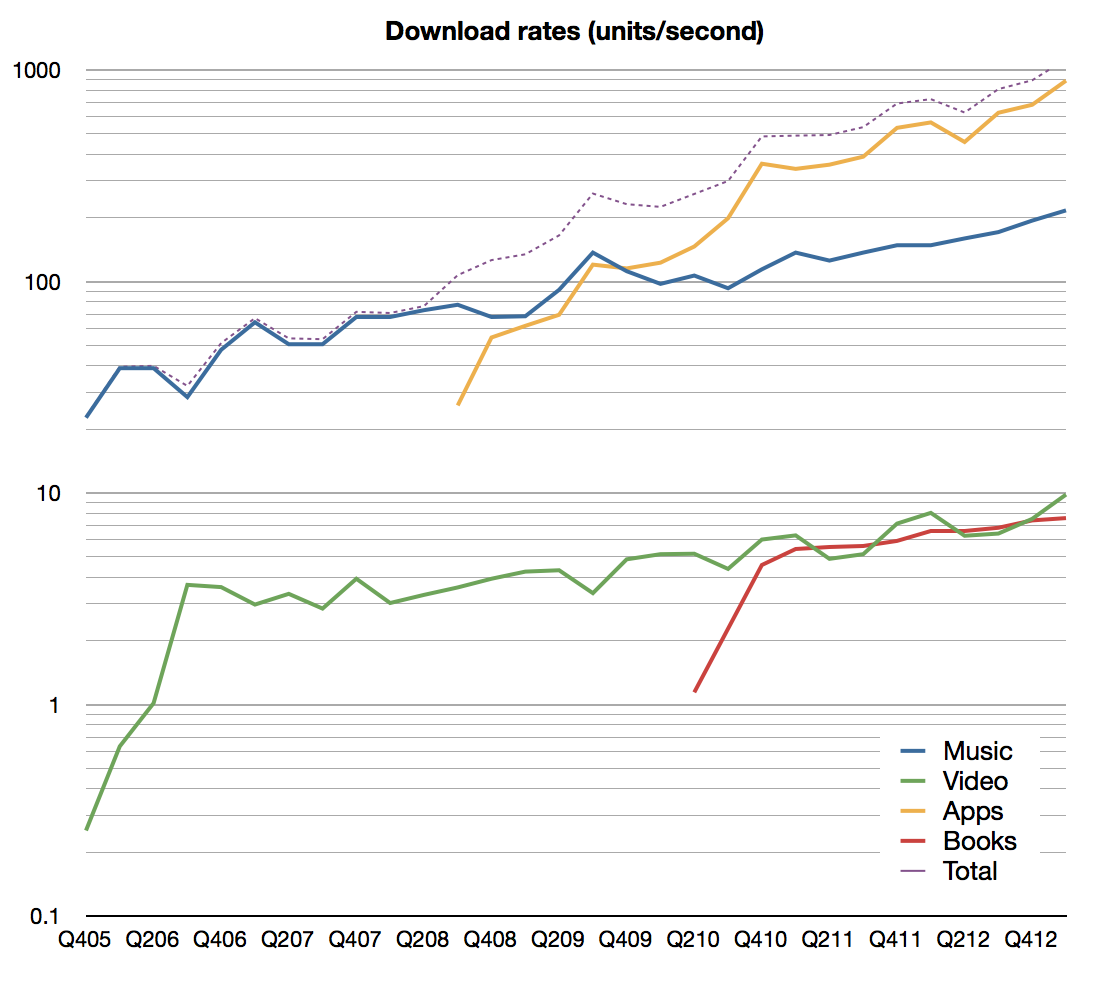
    • The company reports that over 800 apps are downloaded per second. Including all media, the download rate is now above 1000 items per second. Estimated download rates by media types are shown below (note: first graph is plotted on a log scale):
    Screen Shot 2013-05-12 at 5-12-8.34.37 AM


    Screen Shot 2013-05-12 at 5-12-9.07.49 AM


    • App developers have been paid over $9 billion for their sales through the App Store including $4.5 billion in the most recent four quarters. I estimate the split between media types as follows:
    Screen Shot 2013-05-12 at 5-12-9.13.48 AM
    • Canalys estimates that sales from iTunes App Store accounted for 74% of all app sales worldwide in the March quarter.
    • iOS app revenues more than doubled year-over-year.

    Including all (gross[1]) content revenues, the sales rate is now nearly $5 billion per quarter ($4.94 billion). Including services, the iTunes consolidated business cleared over $5.5 billion.

    Screen Shot 2013-05-12 at 5-12-9.18.30 AM

    In March Apple reported that they have 500 million iTunes so one way to think about the iTunes business is to say that  iTunes users purchase content and services at the rate of about $40 per year.[2]

    Bless them.

    ---

    Notes:

    1. "For third-party applications sold through the App Store and Mac App Store and certain digital content sold through the iTunes Store, the Company does not determine the selling price of the products and is not the primary obligor to the customer. Therefore, the Company accounts for such sales on a net basis by recognizing in net sales only the commission it retains from each sale. The portion of the gross amount billed to customers that is remitted by the Company to third-party app developers and certain digital content owners is not reflected in the Company’s Consolidated Statements of Operations." From Apple SEC filing 10-K, October 2012.
    2. Apple users spend about $1/day for each Apple device in use making the iTunes franchise an incremental 11% marginal revenue source (assuming one device/user.)
  9. Happy Birthday iTunes Store

    Research · 16 comments

    iTunes (including software and services) revenues in Q1 topped $4 billion and were 30% higher than (re-stated) 2012 Q1 revenues. Accompanying this revenue figure were additional data points from the company:

    • Cumulative app downloads have surpassed 45 billion
    • Payments to developers reached a cumulative total of $9 billion
    • Payments to developers were $4.5 billion in most recent four quarters
    • Now paying $1 billion to developers every quarter
    • 800 apps are downloaded every second
    • iOS app revenues doubled since year-ago quarter
    • App Store accounted for 74% of all app sales in the quarter (citing Canalys)
    • App stores reach customers in 155 countries (850k Apps, 350k iPad apps)
    • iTunes music downloads are available in 119 countries (35 million songs)
    • Movies are sold in 109 countries (60k titles)
    • iBookstore is available in 155 countries (1.75 million titles)

    This data allows for a few inferences:

    • Nearly 70 million apps are downloaded every day
    • The average revenue per game is about 23 cents
    • Gross app revenues are about $16 million per day (of which 11 million is paid to developers.)
    • Gross iTunes revenues were $5.4 billion last quarter of which I estimate:
    •  …App revenues were $1.6 billion
    •  …Music revenues were $2.2 billion
    •  …Video revenues were $287 million
    •  …Book revenues were $312 million
    •  …Apple's software generated $1 billion
    • In addition, I estimate that Services generated $100 million

    Note that there is a difference between the amounts transacted through the store and what the company reports. The difference is shown in the following graph

    Screen Shot 2013-04-29 at 4-29-1.02.50 PM

    To mark it's 10th year, I wrote a segment for Billboard Magazine describing what iTunes has become. I suppose it's easy to become numb to these numbers, but there is perhaps one way to look at iTunes that is still compelling:

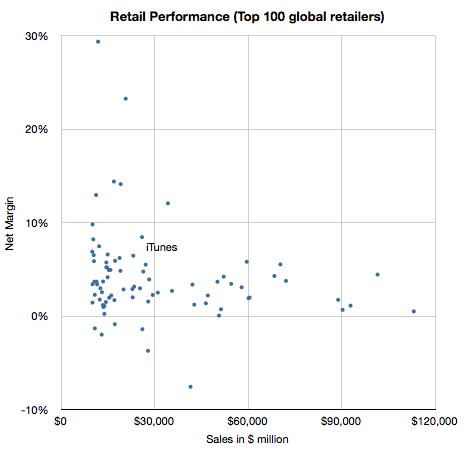
    Selling $20 billion a year would put iTunes in the top 20 US retailers and top 50 Global retailers.

    Screen Shot 2013-04-29 at 4-29-1.36.41 PM

    Not bad for a 10 year old.

  10. So long, break-even

    Research · 113 comments

    The following is another excerpt from a report titled "iTunes Business Review" which will soon be available for purchase through the Asymco Store. If you are interested in the product please get in touch.

    ---

    iTunes store will be 10 years old next month. From its inception Apple has stated that it aims to run the store "at break-even".  The business has grown so rapidly however that its profit-free nature has come under severe pressure.

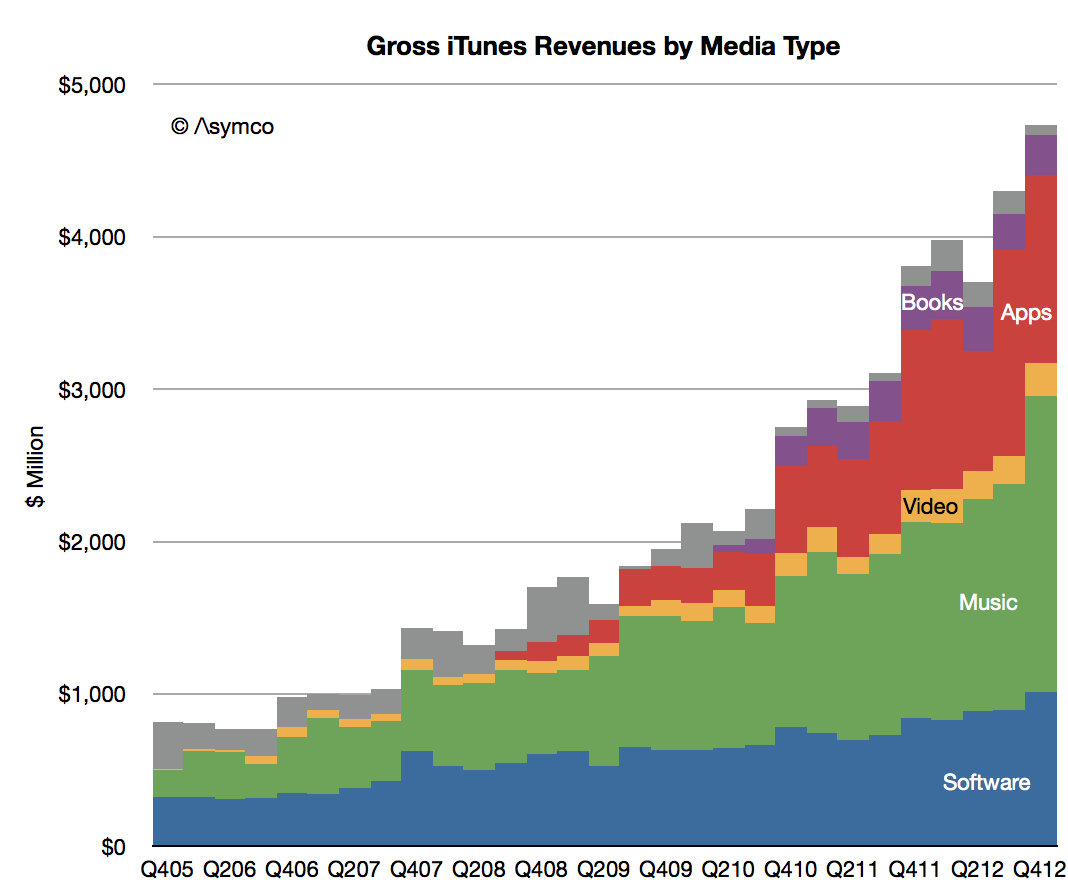
    The reasoning goes that as more media types have been added costs have increased but revenues have increased even faster. Consider the estimated gross revenue base as shown below:

    Screen Shot 2013-03-22 at 3-22-2.39.55 PM

    What is known as iTunes today has quintupled in seven years. Although cost of content sales are likely to have been preserved as a ratio (about 30%) the vastness of transaction volume (estimated at 23 billion item transactions in 2012 alone) implies that there are some significant economies of scale.

    This implies that the operating costs are spread more evenly and that therefore the possibility exists for some operating margin.

    Put another way, at break-even the cost of operating iTunes stores would be about $3.75 billion. It's hard to imagine this level of operational expense for digital content.

    For this reason, management has begun since 2010 to suggest that at least the App Store is run "a little over break-even". How little is a good question. A one percent operating margin (from gross revenues) would imply as much as $45 million margin. I estimate 2% is possible on Apps and 1% on Music.

    That's $150 million in margin content. Heady stuff.

    However, since folding its Software group into iTunes (the blue area in the graph above) the margin picture changes dramatically.

    The Software group is one of the forgotten heroes of Apple.

    Apple’s software division “Apple Software” is responsible for the following products:

    • iWork which includes Pages, Numbers and Keynote. These are available through the Mac App store at about $20 per product and the iOS App Store for $10.
    • iLife which includes iMovie, iTunes, iPhoto, GarageBand. The OS X versions are available free with new computers but they are also available as paid downloads for OS X through the Mac App Store at $15 each and for iOS devices through the App store at $4.99 per app.
    • OS products including downloads of iOS and OS X. These are mostly free but some OS X updates are not free (typically $19.99 for new version including the server version of OS X.)
    • Professional tools which include the following products: Final Cut Pro (Video editor $299.99), Logic Pro (Music editor $199.99), Aperture (Professional Photo workflow $79.99), Compressor (additional features for Final Cut Pro $49.99), Motion (video transition editing for Final Cut Pro $49.99)
    • Administration and development tools which include:  Xcode integrated development environment which is free Apple Remote Desktop which is priced at $79.99.

    All these products are now sold through either iTunes App Store or Mac App Store. They used to be sold as traditional boxed software for many years but Apple has transitioned them all to be download-only and folded them into the catalog of third party apps while lowering prices.

    My estimate is that Apple’s own software generated $3.6 billion in Revenues in 2012. As you can imagine, this is a high margin business  which grows at nearly 20%/yr. Although I estimate that the software business has been overtaken by the Apps and Music businesses in gross revenues, it keeps an operating margin similar to that of Microsoft or about 50%.

    This means that iTunes inclusive of Apple's own Software generates as much as 15% operating margin on gross revenues. That's over $2 billion a year.

    So much for breaking even.

  11. A more complete picture of the iTunes economy

    Research · 59 comments

    As it did yesterday, on occasion Apple reports the cumulative total downloads and payments to developers. Since this is done in variable time intervals, it makes analysis of the value of the app store difficult.

    But not impossible.

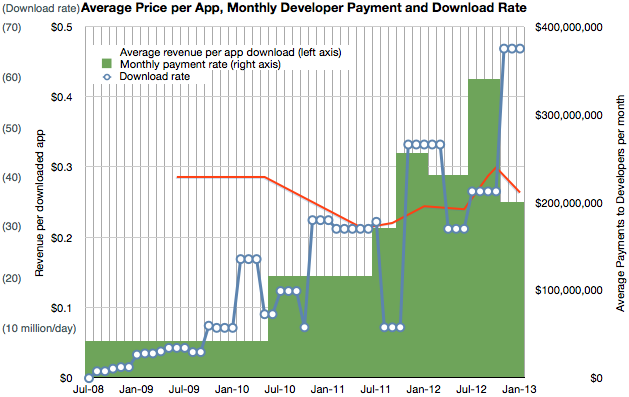
    The provision of developer revenues means we can determine the pricing of apps. The pricing of apps and the download totals allows us to determine the revenue of the store. Using the time stamps of the reports allows us to determine these quantities over time.

    I've combined the data we have so far into the following graph.

    Screen Shot 2013-01-09 at 1-9-3.17.11 PM

    It shows three quantities (on three separate scales) at a monthly resolution:

    1. Download rate (in millions/day, interpolated from download totals)
    2. Payment rate to developers (reported change in payment to developers/reported time interval)
    3. Resulting revenue per download (in red, trailing average over a 10 month period)

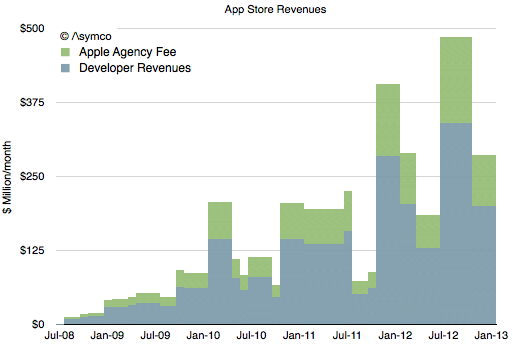
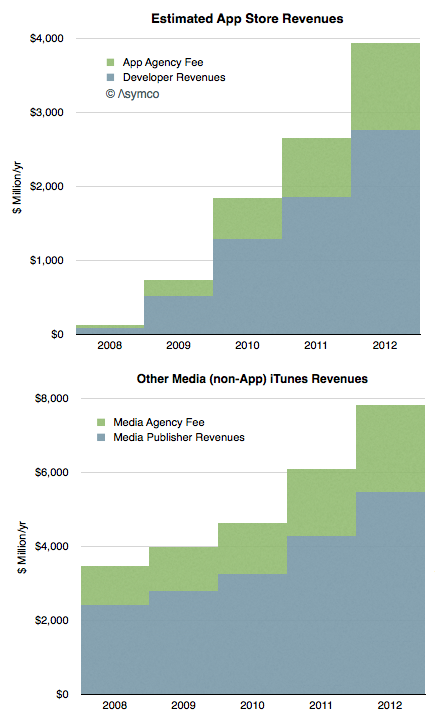
    Having a price and quantity of app downloads allows for a complete picture of App Store revenues over time, shown below:

    Screen Shot 2013-01-09 at 1-9-3.22.02 PM

    Note that I've separated the developer revenues from Apple's own revenues. The blue area should total cumulative developer payments (to a degree of error.)

    The green area above is what Apple includes in its financial reports as part of "Music" revenues. If we annualize these App Store revenues we can strip them out and show them separately from "other media" revenues.

    Screen Shot 2013-01-09 at 1-9-3.25.04 PM

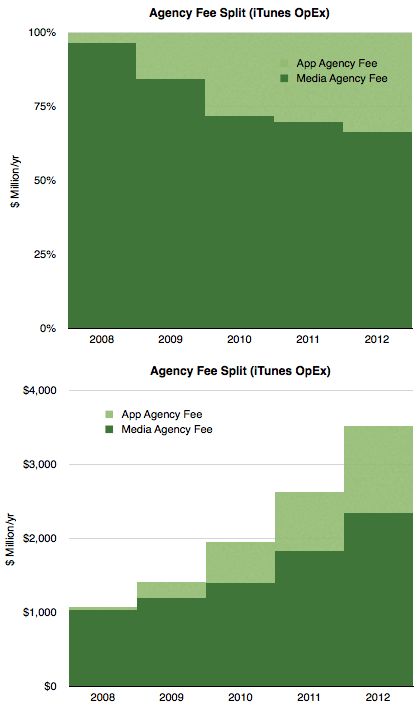
    Concentrating on the green areas which represent what Apple "keeps" we see the following split:

    Screen Shot 2013-01-09 at 1-9-3.28.55 PM

    Considering that Apple reports the iTunes store to being "slightly above break-even" then we can summarize the chart above as the operating expenses for the store.

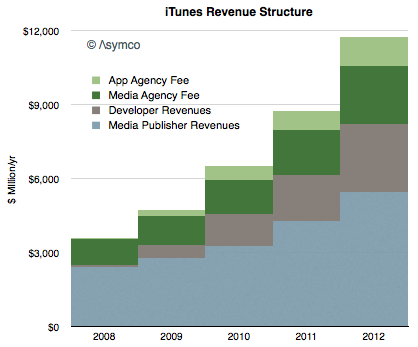
    Finally, taking into account all the information above we can draw a complete picture of how revenues flow through the App Store:

    Screen Shot 2013-01-09 at 1-9-3.34.23 PM


    Here are some conclusions:

    • The iTunes economy defined as gross revenues transacted through it is now about $12 billion/yr.
    • Over the last five years content owners (media and app) received a total of $24 billion while Apple spent about $10 billion to create those sales
    • Seen as a retail business, iTunes costs about $3.5 billion/yr to operate. This includes merchandising, payment processing and "shipping & handling".
    • Total revenues have risen steadily in a range of 32 to 38% compounded over the last 4 years.
    • Apps are now a third of all iTunes revenues, (about $4 billion/yr) having taken that share in only 4.5 years.
    • Non-app media still make up 2/3 of iTunes in terms of sales value but their growth is now 28% vs. about 50% for apps.