Asymco

Asymmetric Intelligence

Apple Mobility

  1. Covid-19 US Dashboard May 11 Including Mobility Data

    Research

    Join us for another #AsymcoFridayNight this Friday to discuss these latest developments and news from the markets.

    Sign up here: https://vito.community/events/asymco-friday-night-fever

    The Covid-19 case rates for selected US States or Territories including Apple Mobility Trend.
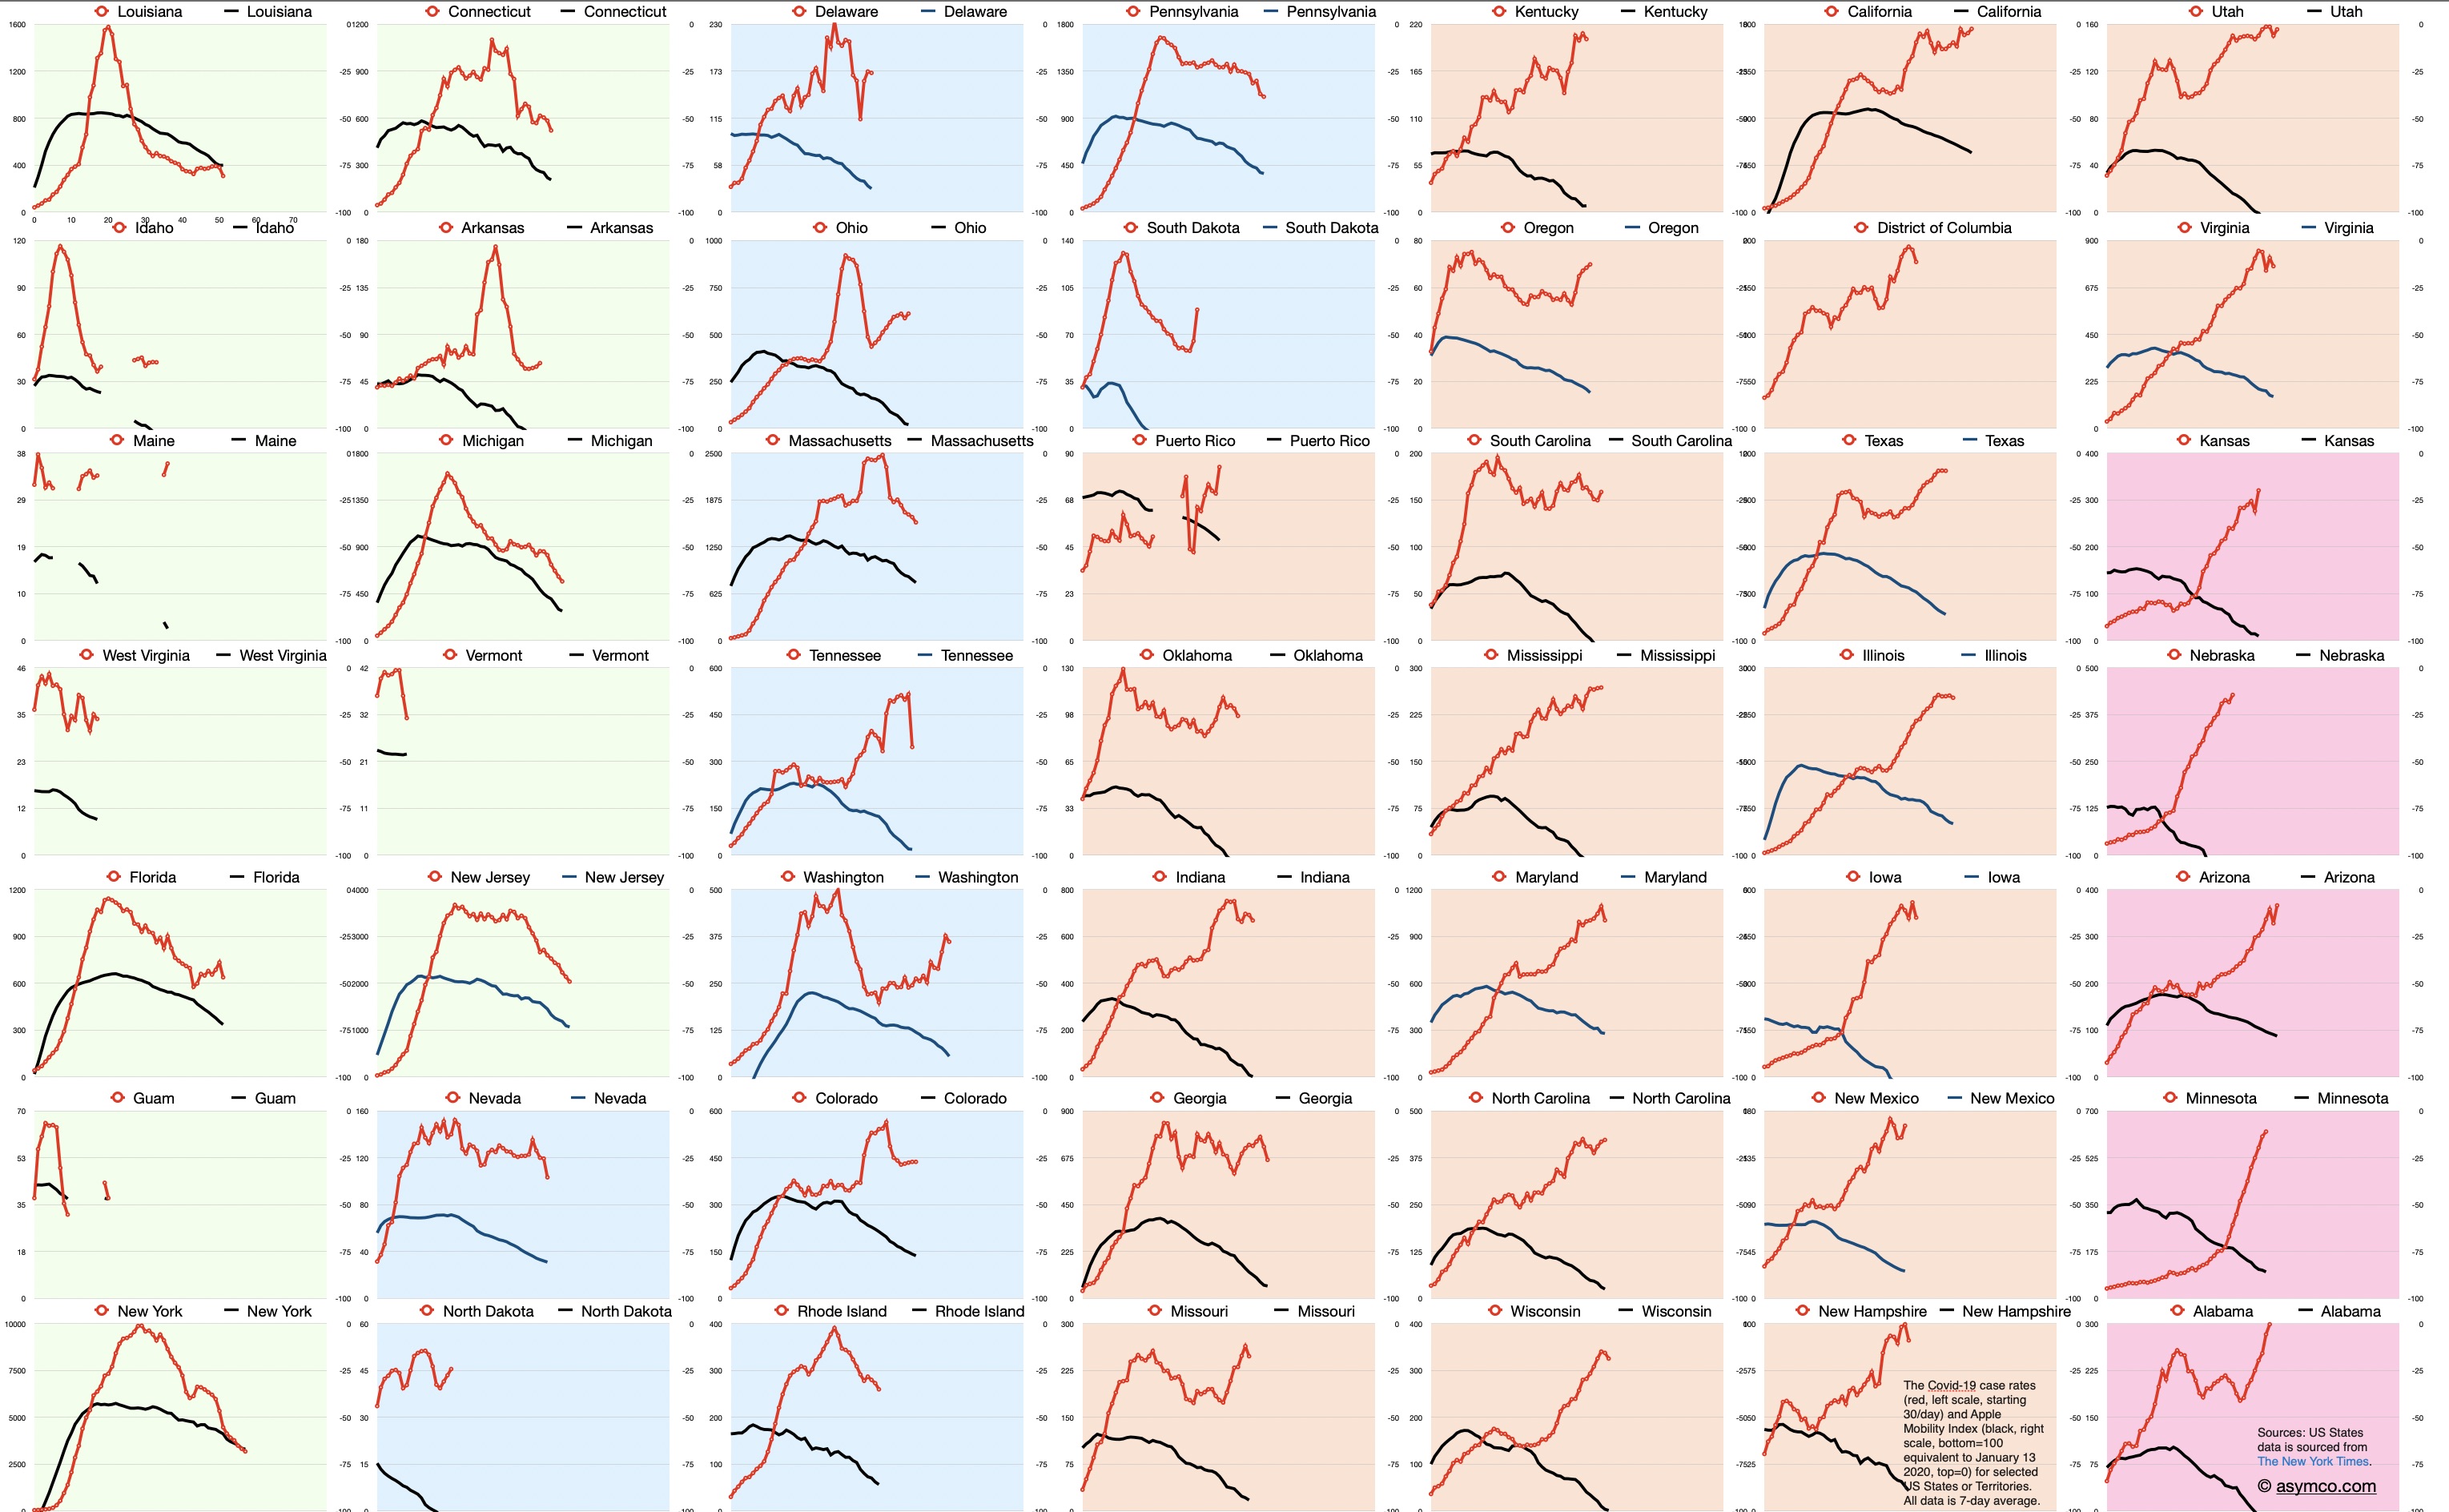
    Red line is case rate in cases/day starting at 30 cases/day, left scale. Black line is stringency index (inverse of Apple Mobility Trend, right scale. All points are 7-day averages. Click on image for higher resolution or download.

    The Covid-19 case rates for selected US States or Territories including deaths/day data. Note that the two curves are not for the same dates but are offset in time to start from 30 cases/day over a 7 day average and 5 deaths/day over a 7 day average.
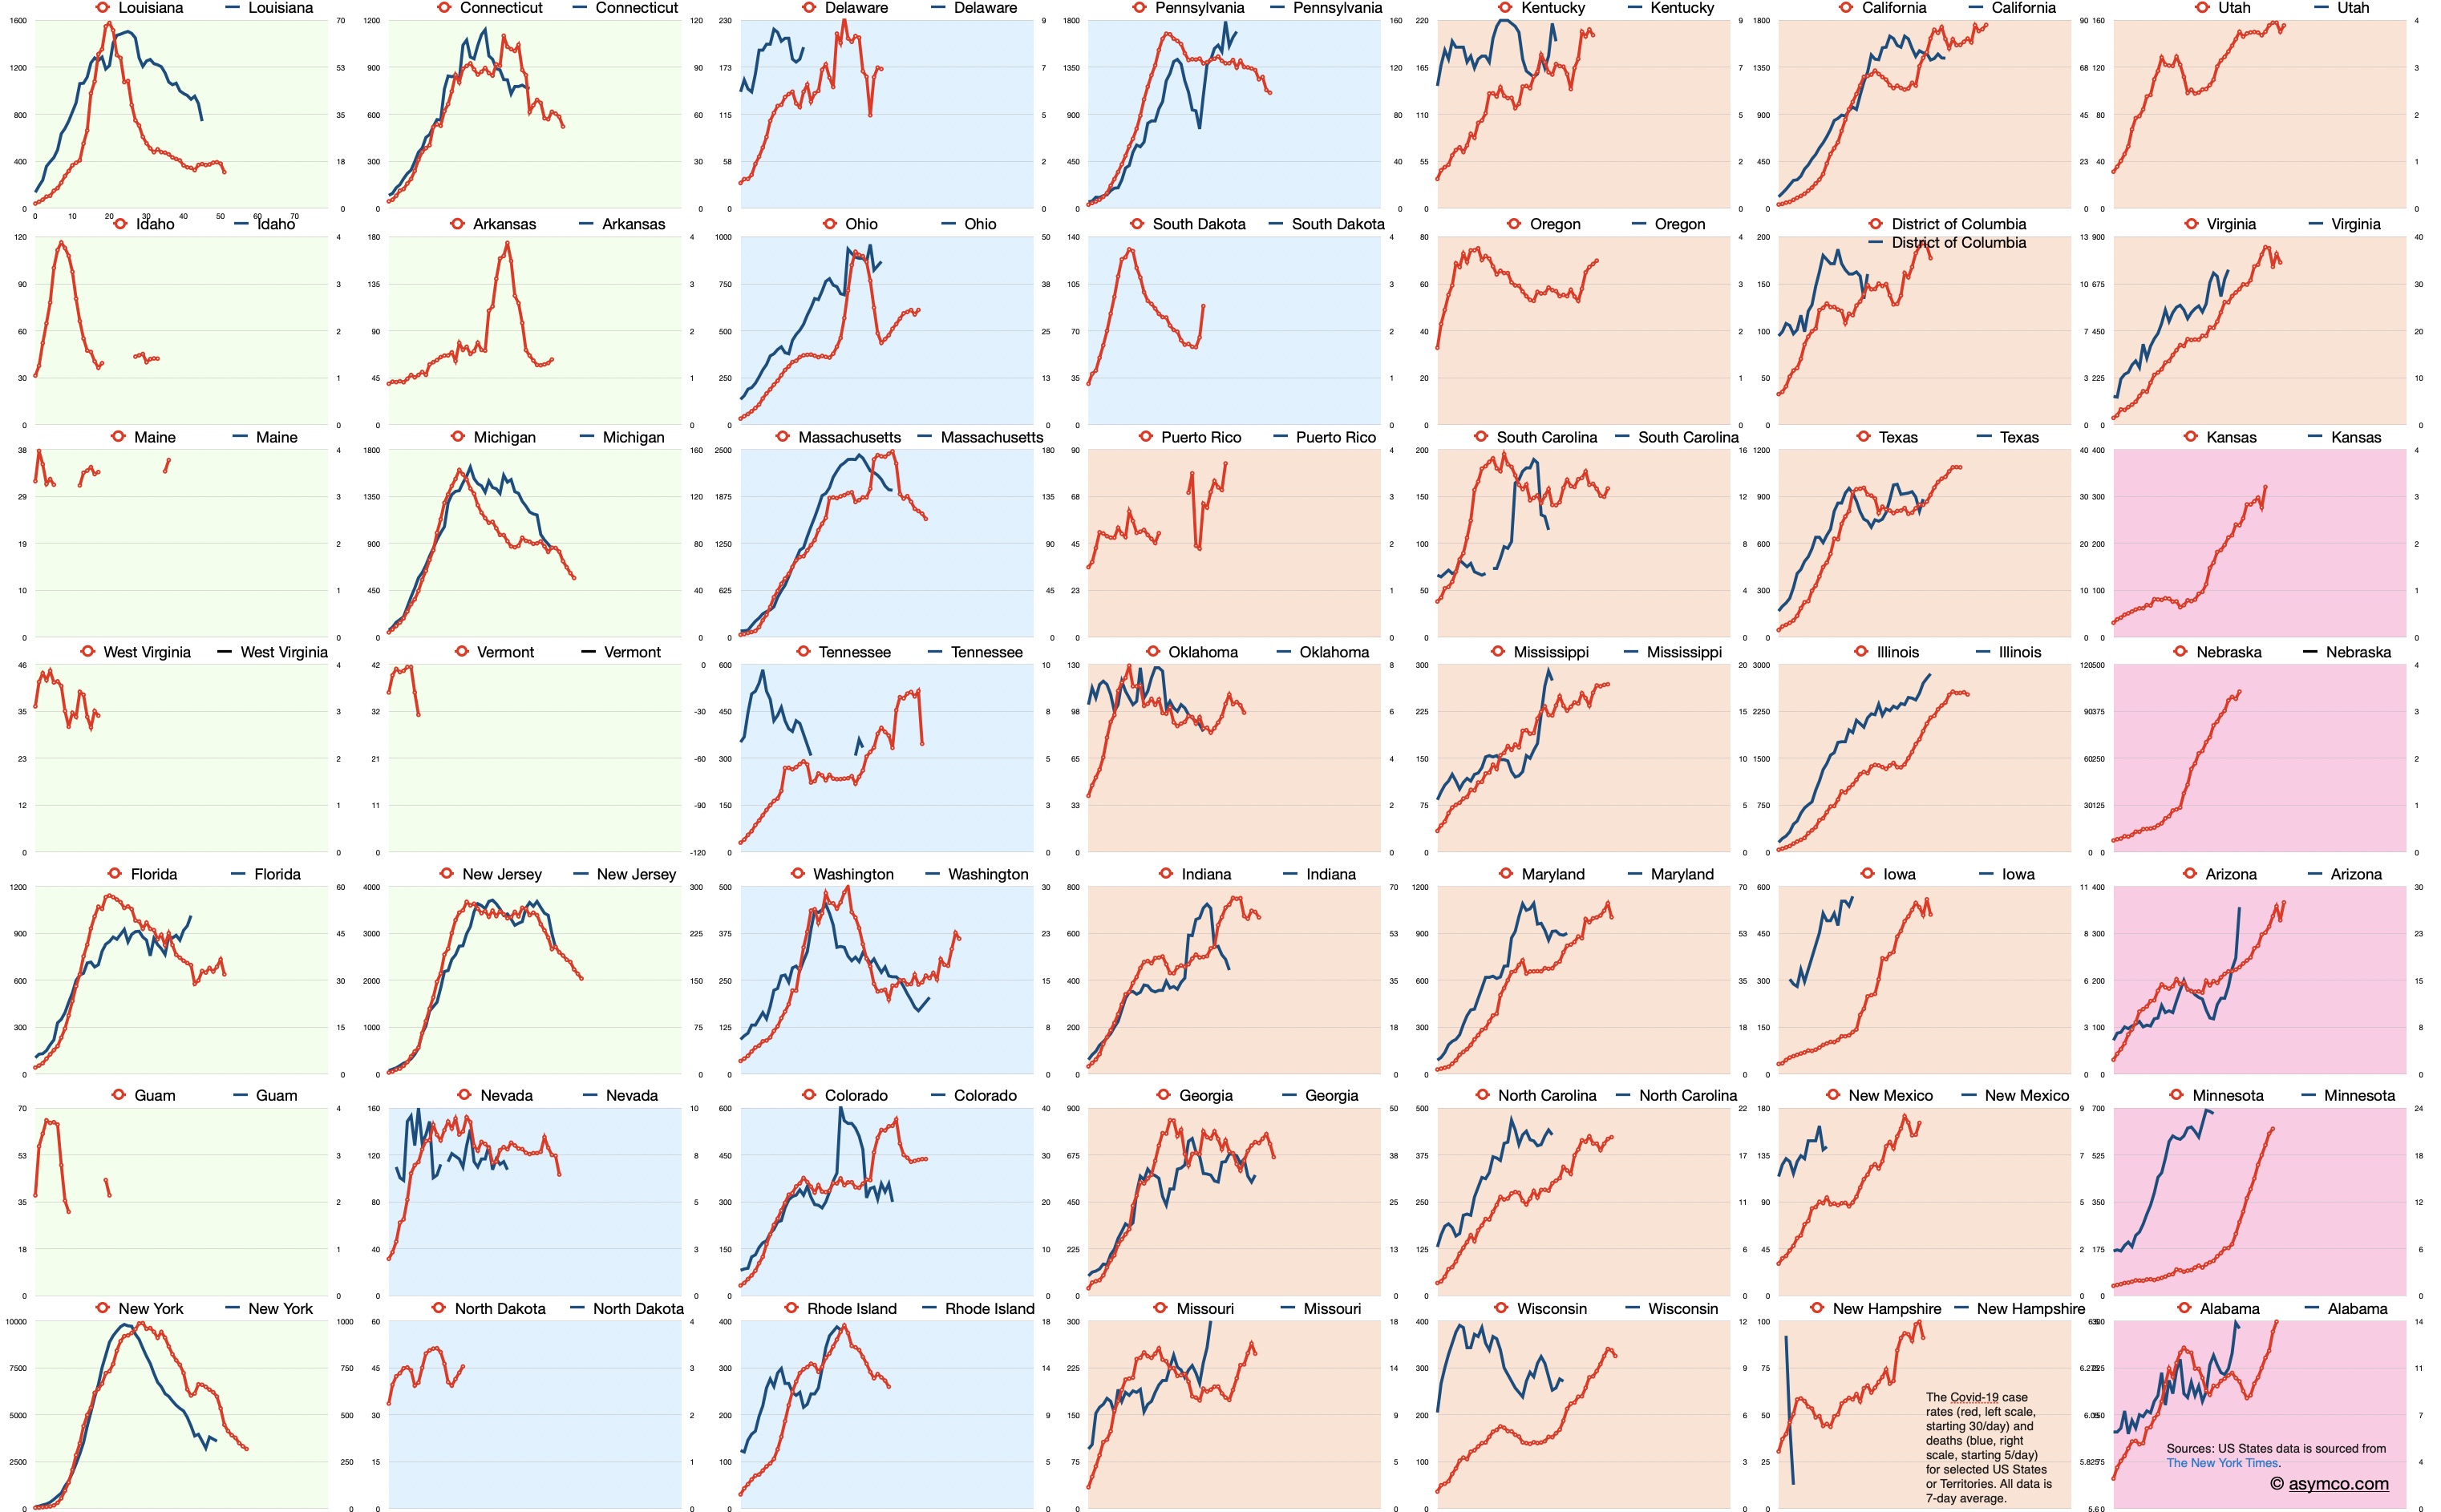
    Color coding: 

    • Green: Late Stage (>50% post-peak)
    • Blue: Middle-Late Stage (~50% post-peak)
    • Orange: Middle-Early Stage (peaked)
    • Pink: Early Stage [or indeterminate] (pre-peak)

    US States data is sourced from The New York Times.
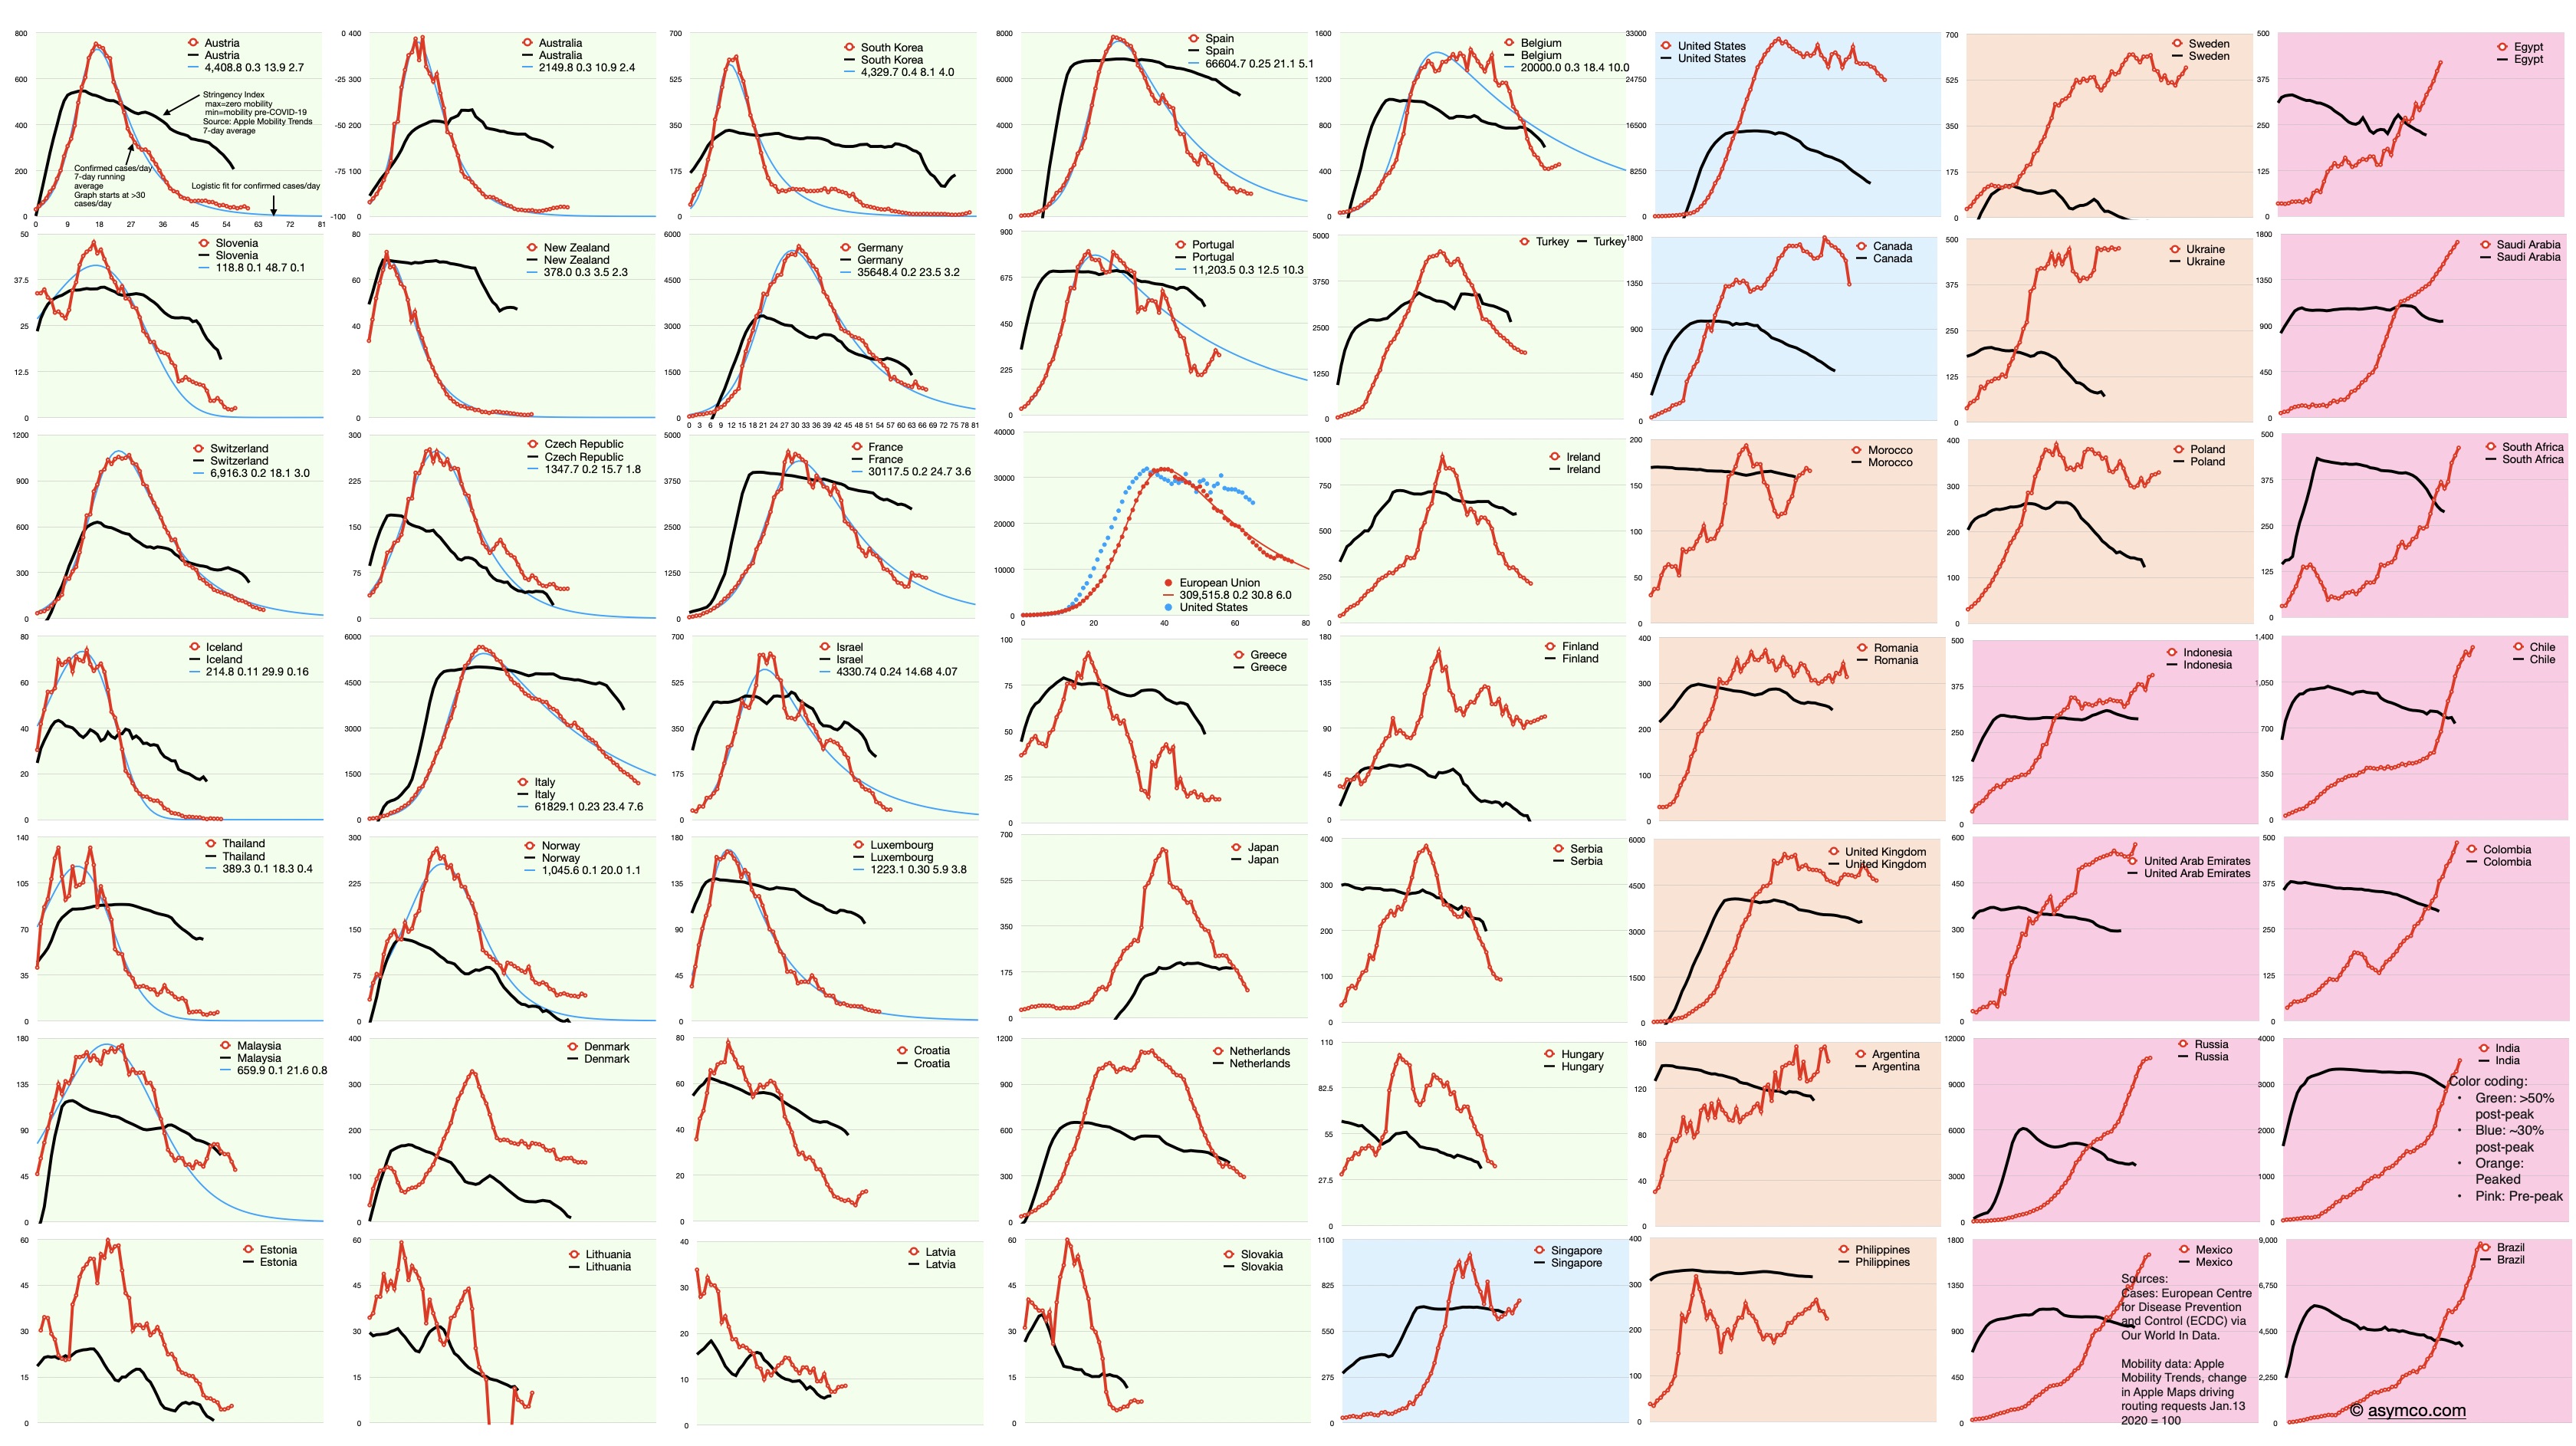
  2. Covid-19 International Dashboard May 11; 25% Pink

    Research

    Join us for another #AsymcoFridayNight this Friday to discuss these latest developments and news from the markets.

    Sign up here: https://vito.community/events/asymco-friday-night-fever

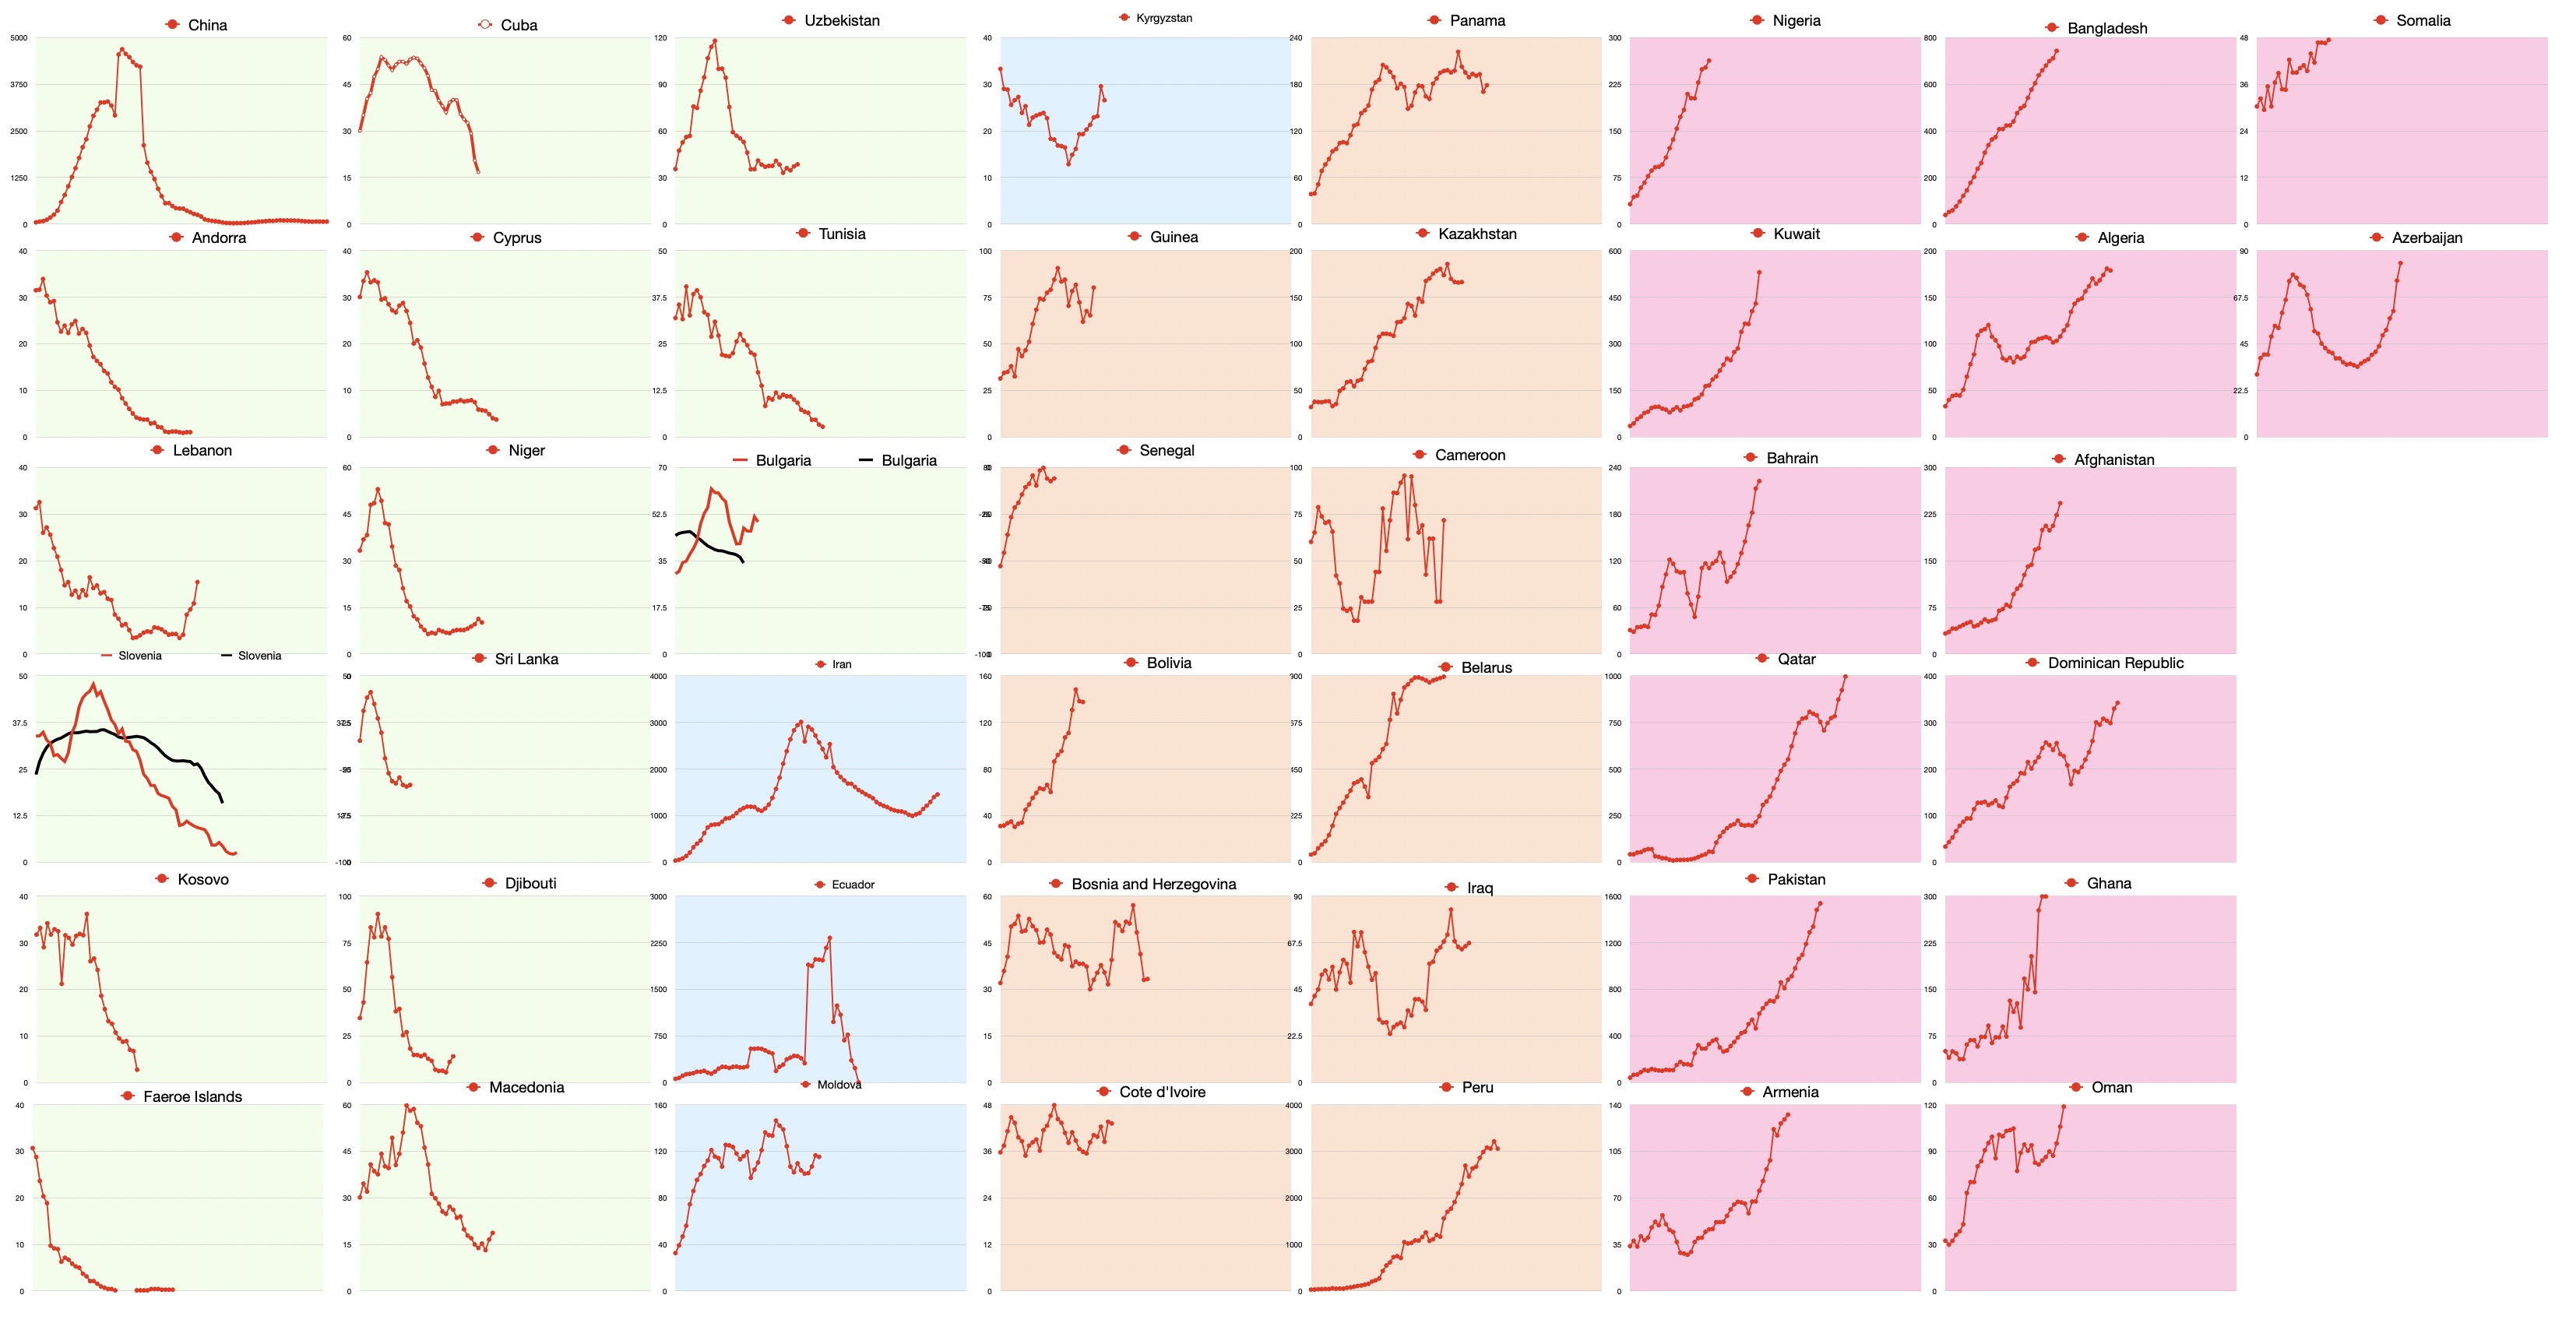
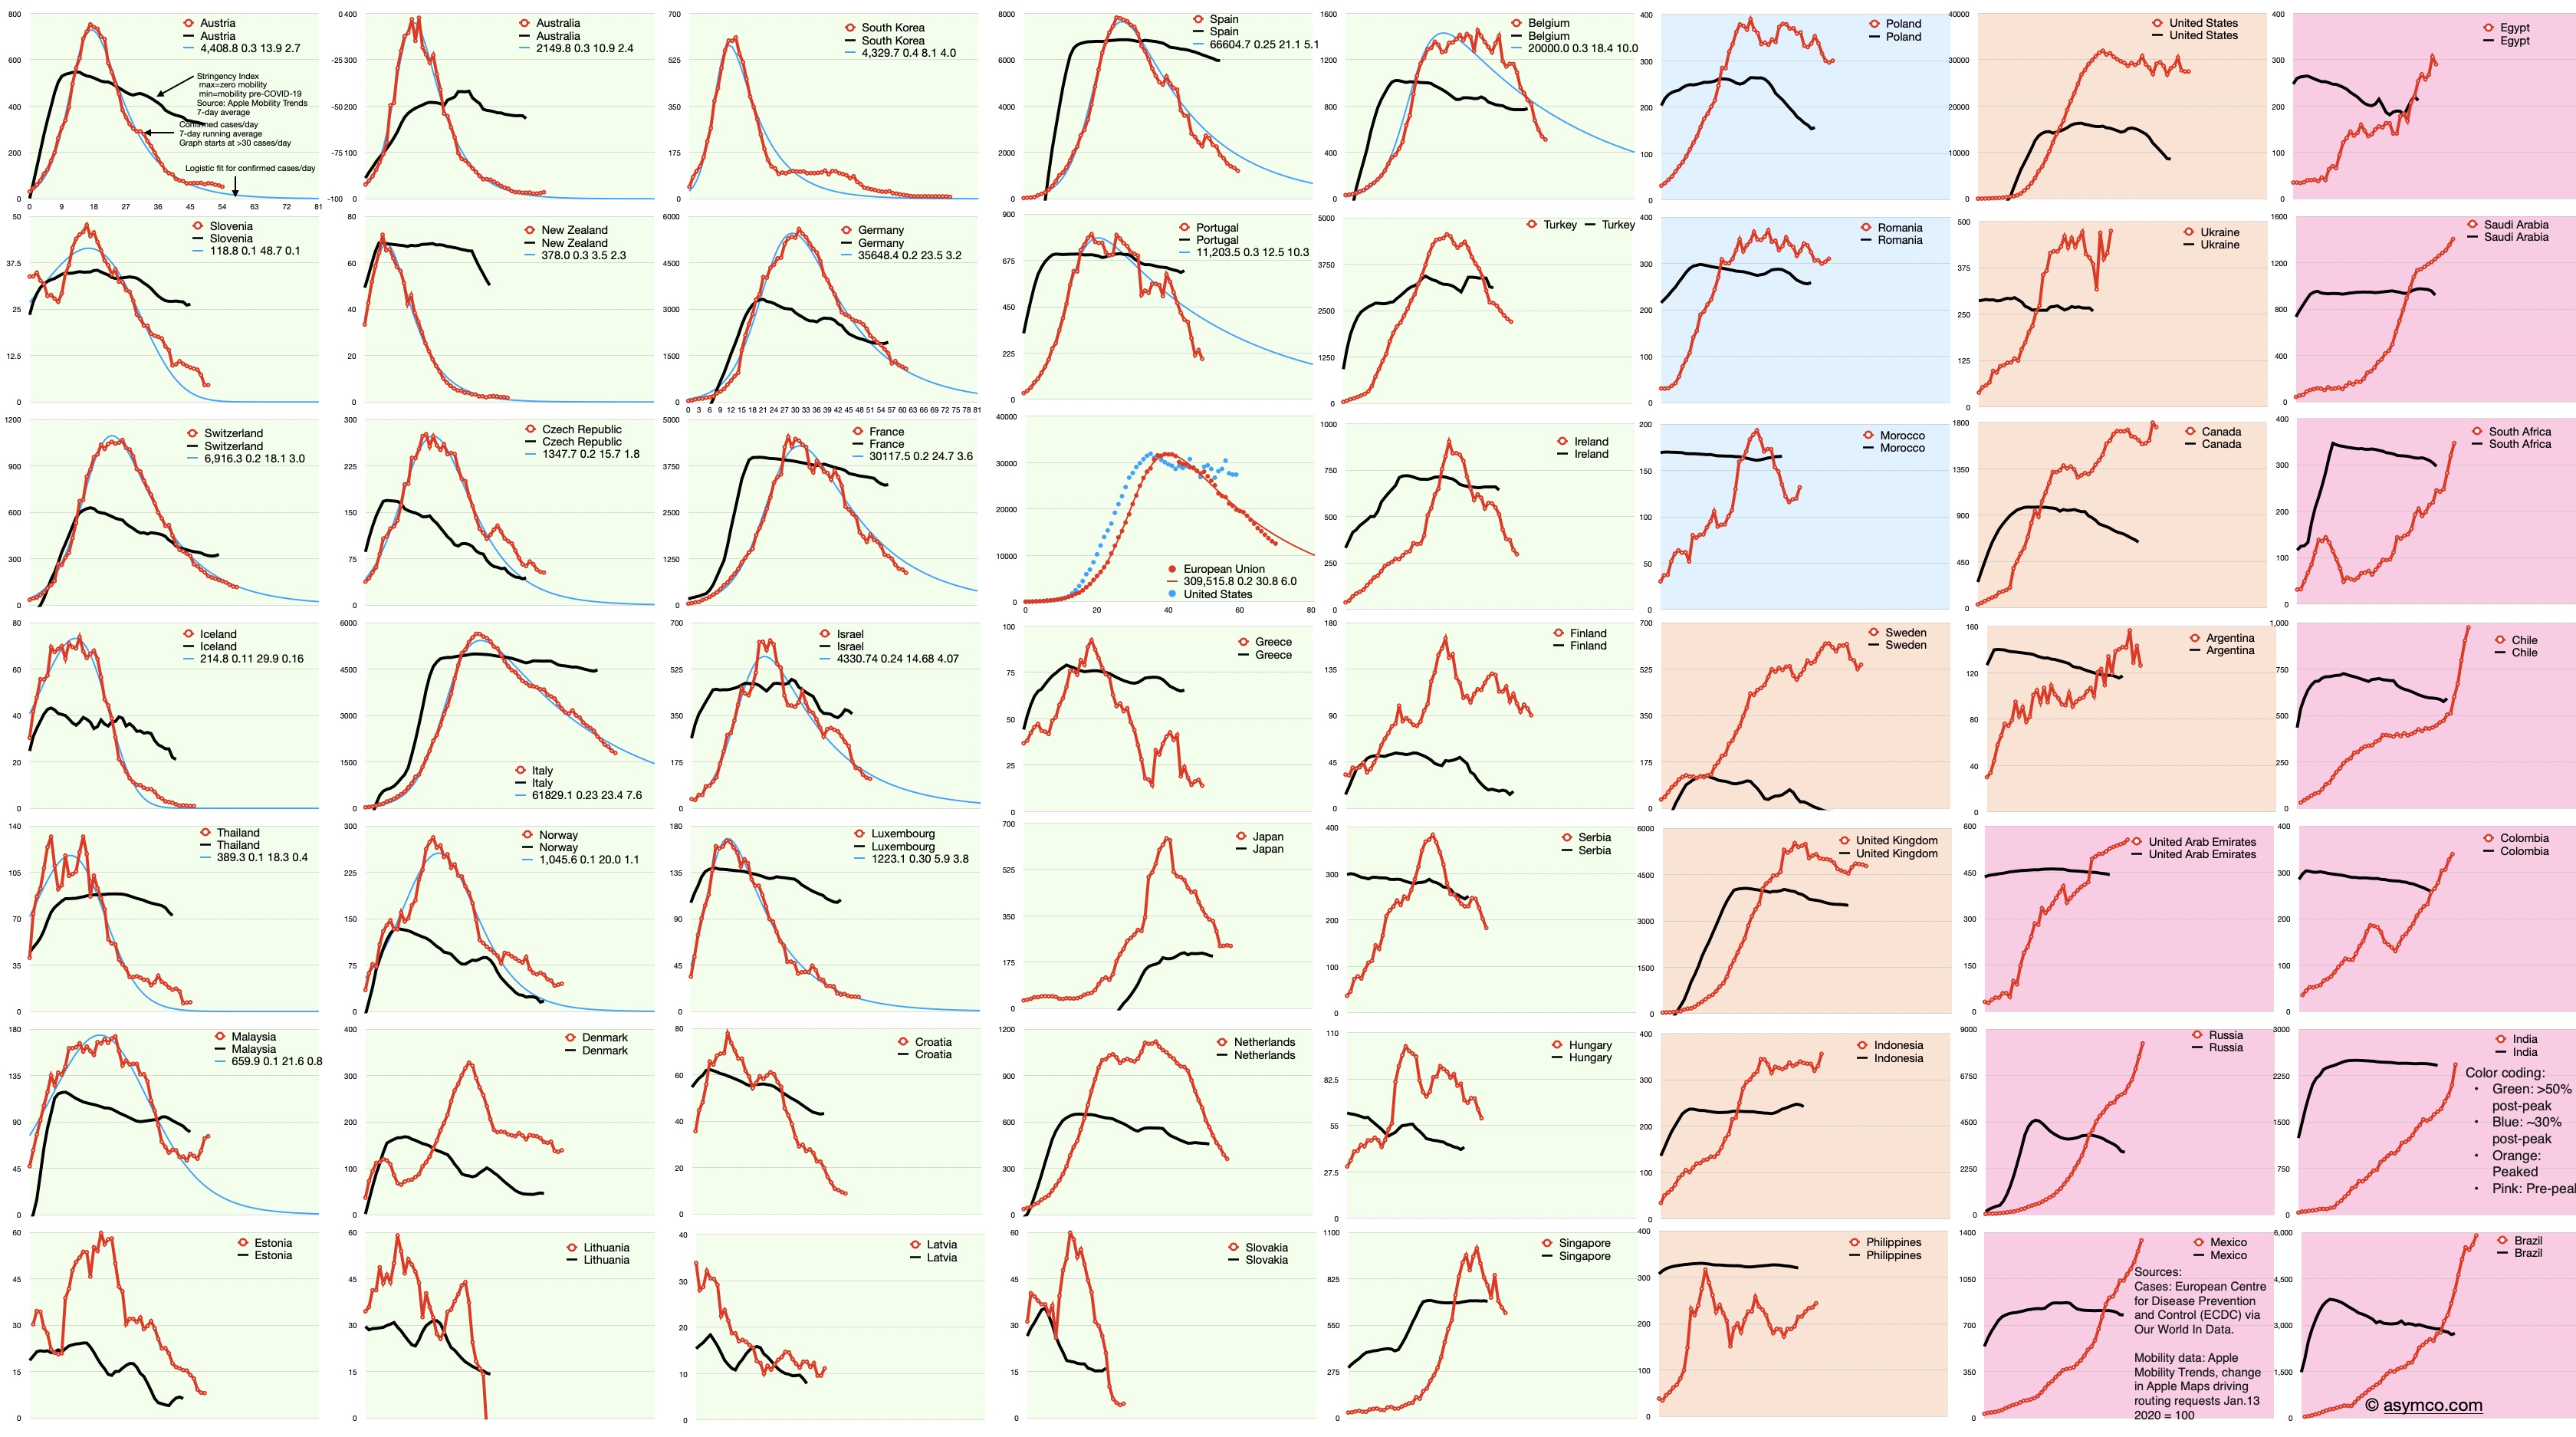
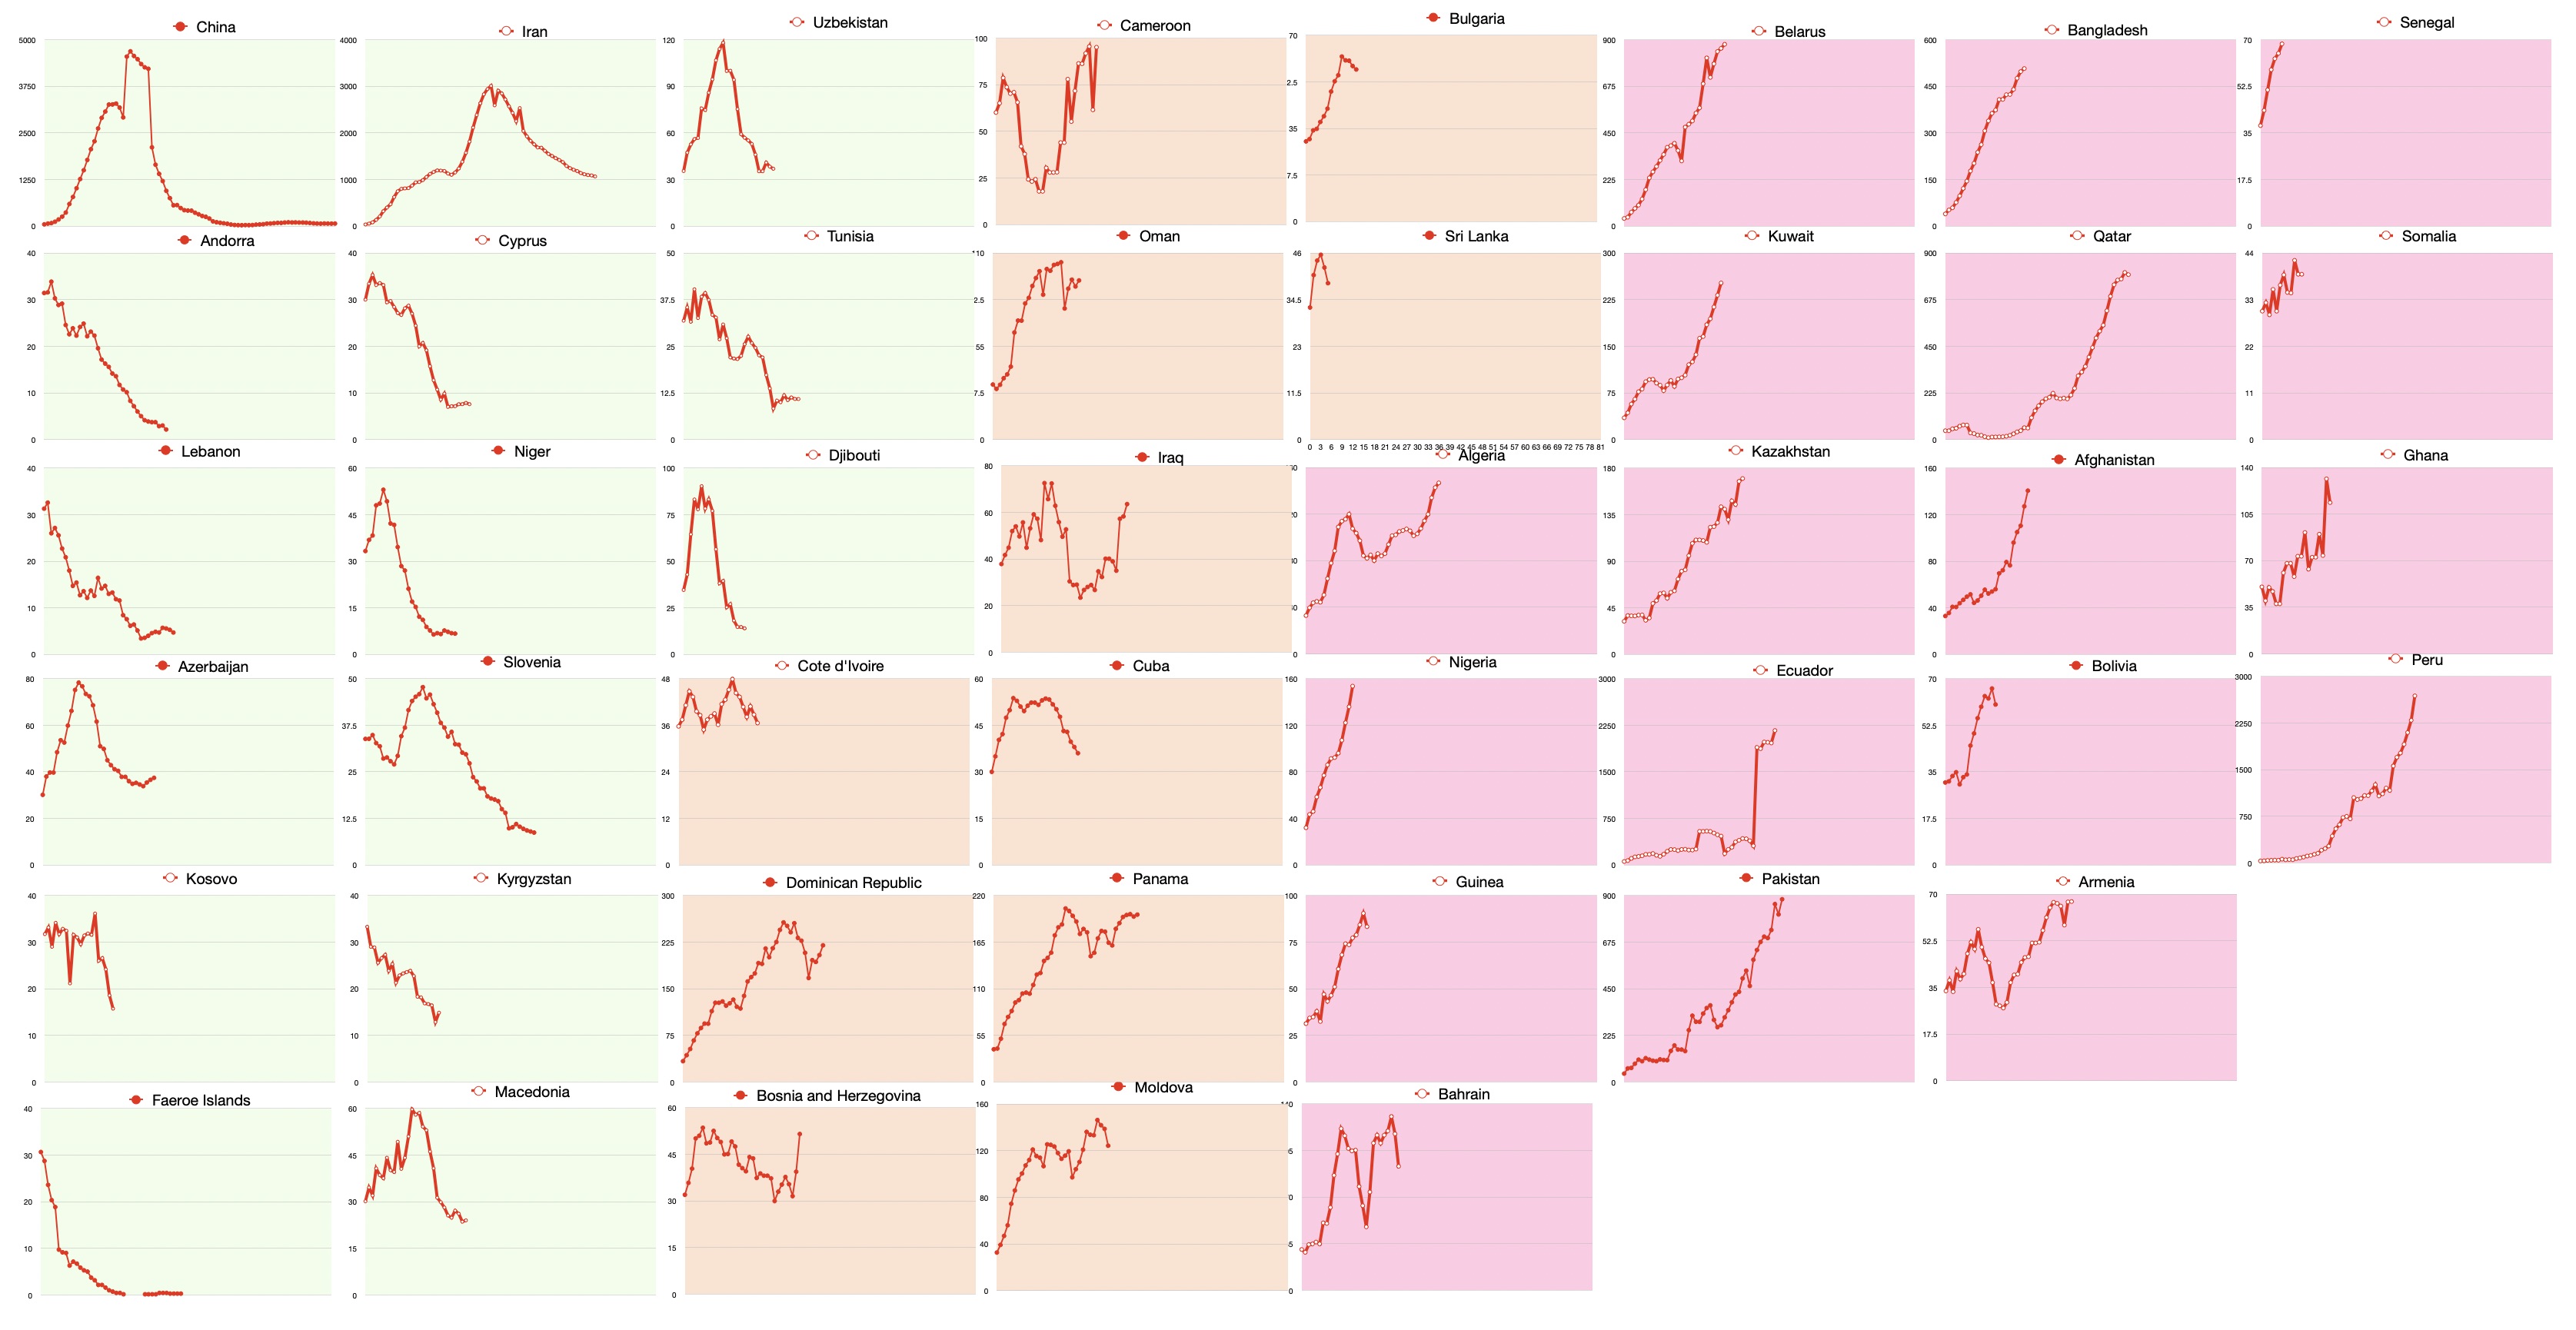
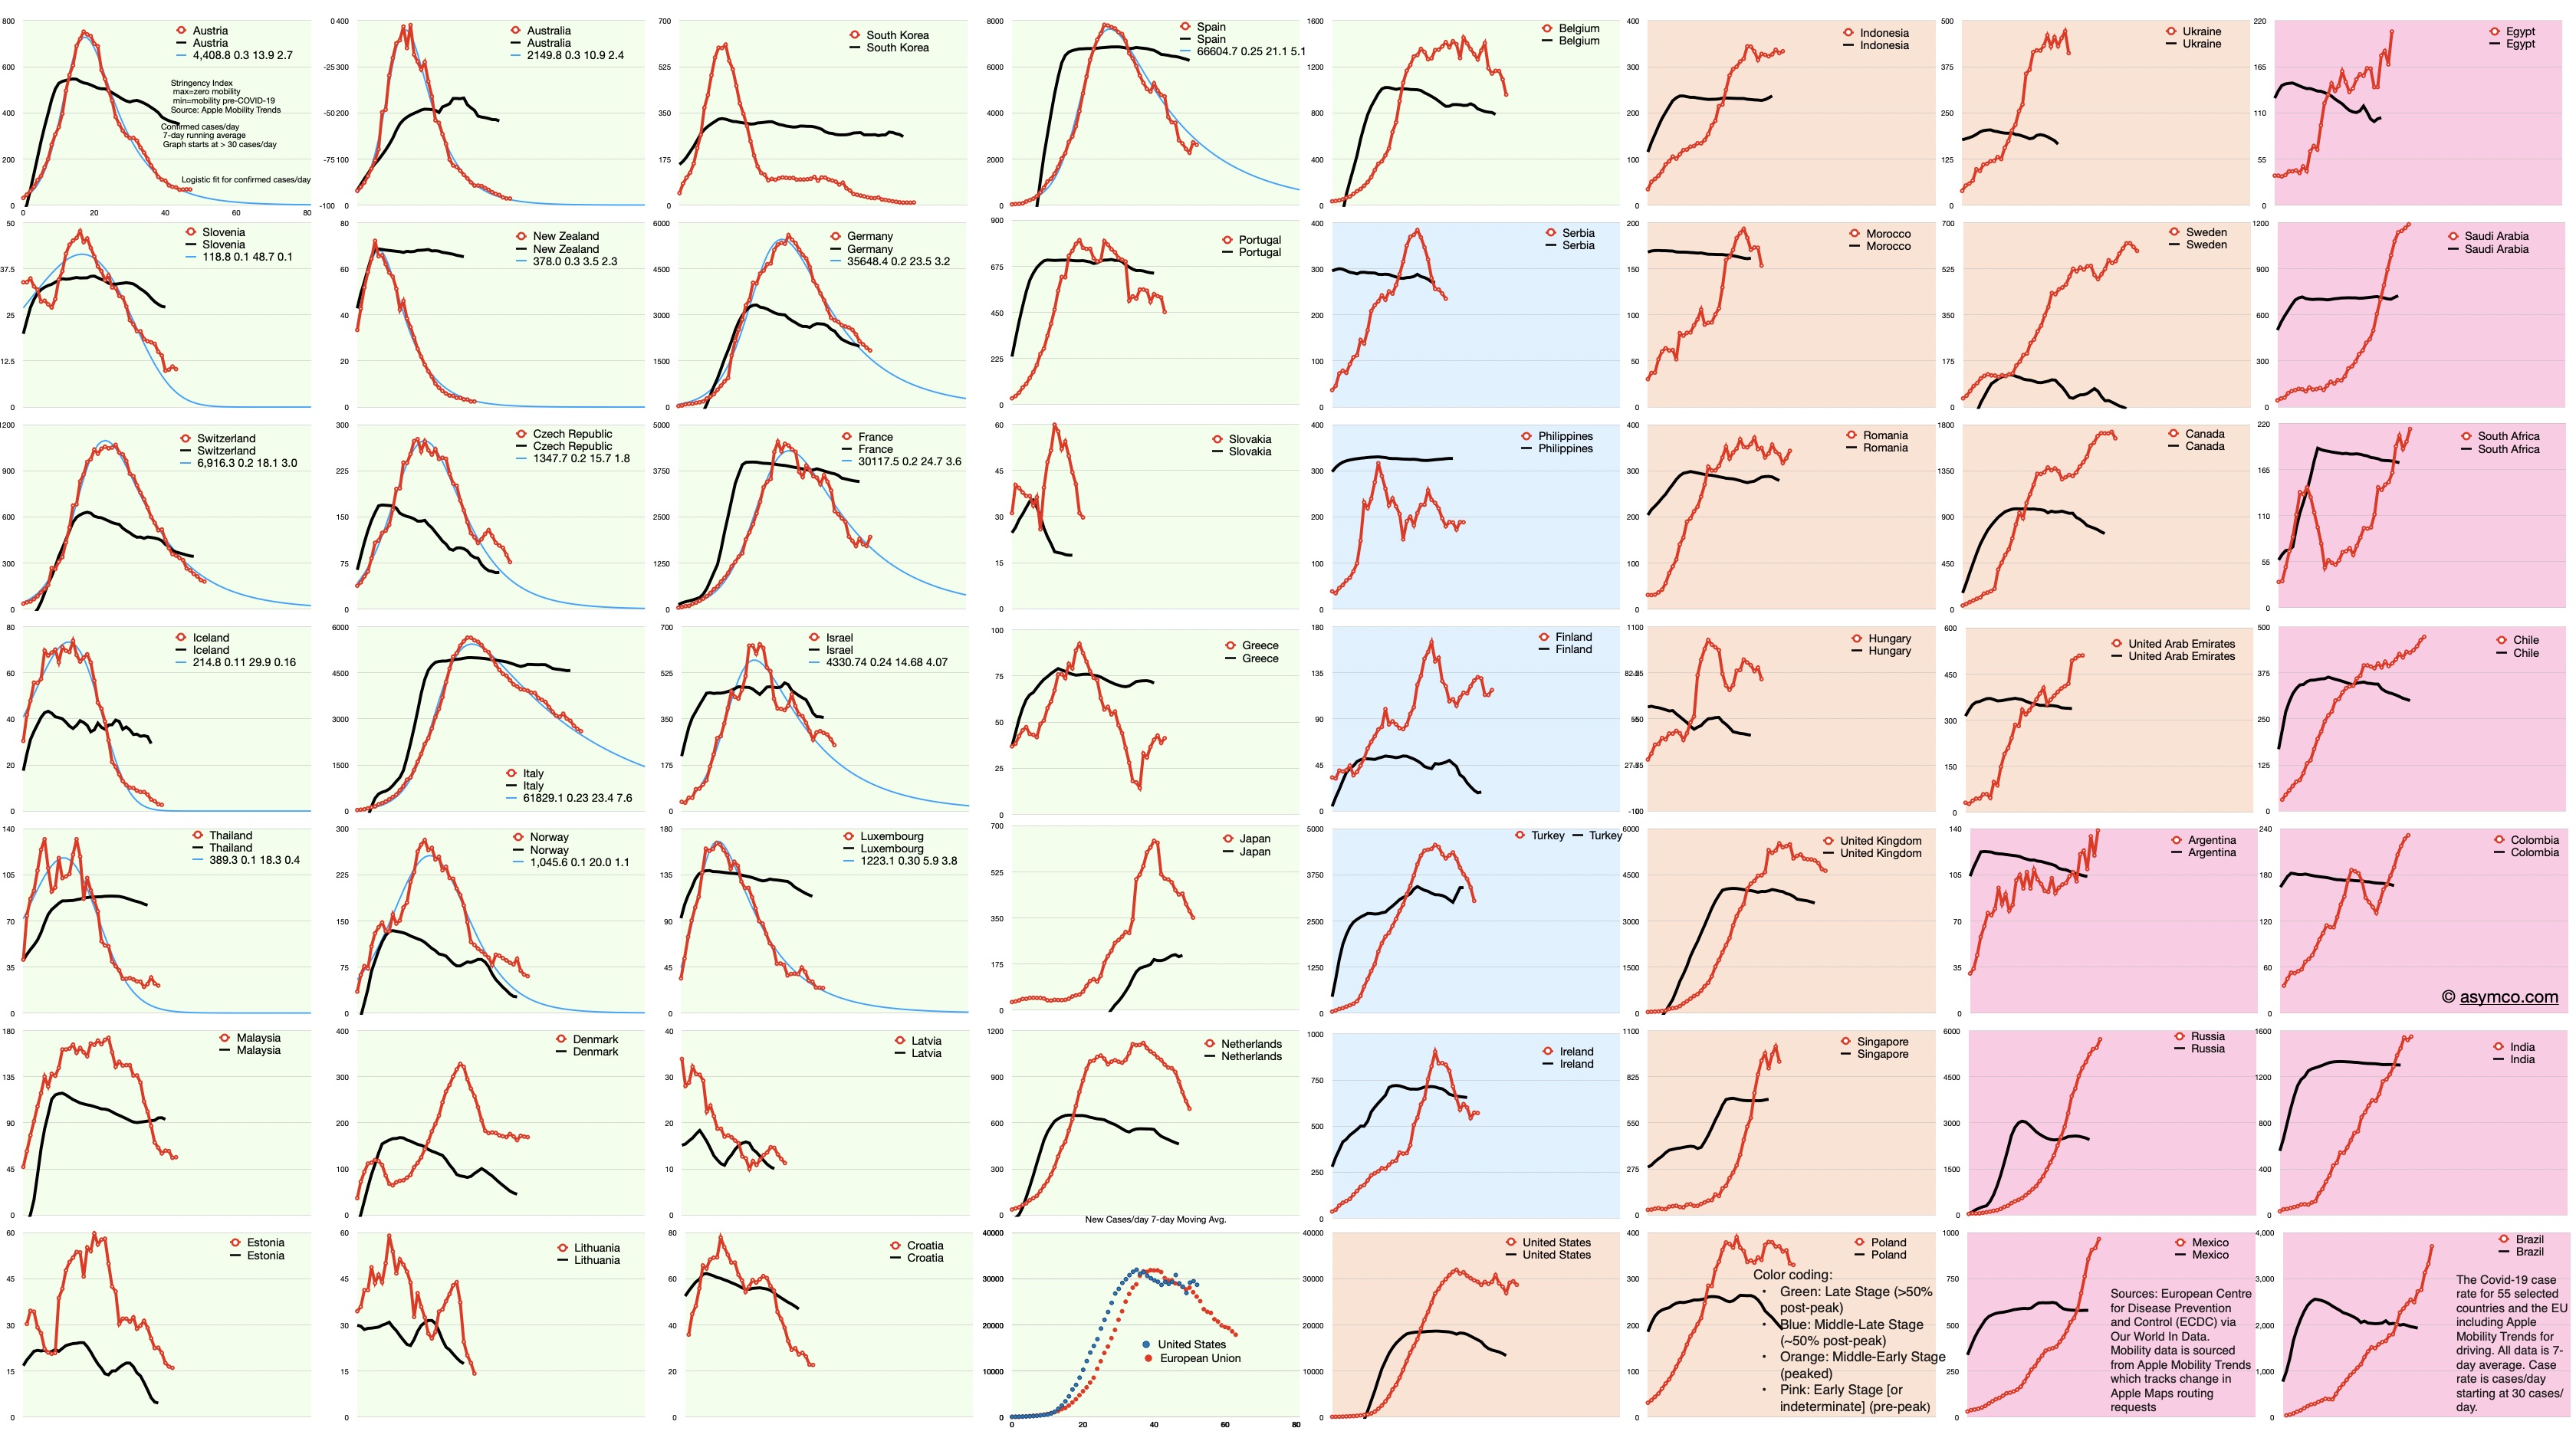
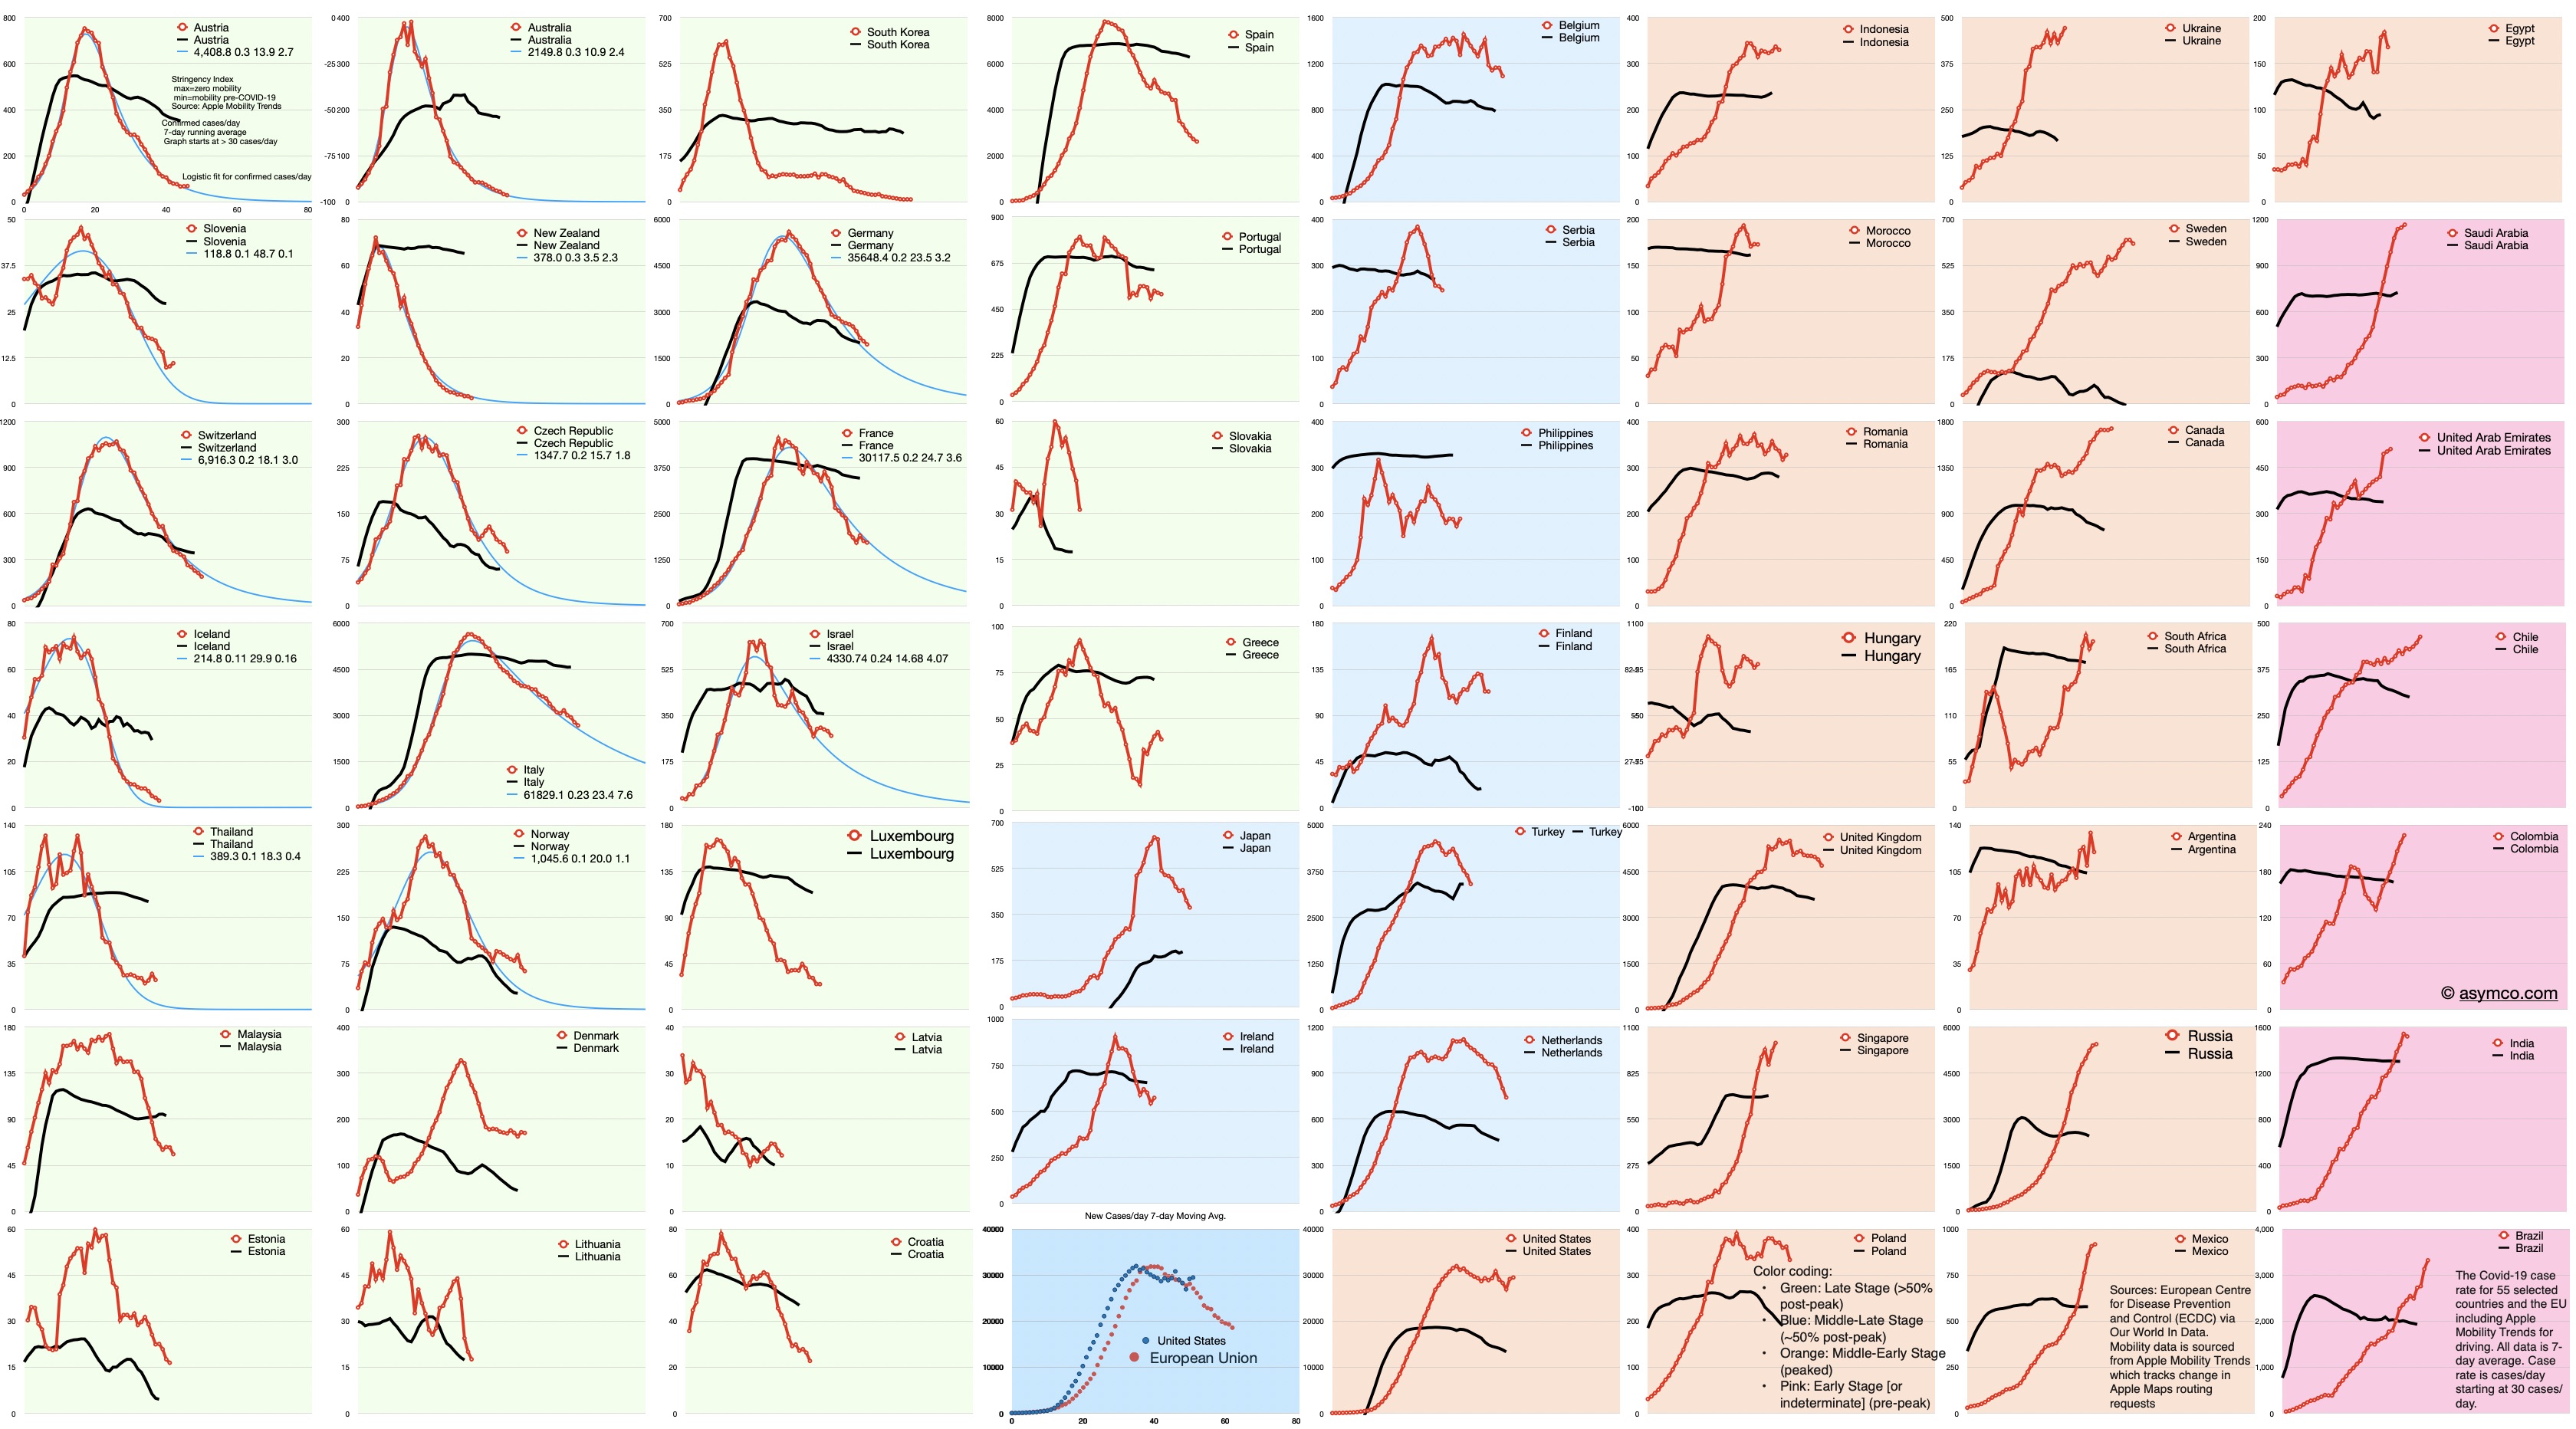
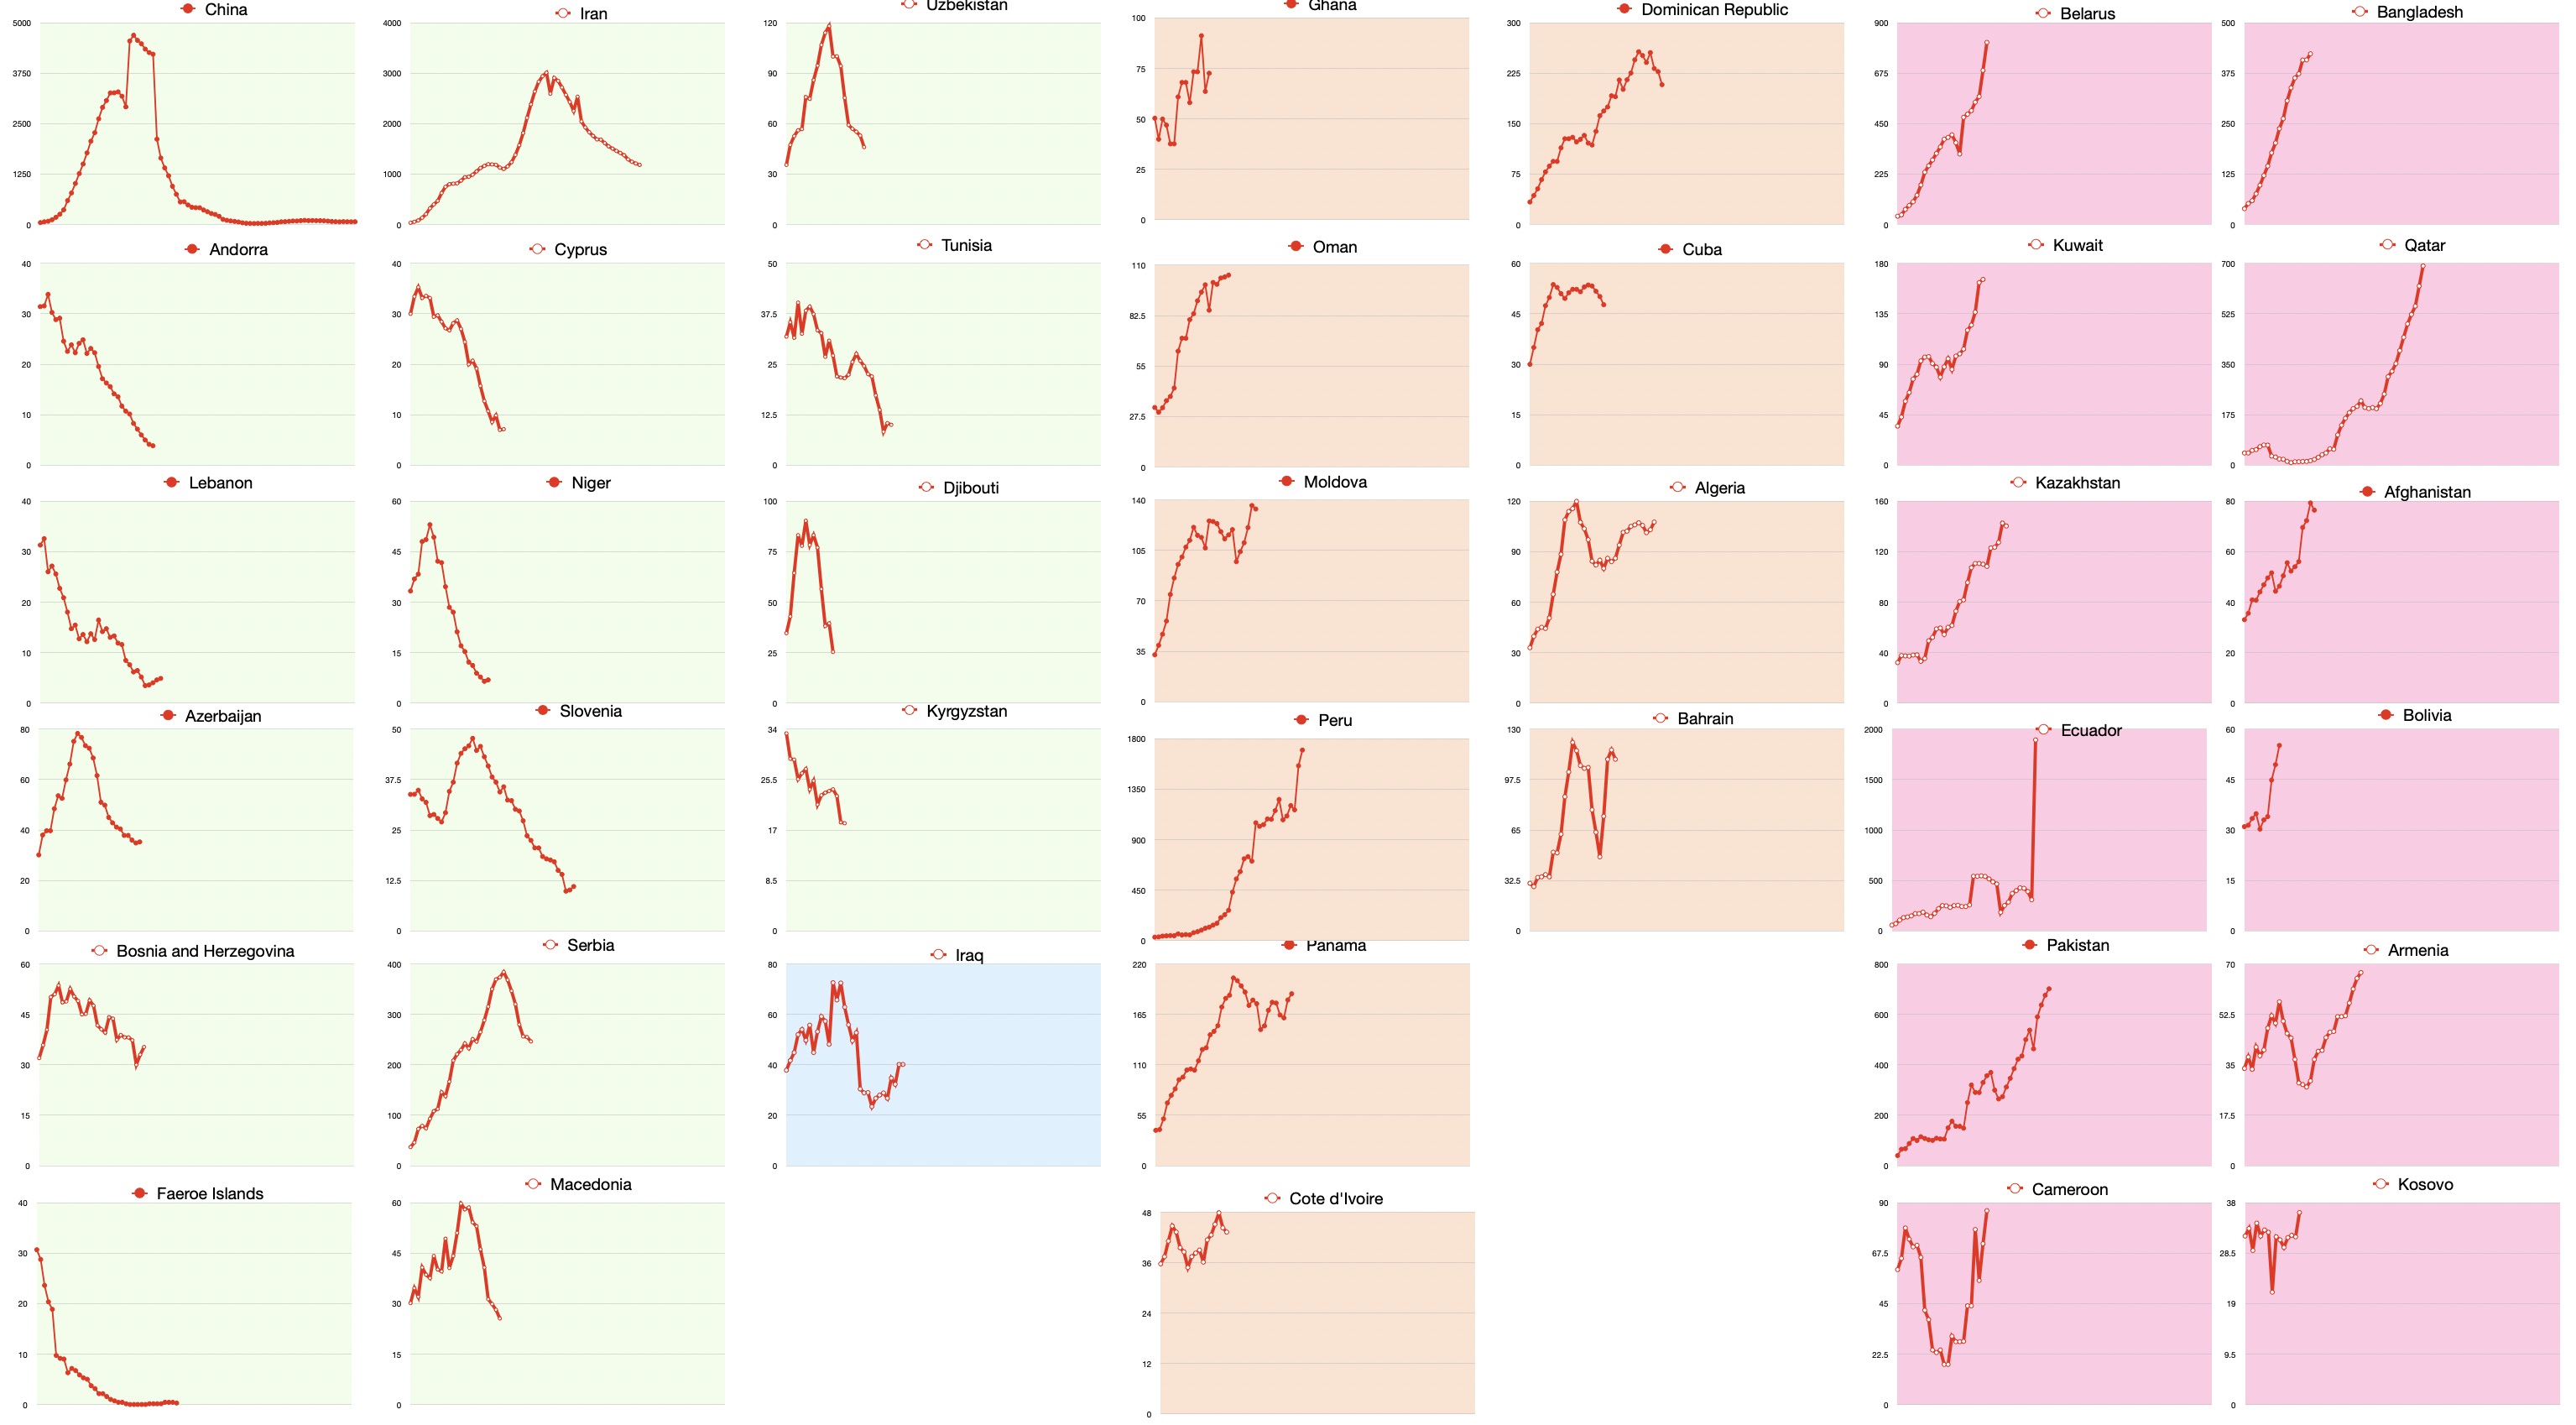
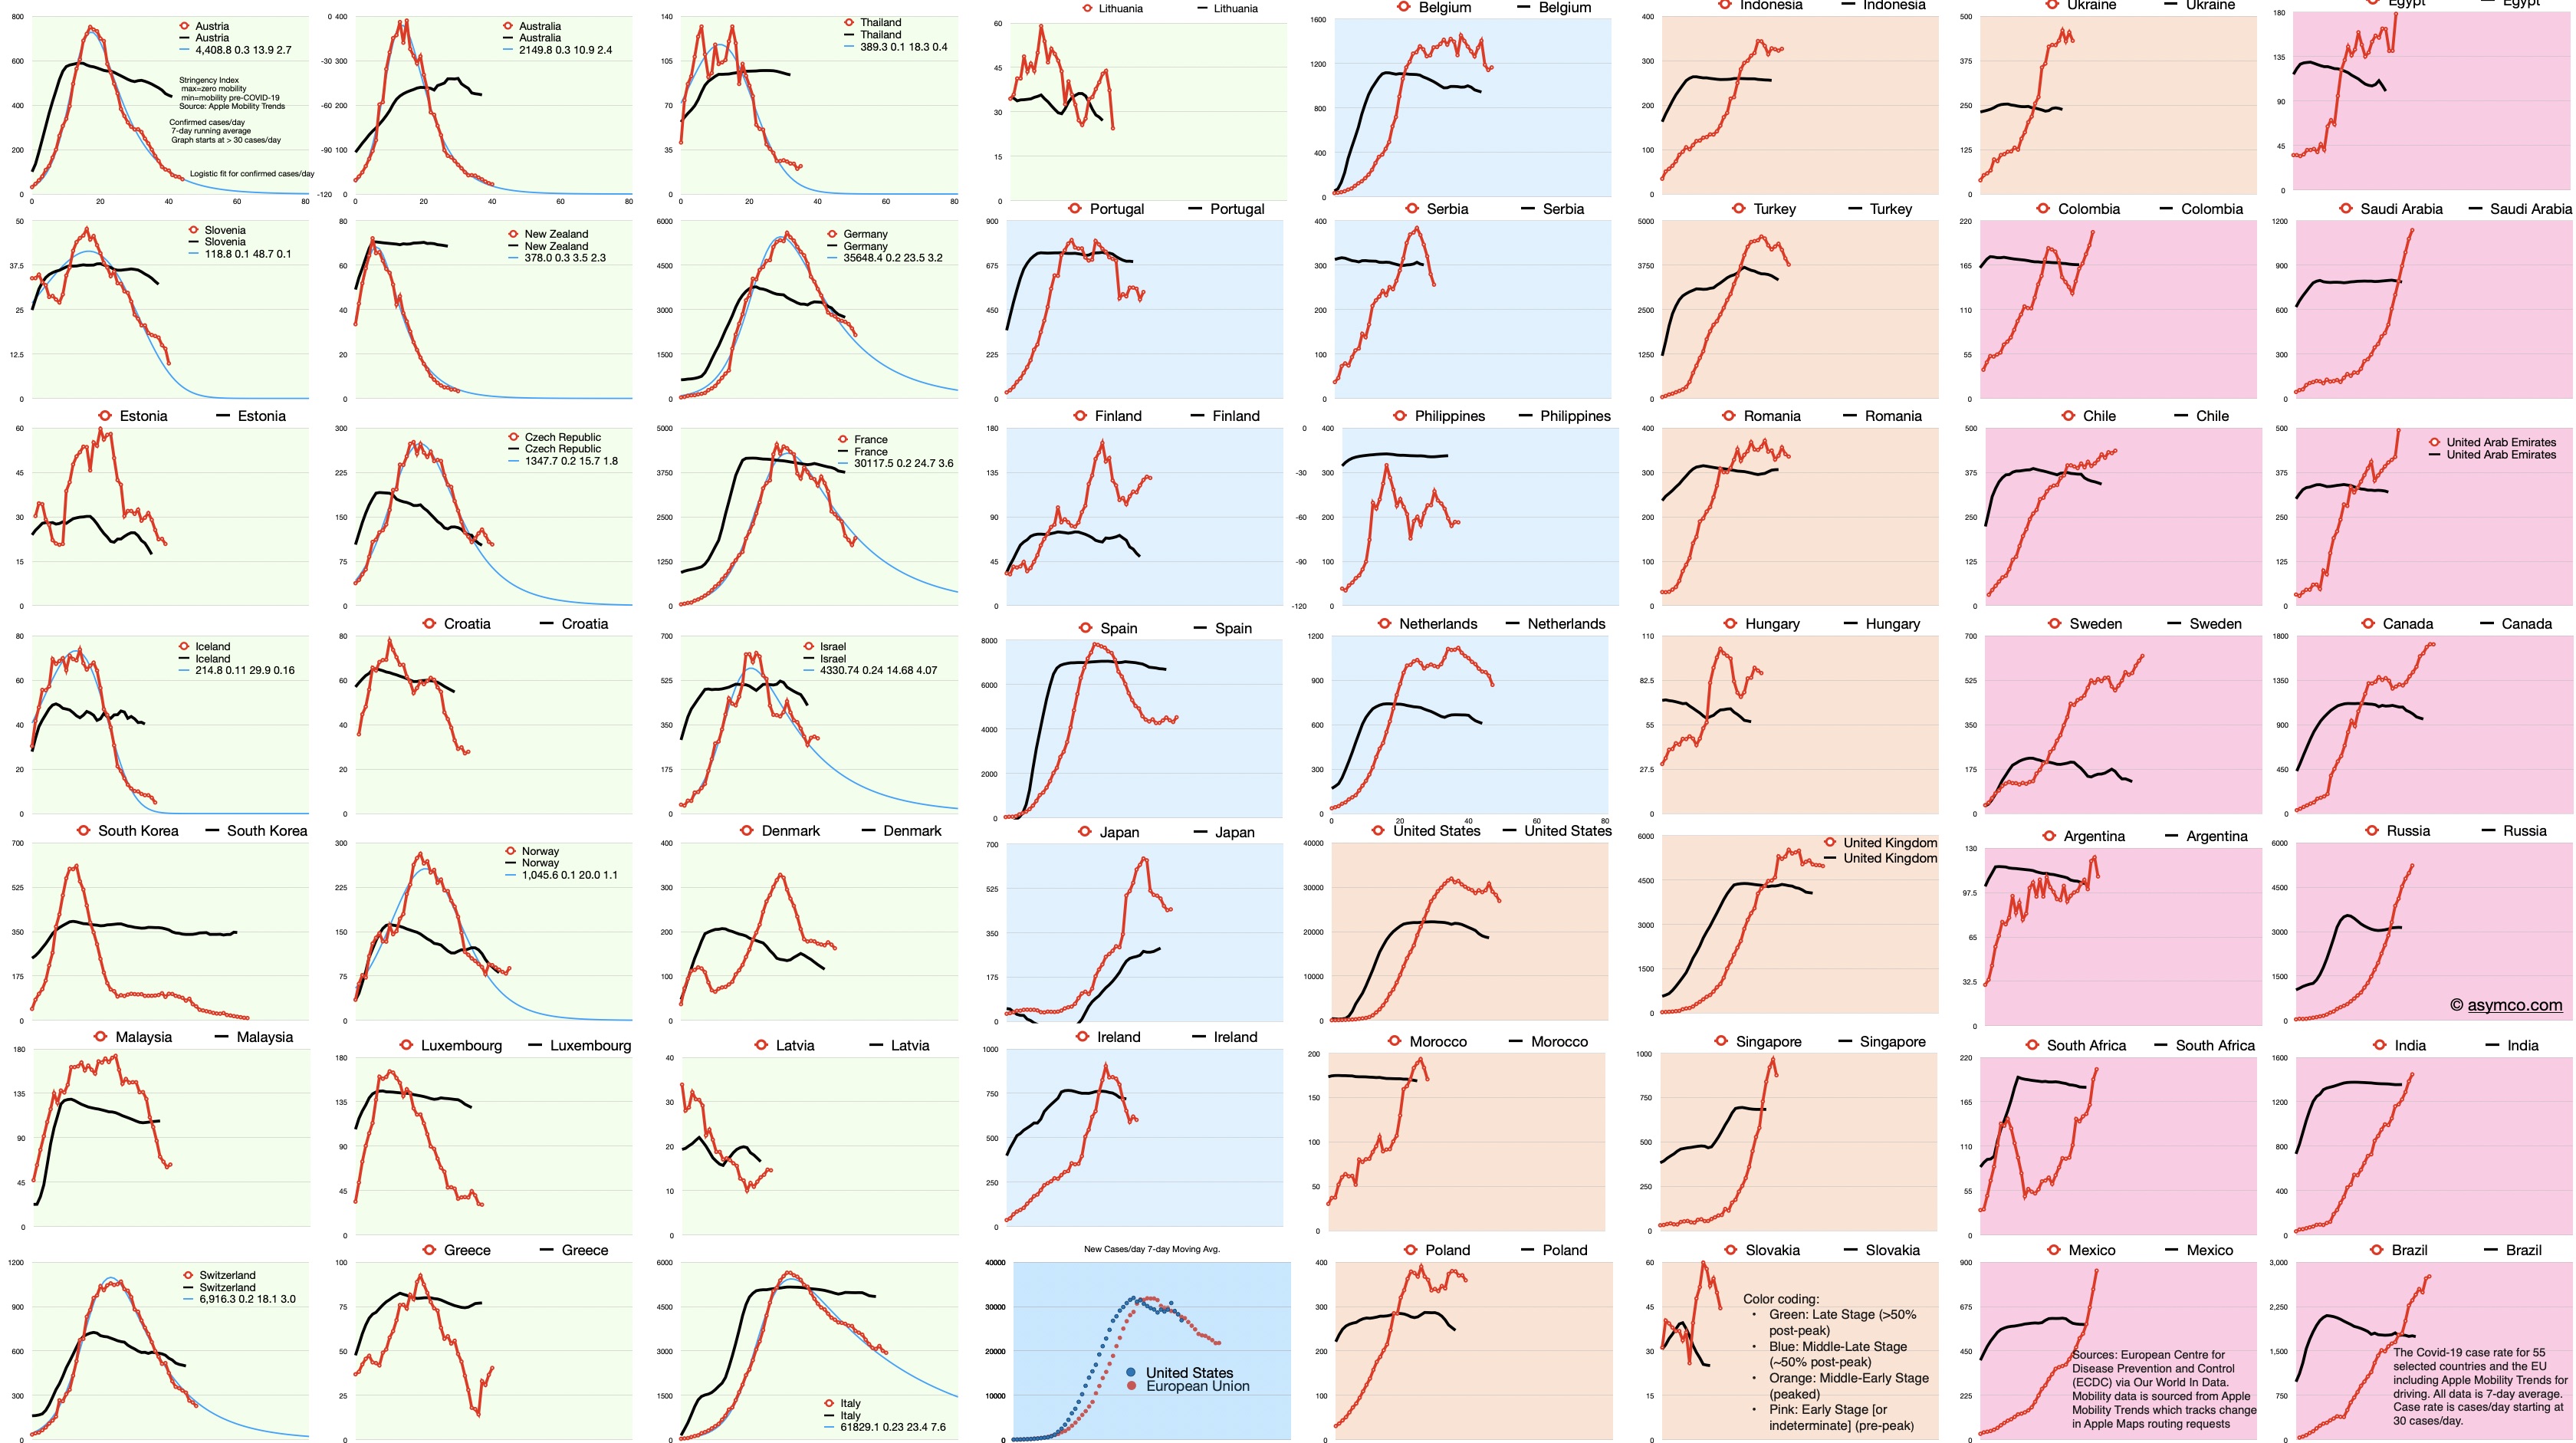
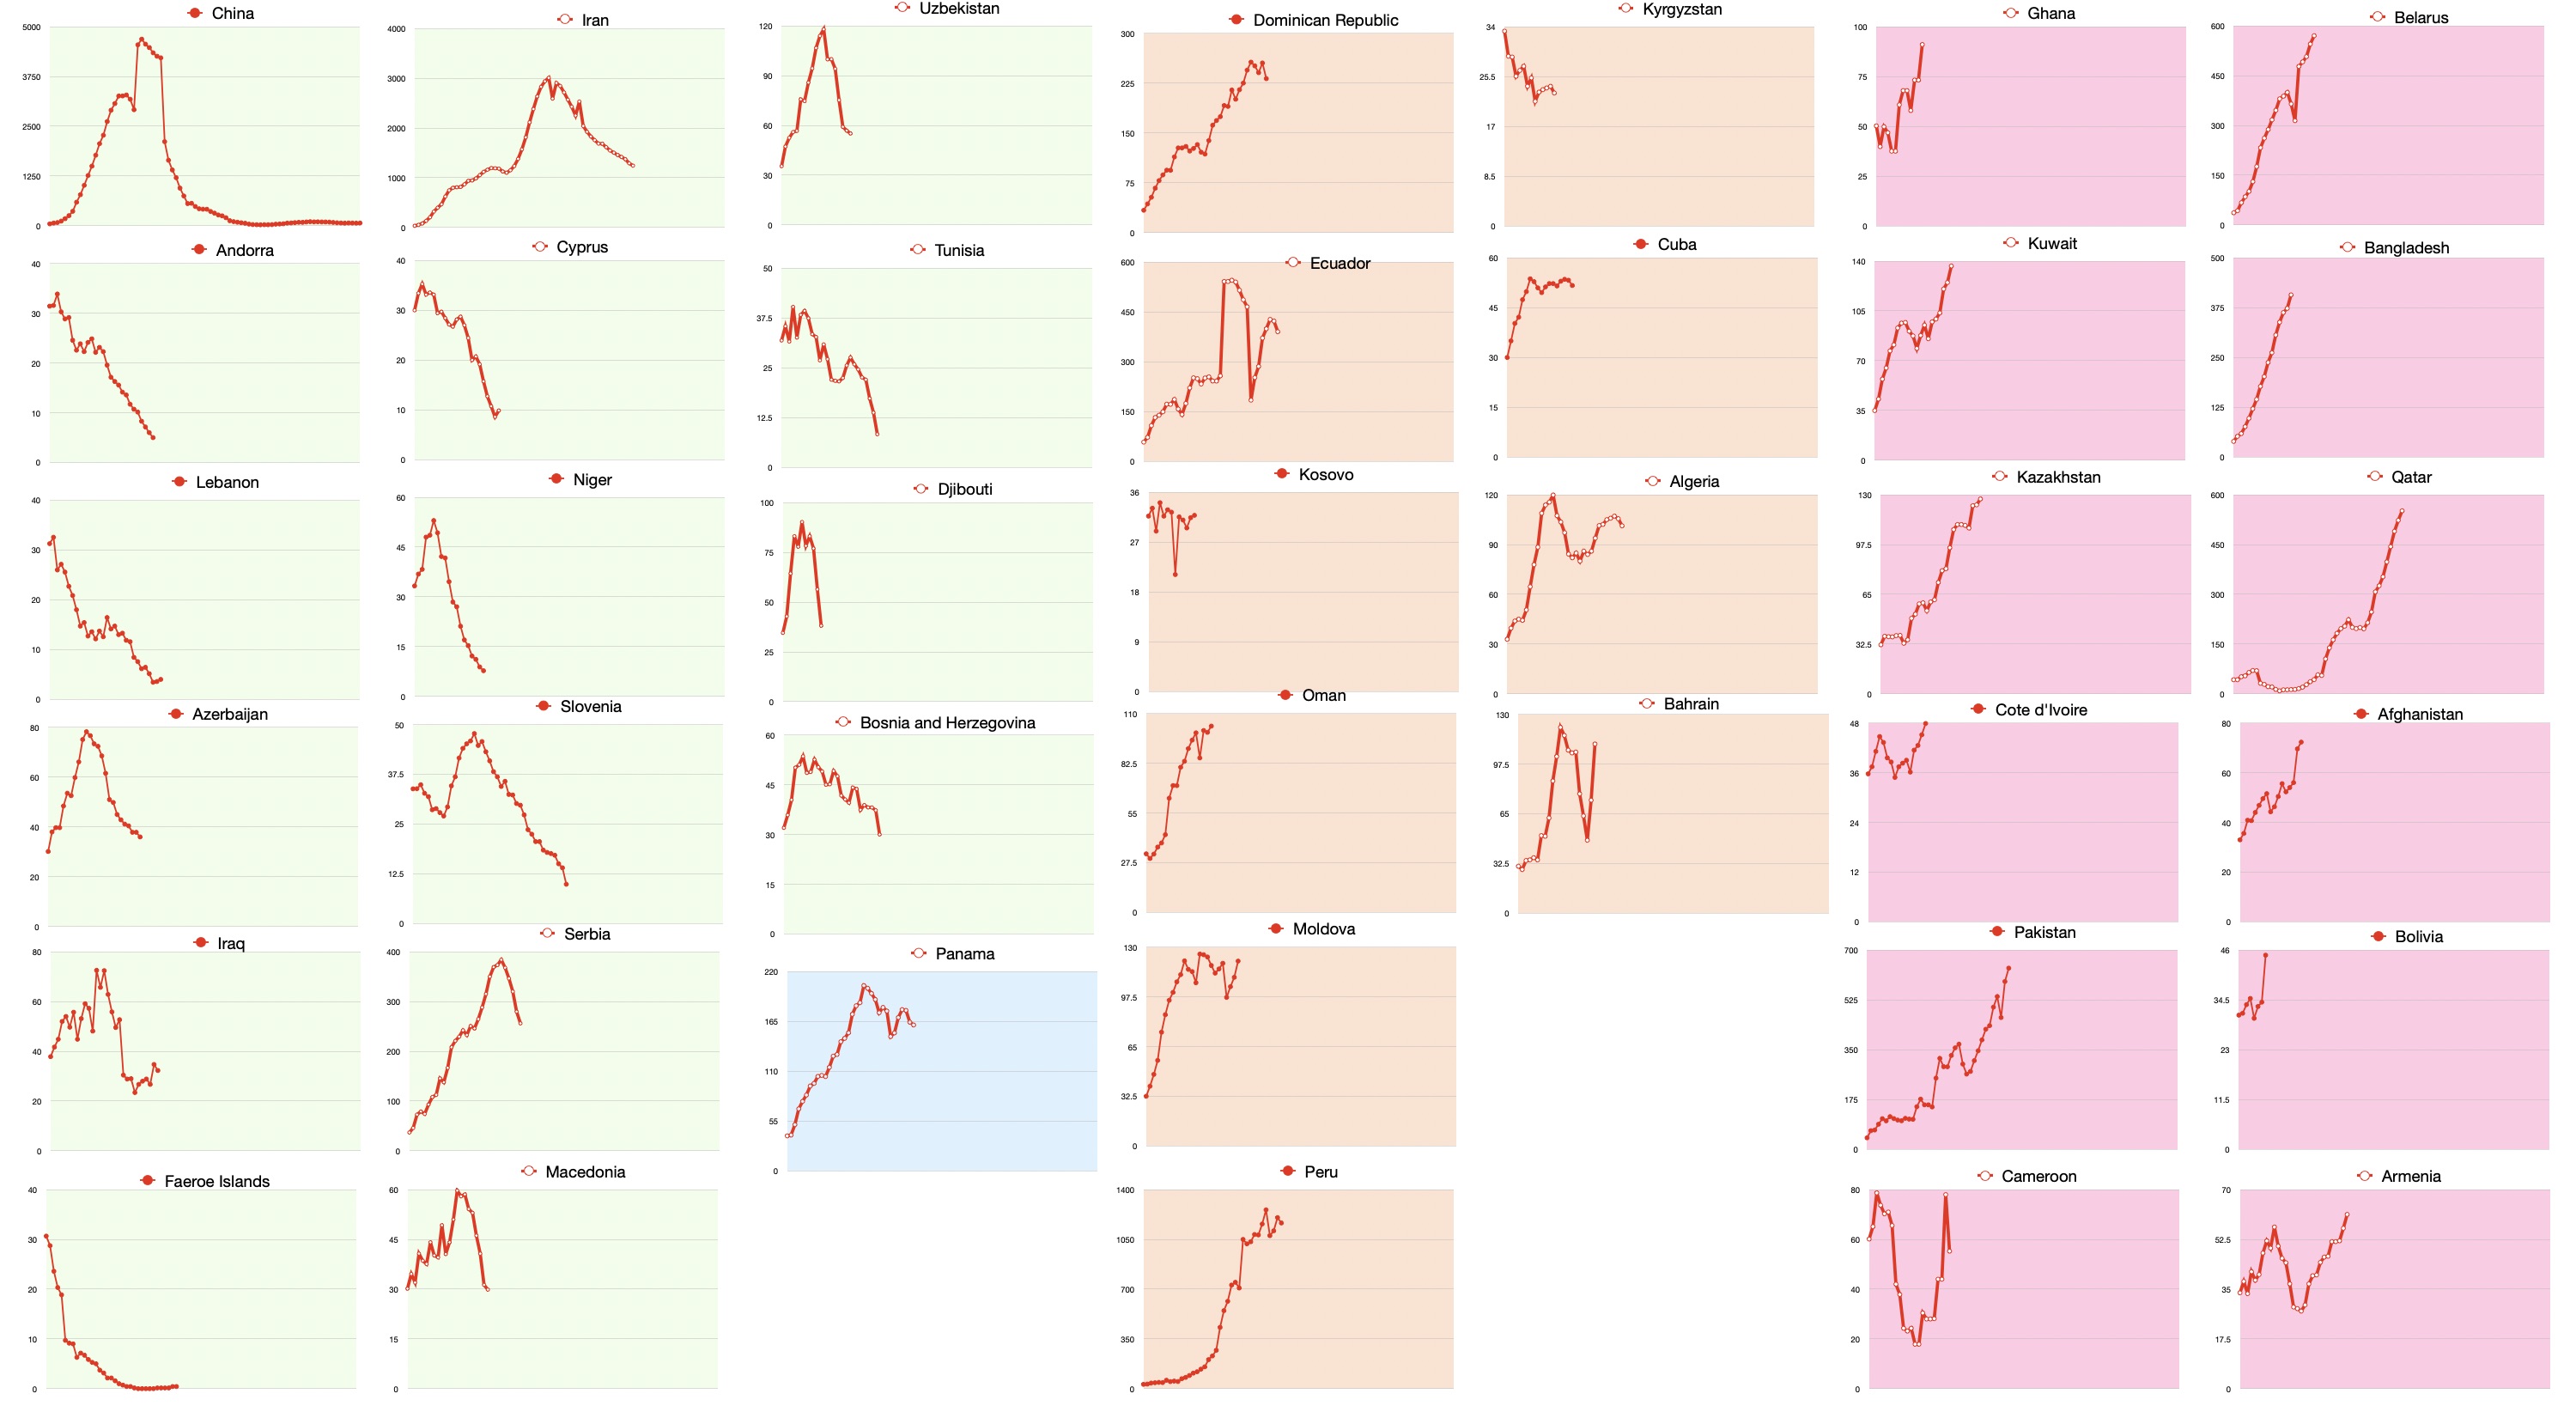
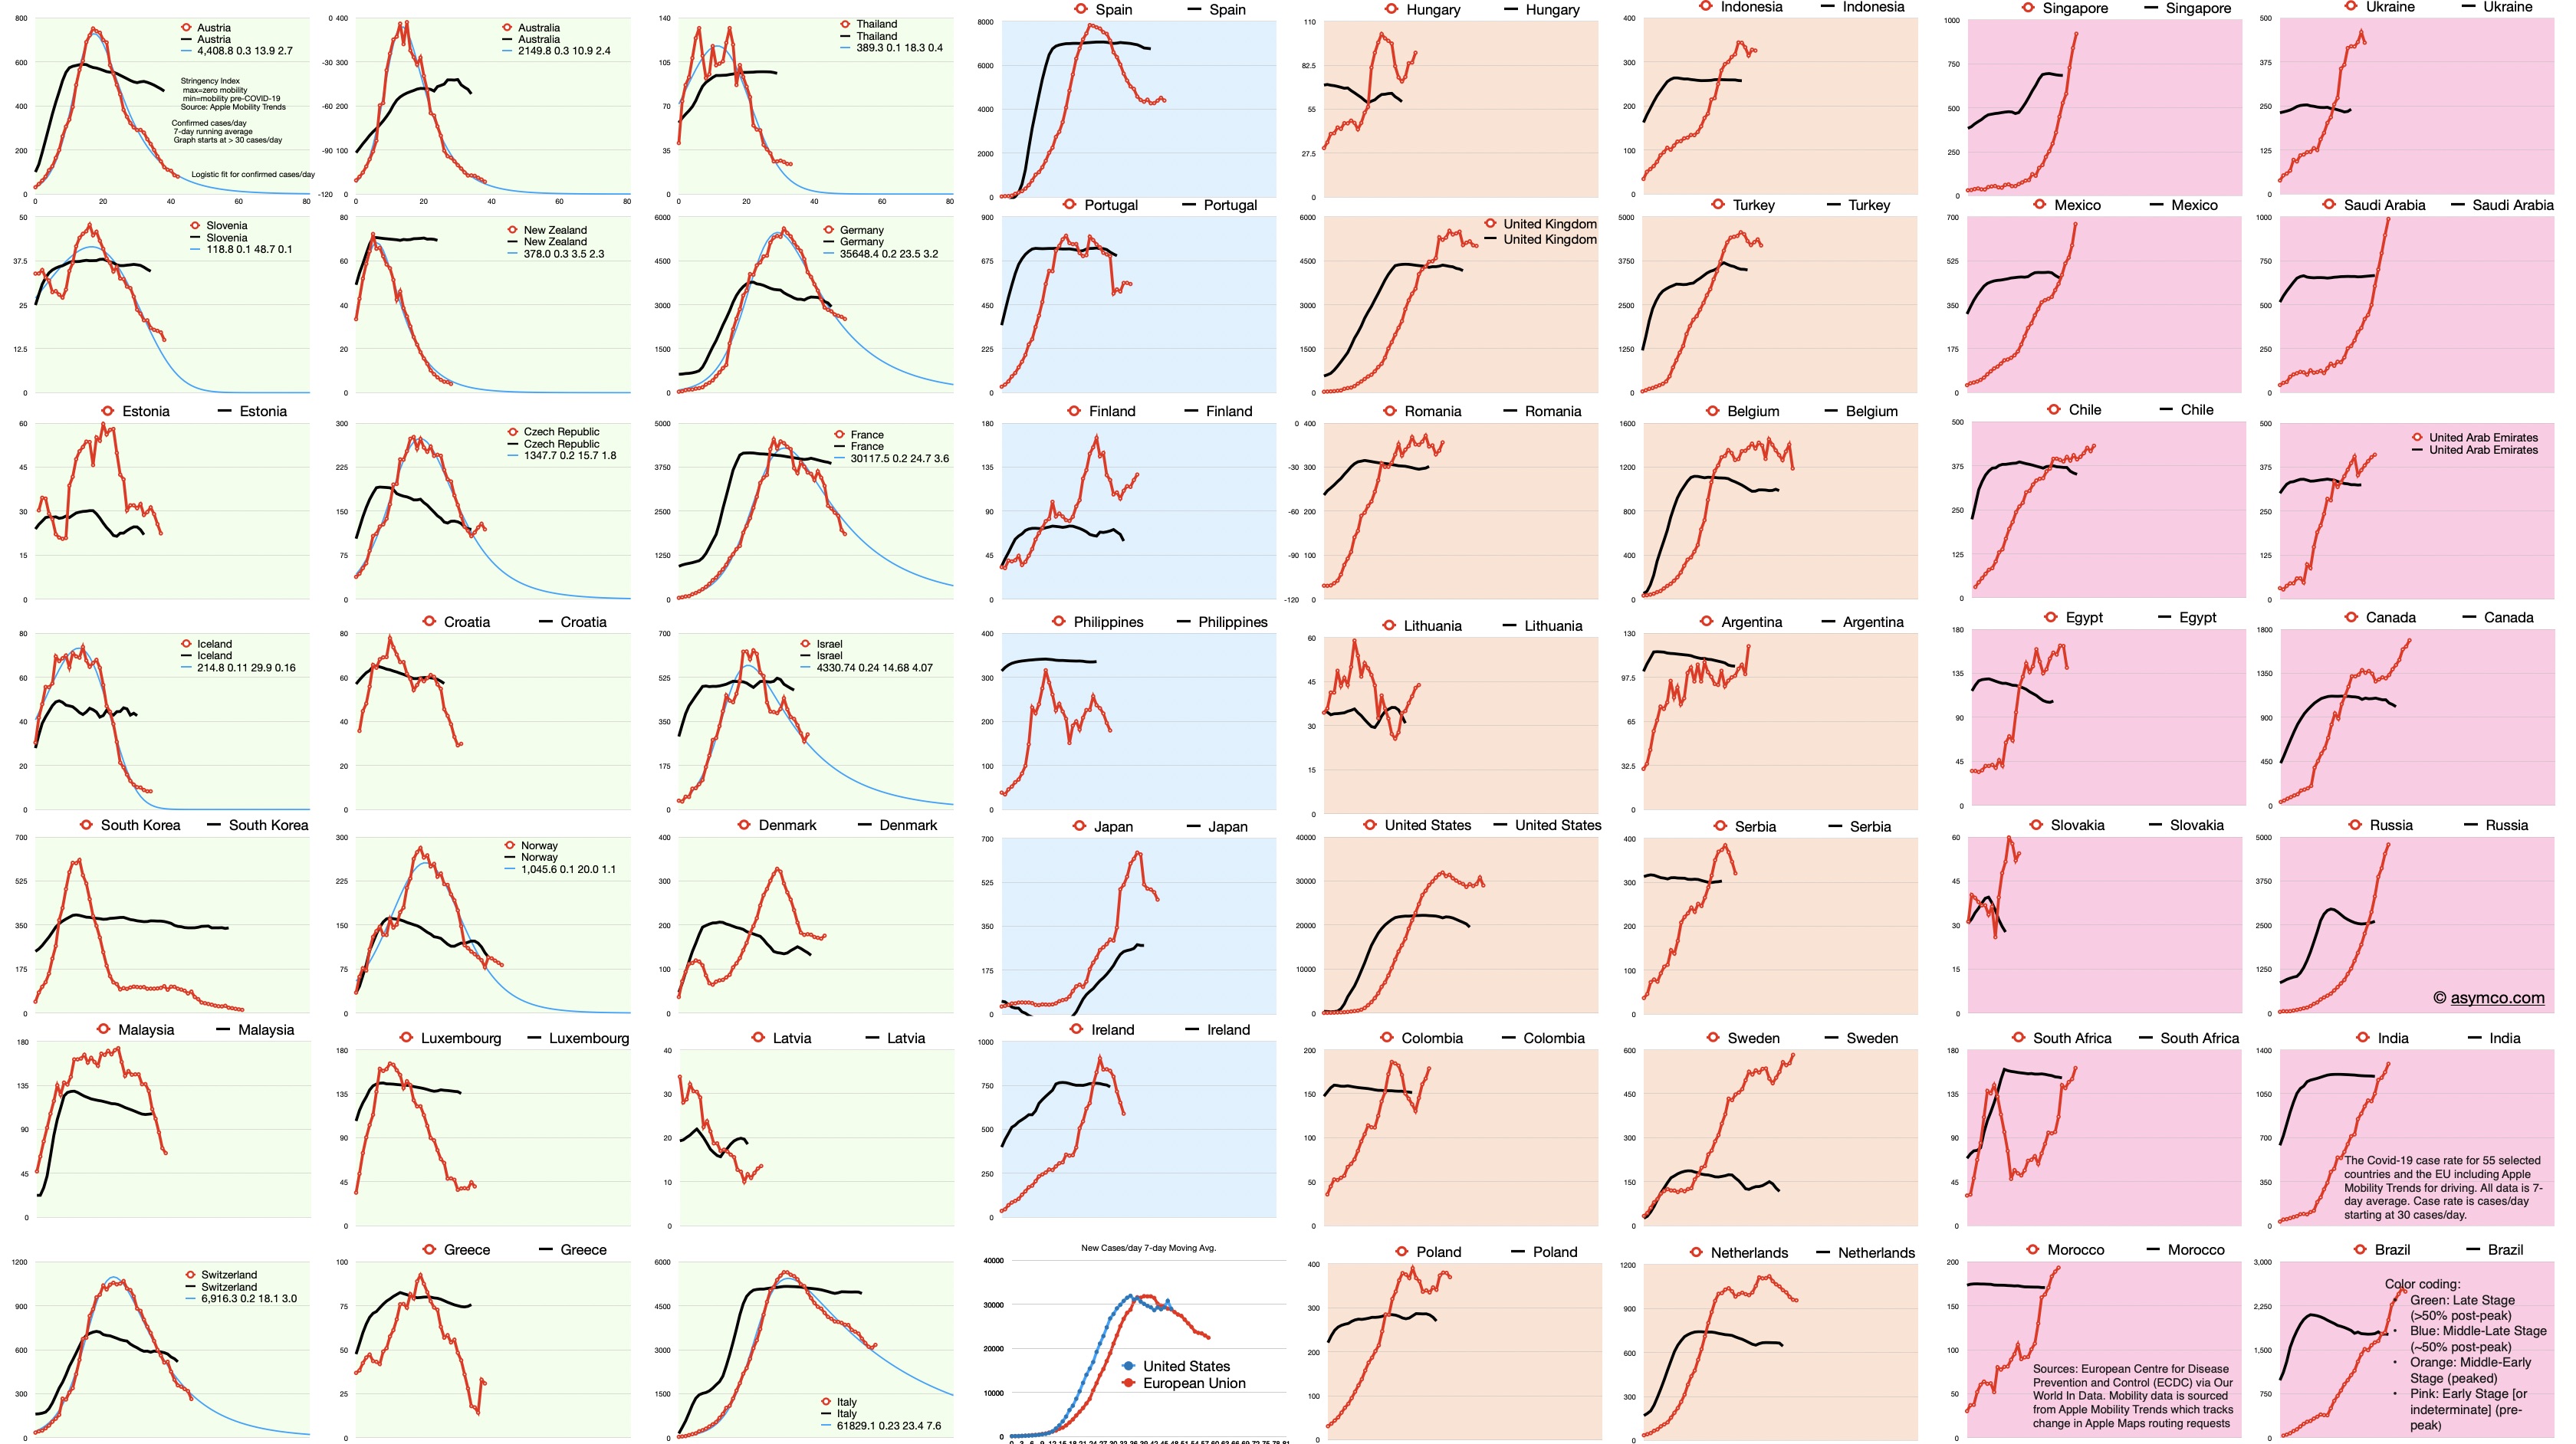
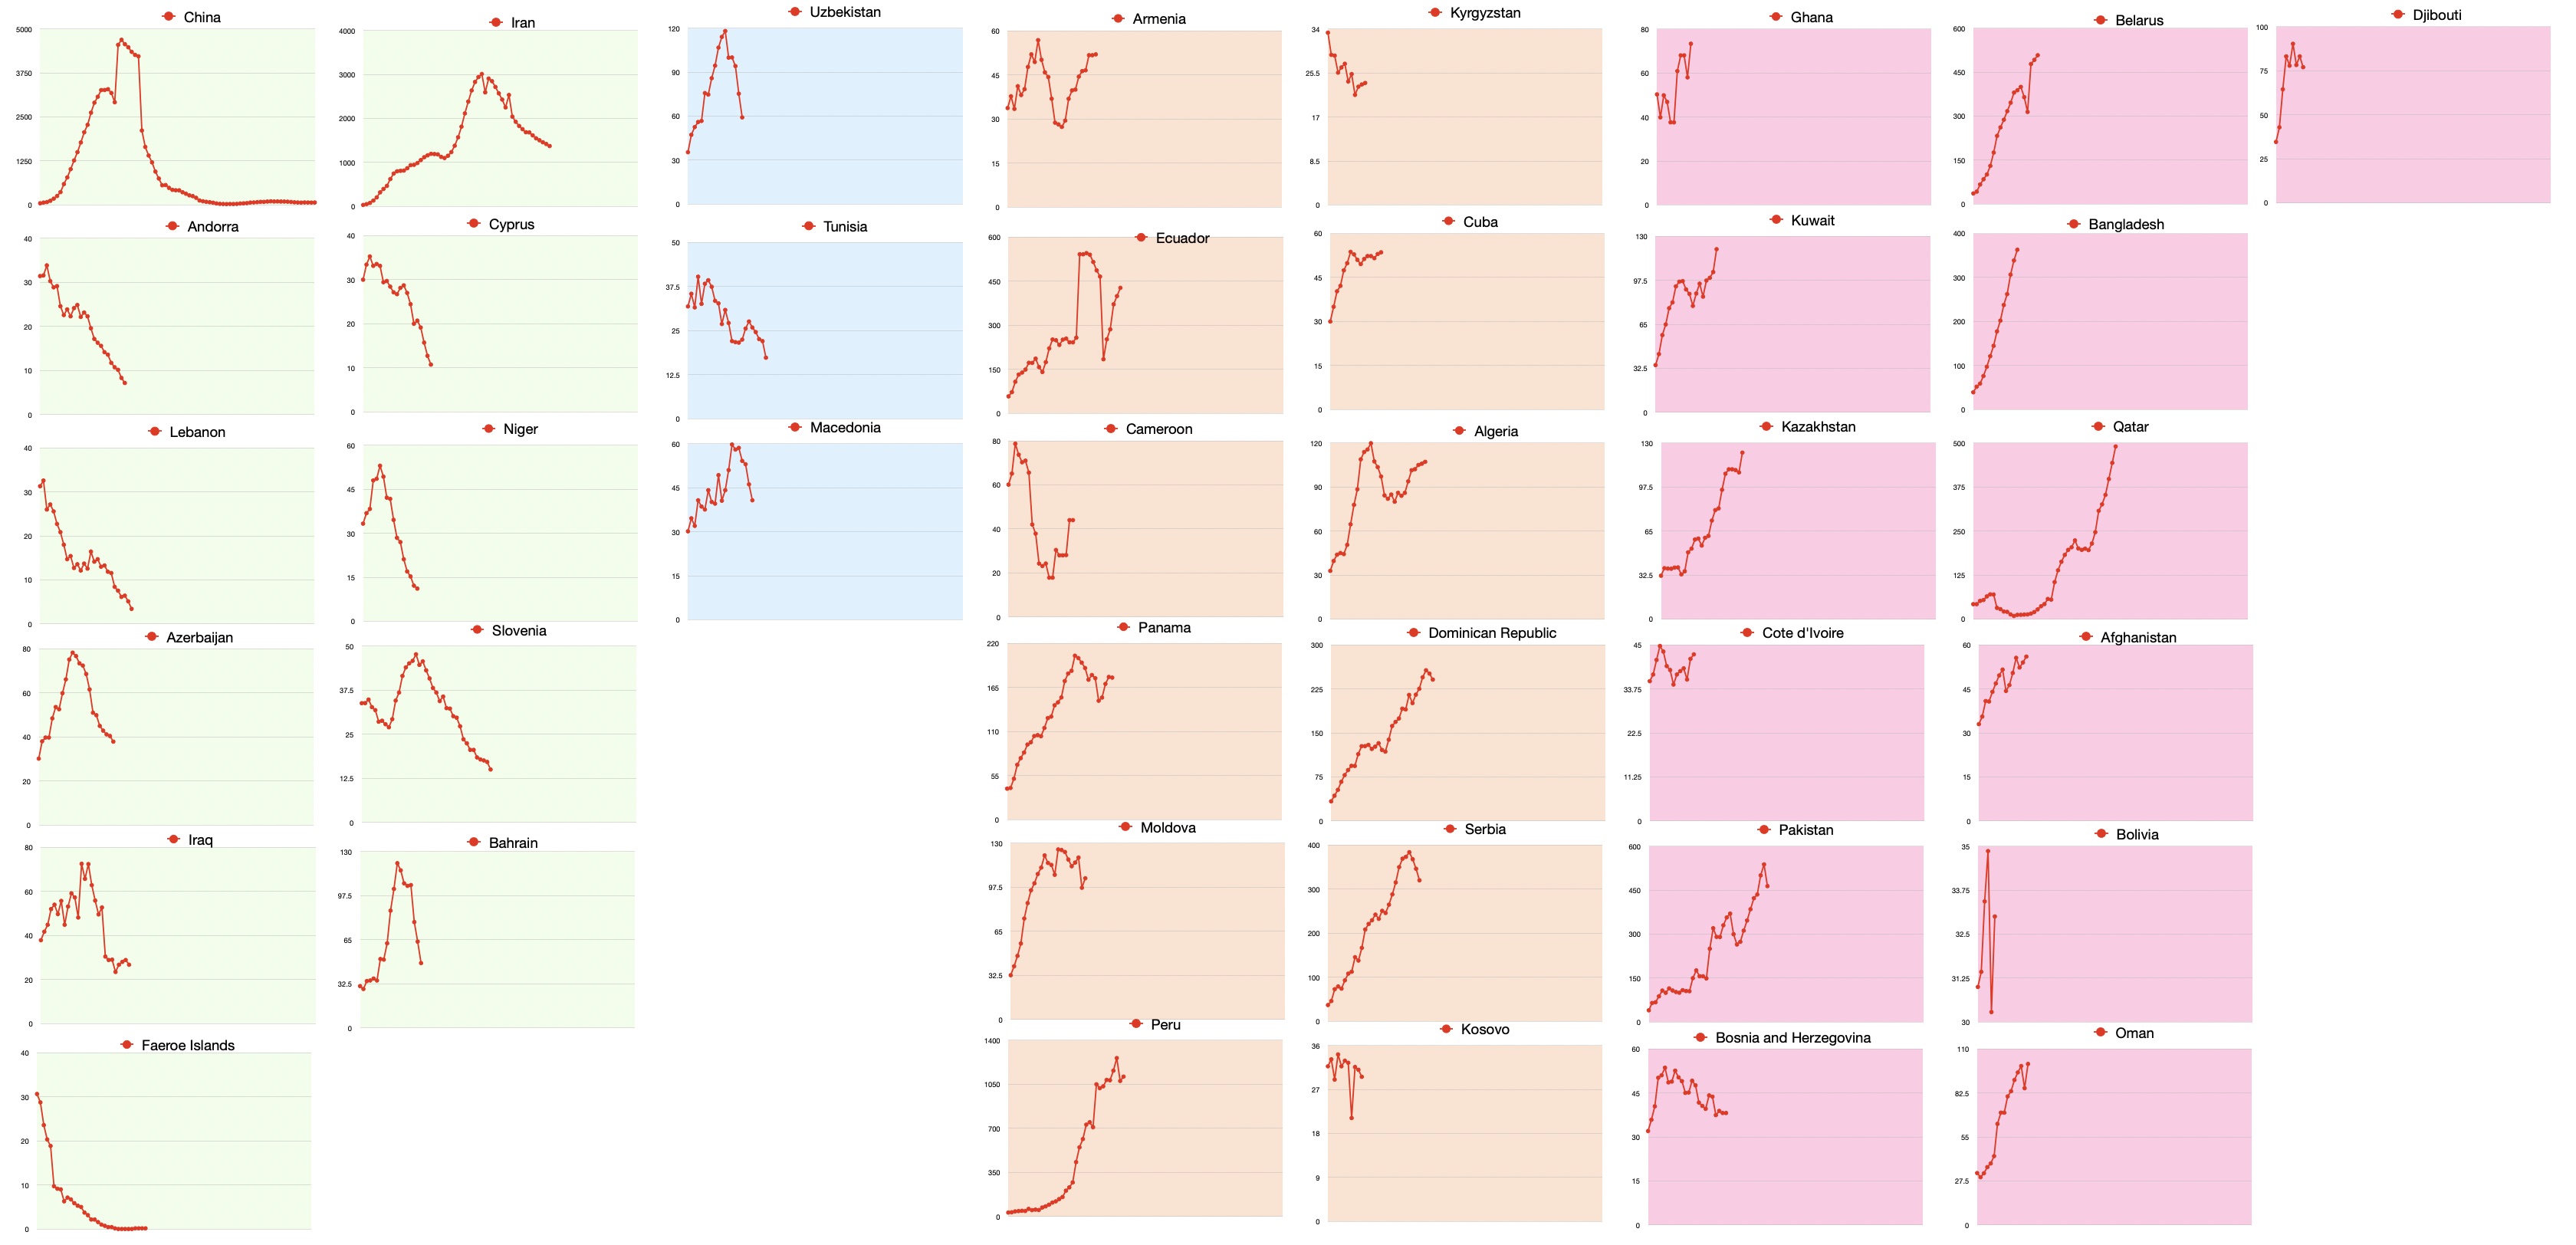
    The Covid-19 case rate for 99 selected countries and the EU. Apple Mobility Trend for 57 countries.

    Background color coding: 

    • Green: Late Stage (>50% post-peak)
    • Blue: Middle-Late Stage (~50% post-peak)
    • Orange: Middle-Early Stage (peaked)
    • Pink: Early Stage [or indeterminate] (pre-peak)
    Red line is case rate in cases/day starting at 30 cases/day. Black line is Stringency Index which is inverse of Apple Mobility Trends (lower bound means no change in mobility, upper bound is zero mobility). All points are 7-day averages. Click on images for higher resolution or download.

    Sources: Cases data from European Centre for Disease Prevention and Control (ECDC) via Our World In Data. Mobility data is sourced from Apple Mobility Trends which tracks change in Apple Maps routing requests.

  3. Covid-19 International Dashboard May 5; 55% Green or Blue

    Research

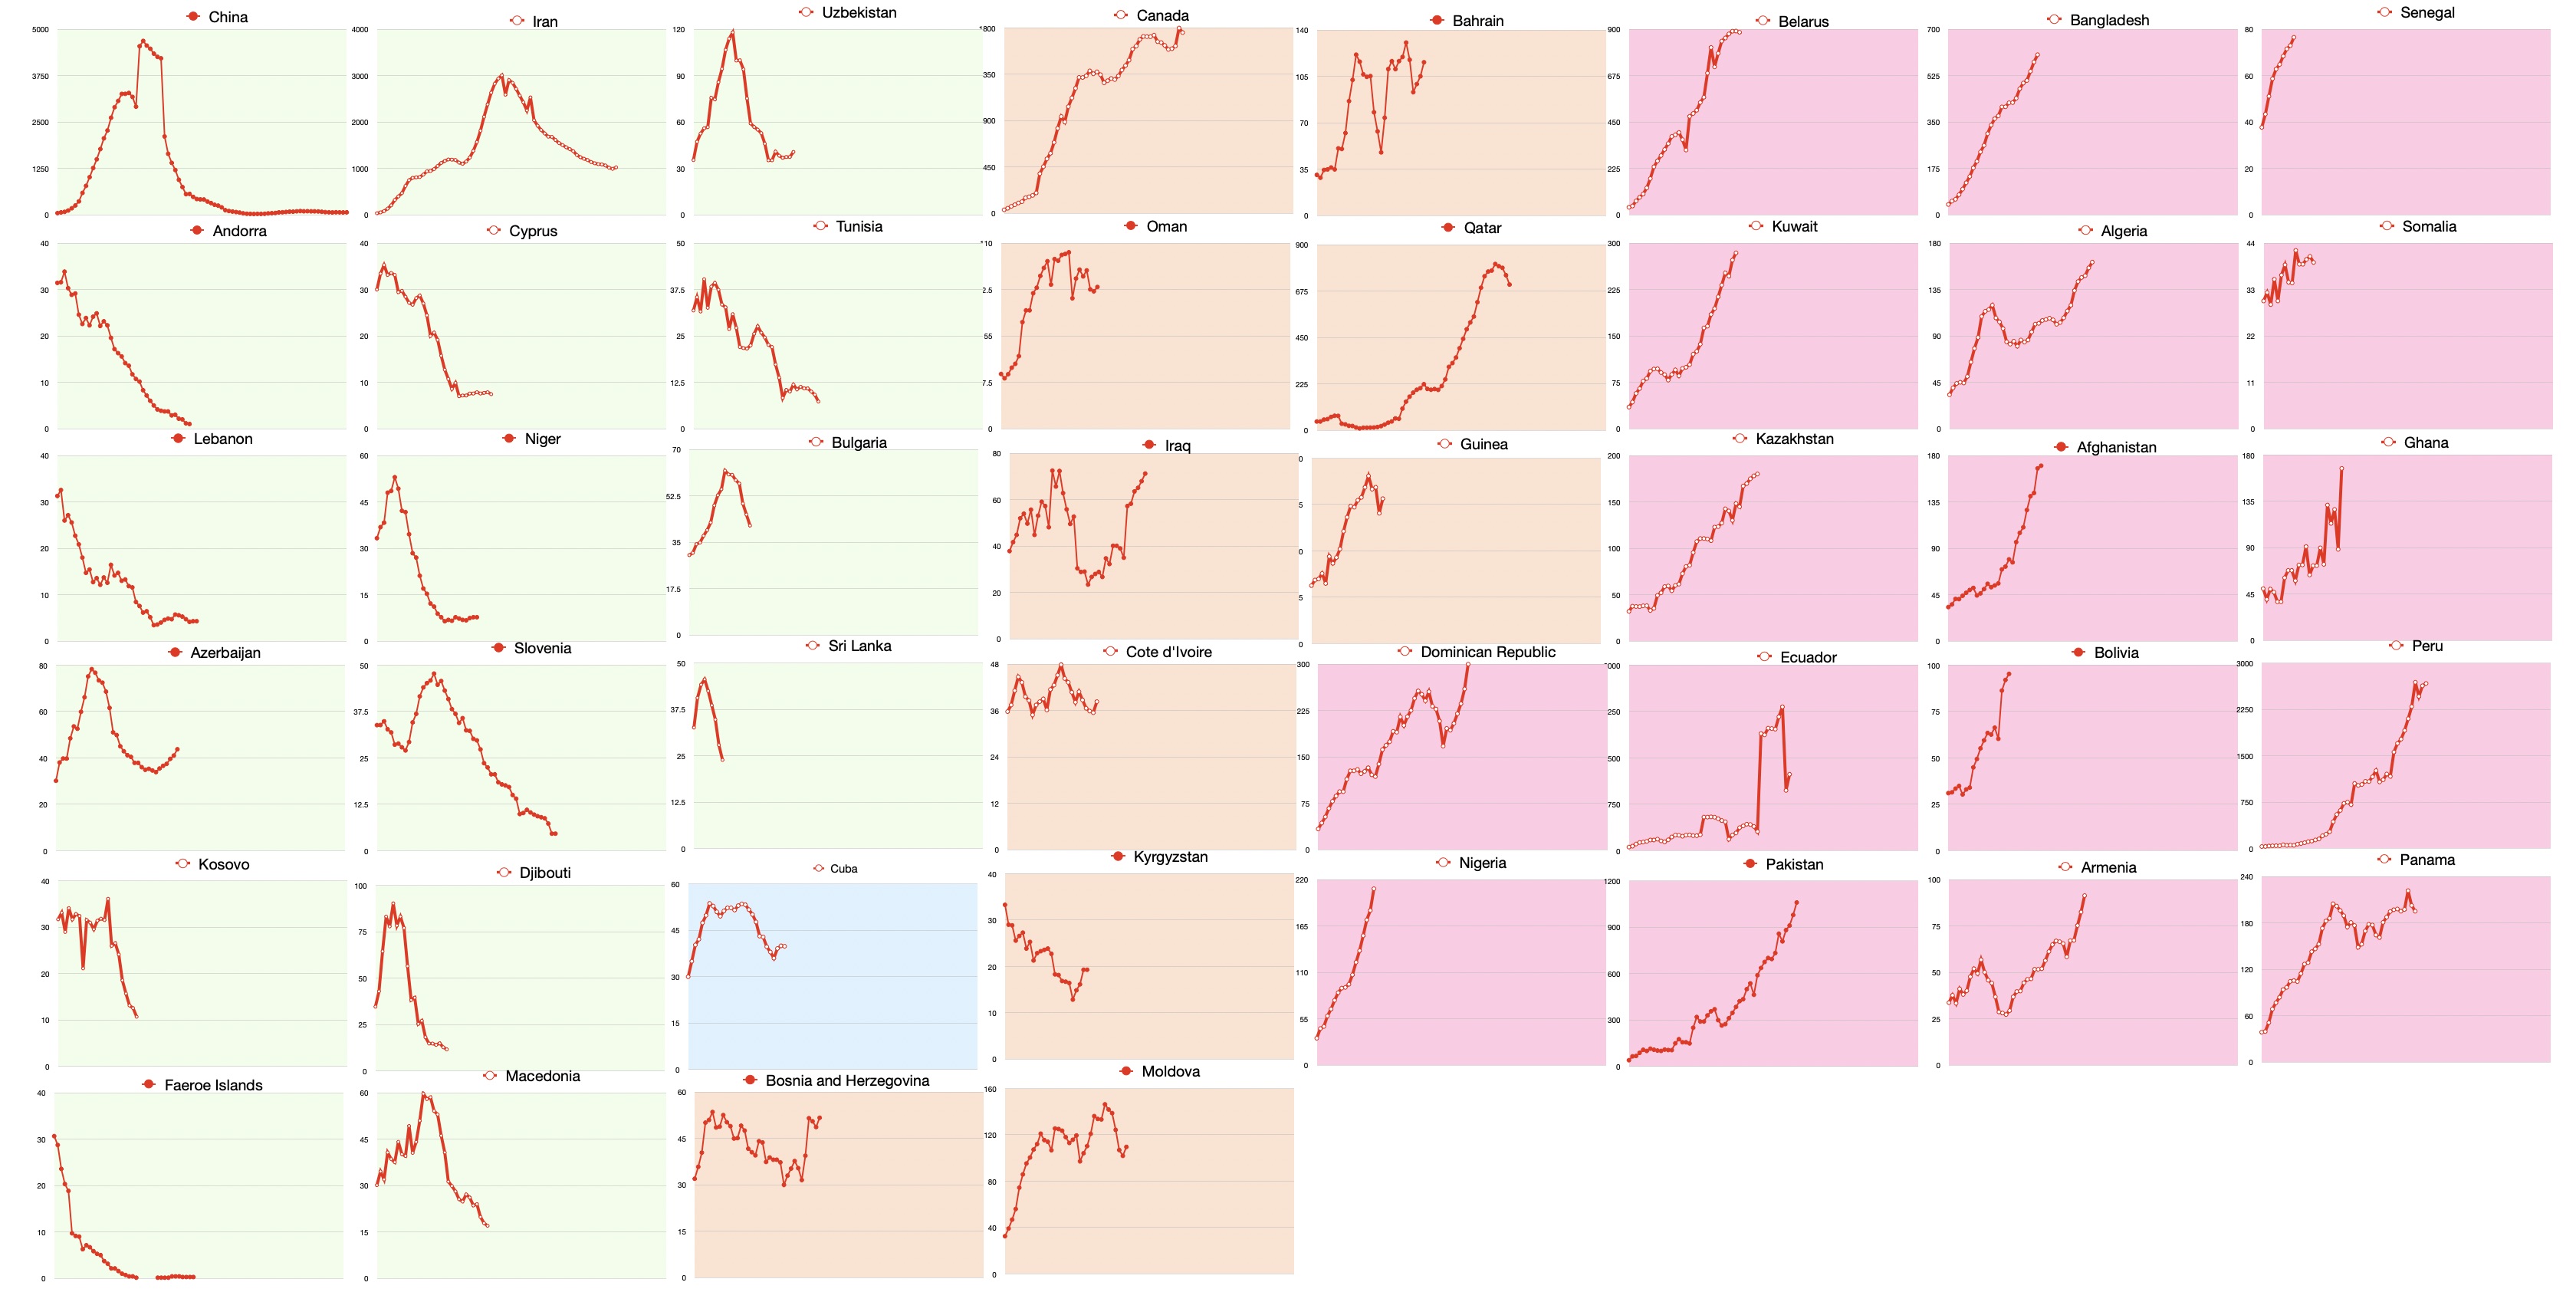
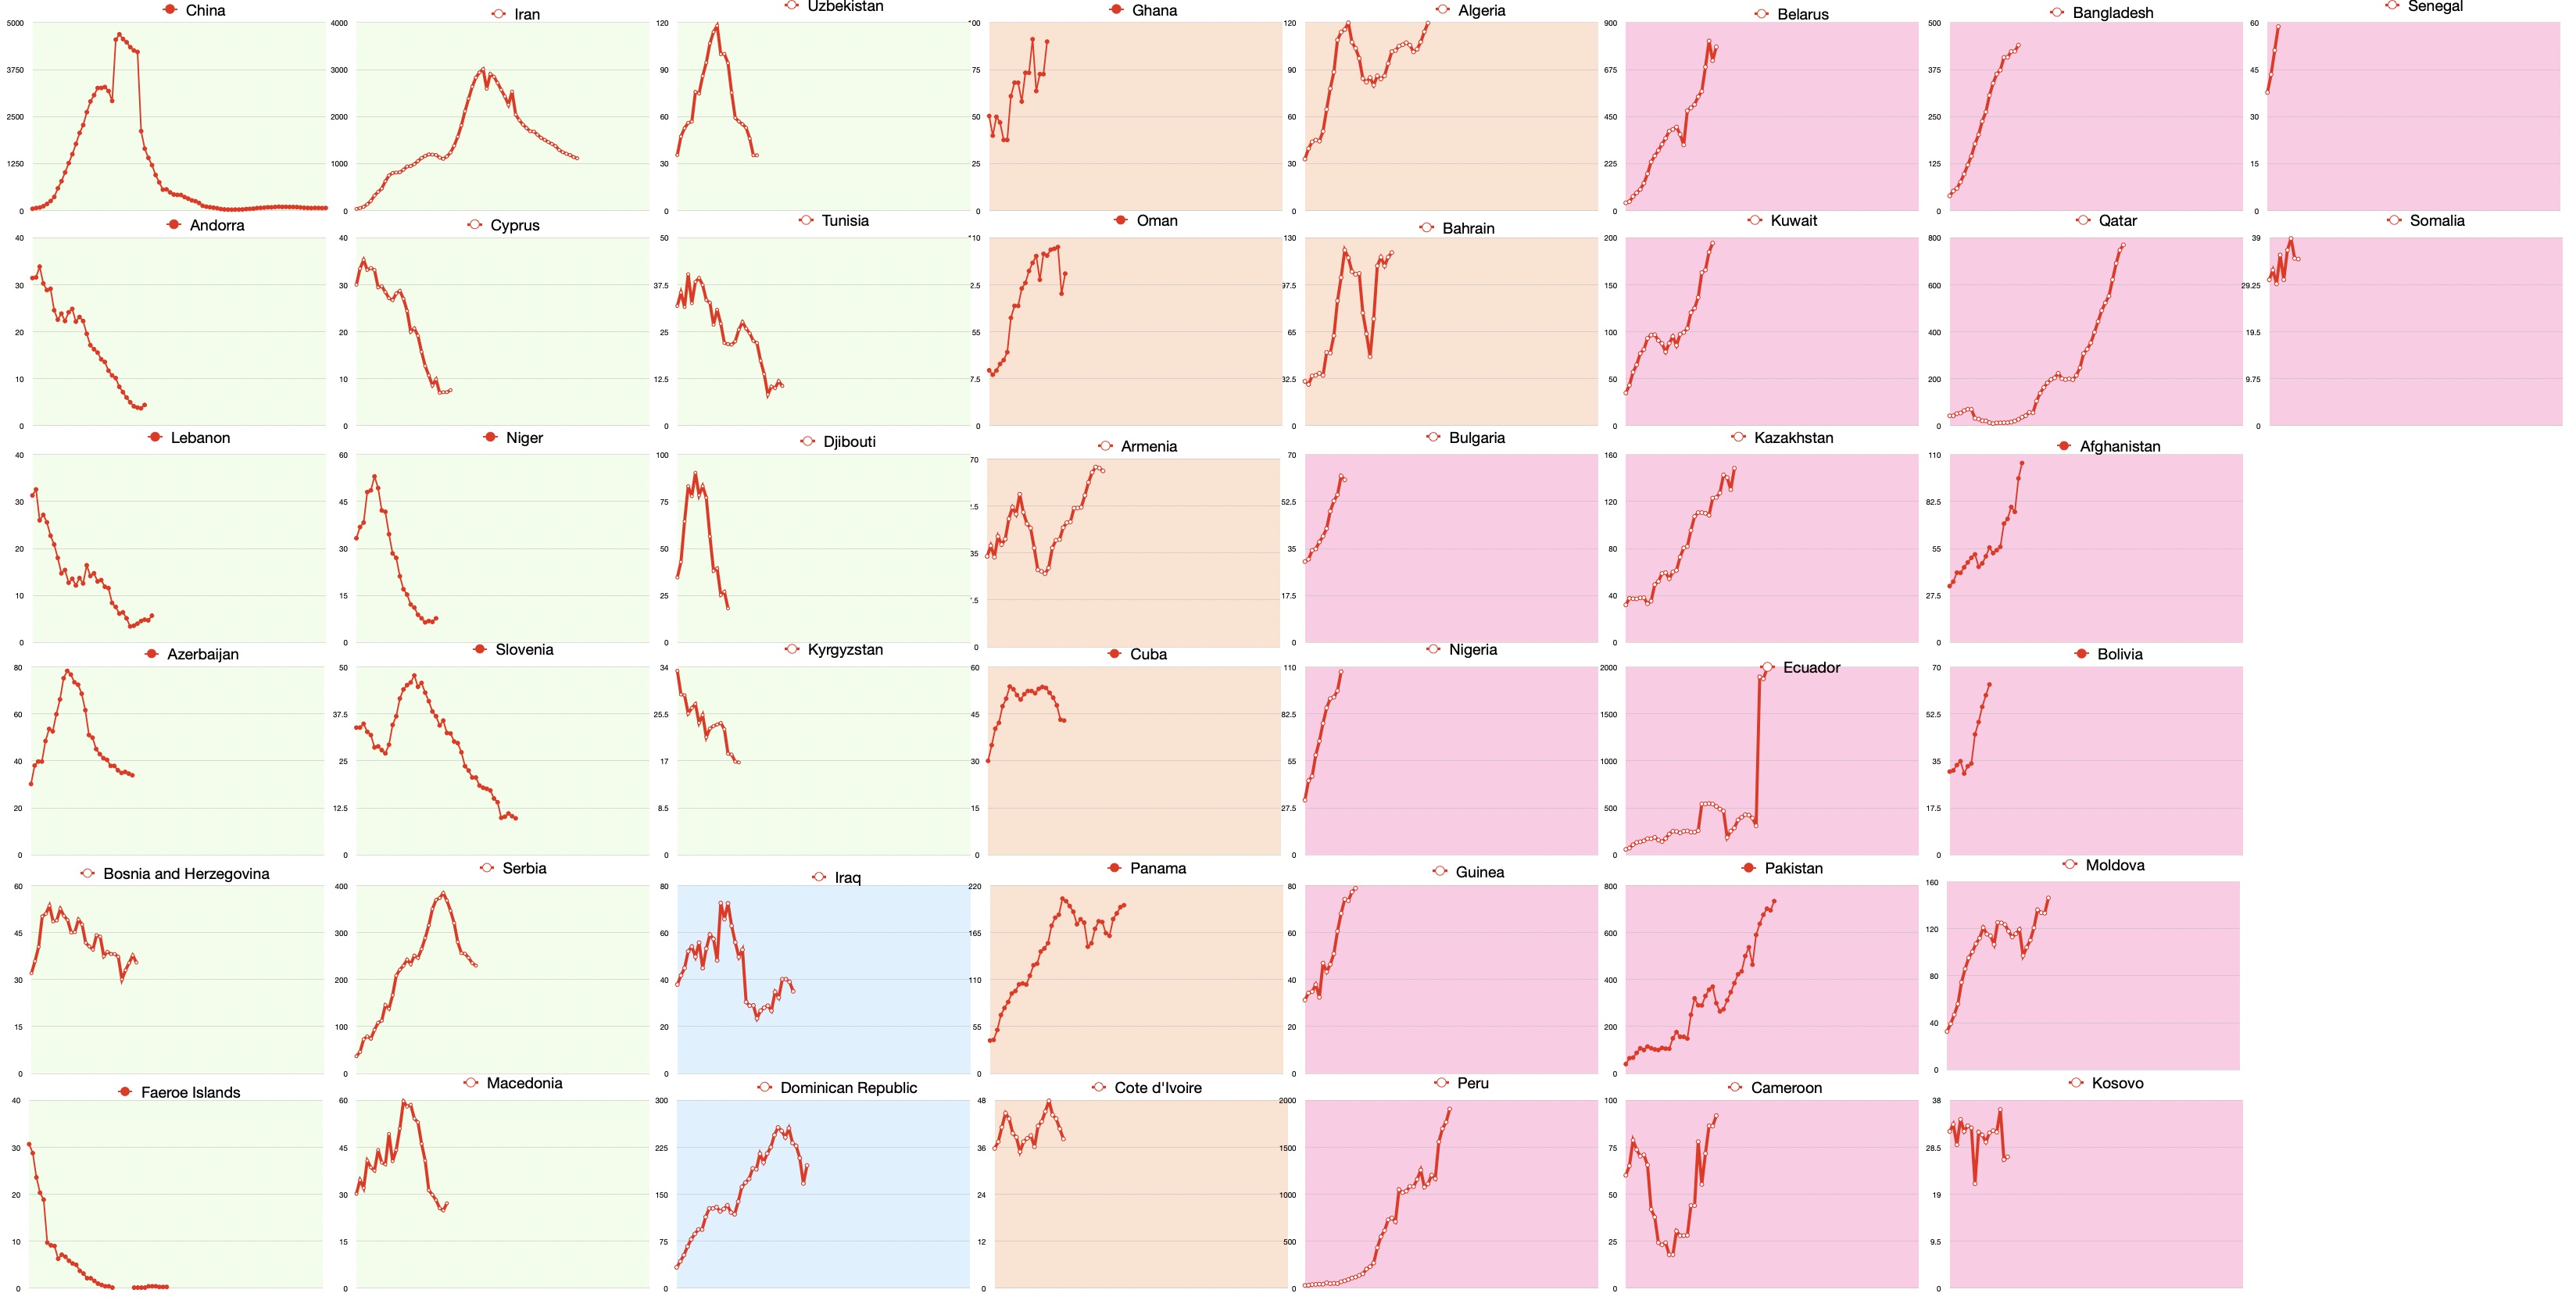
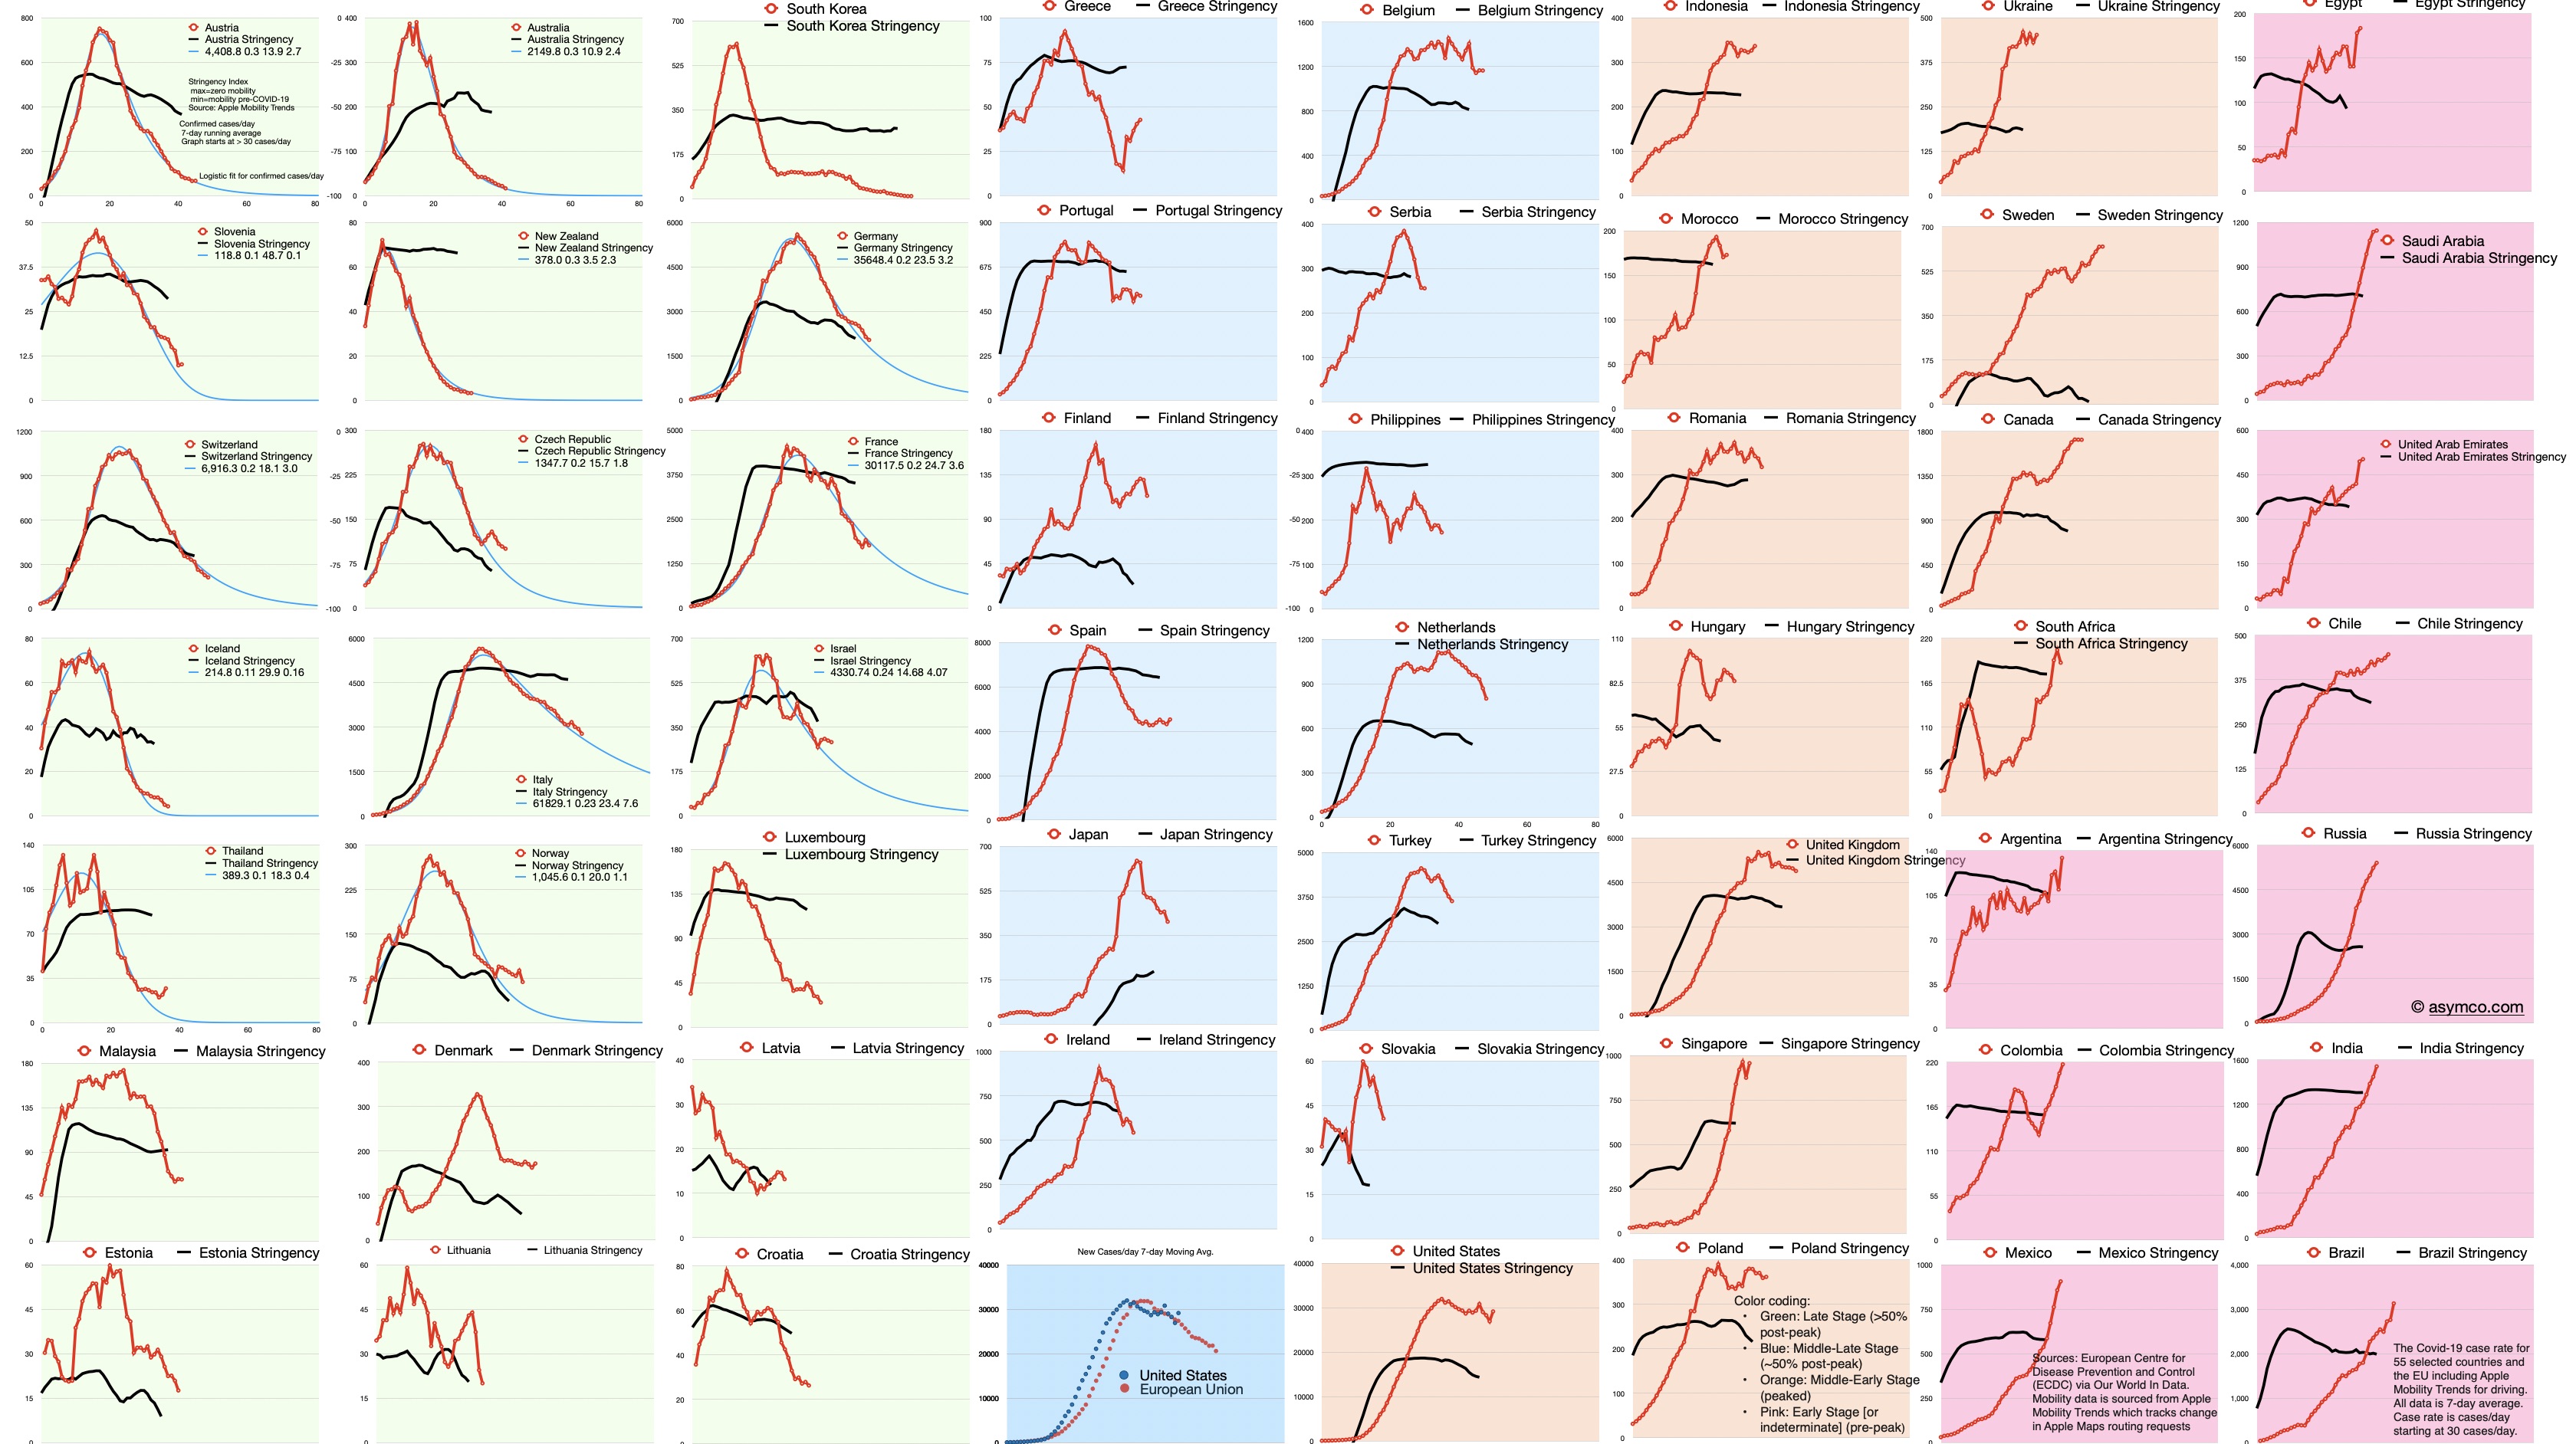
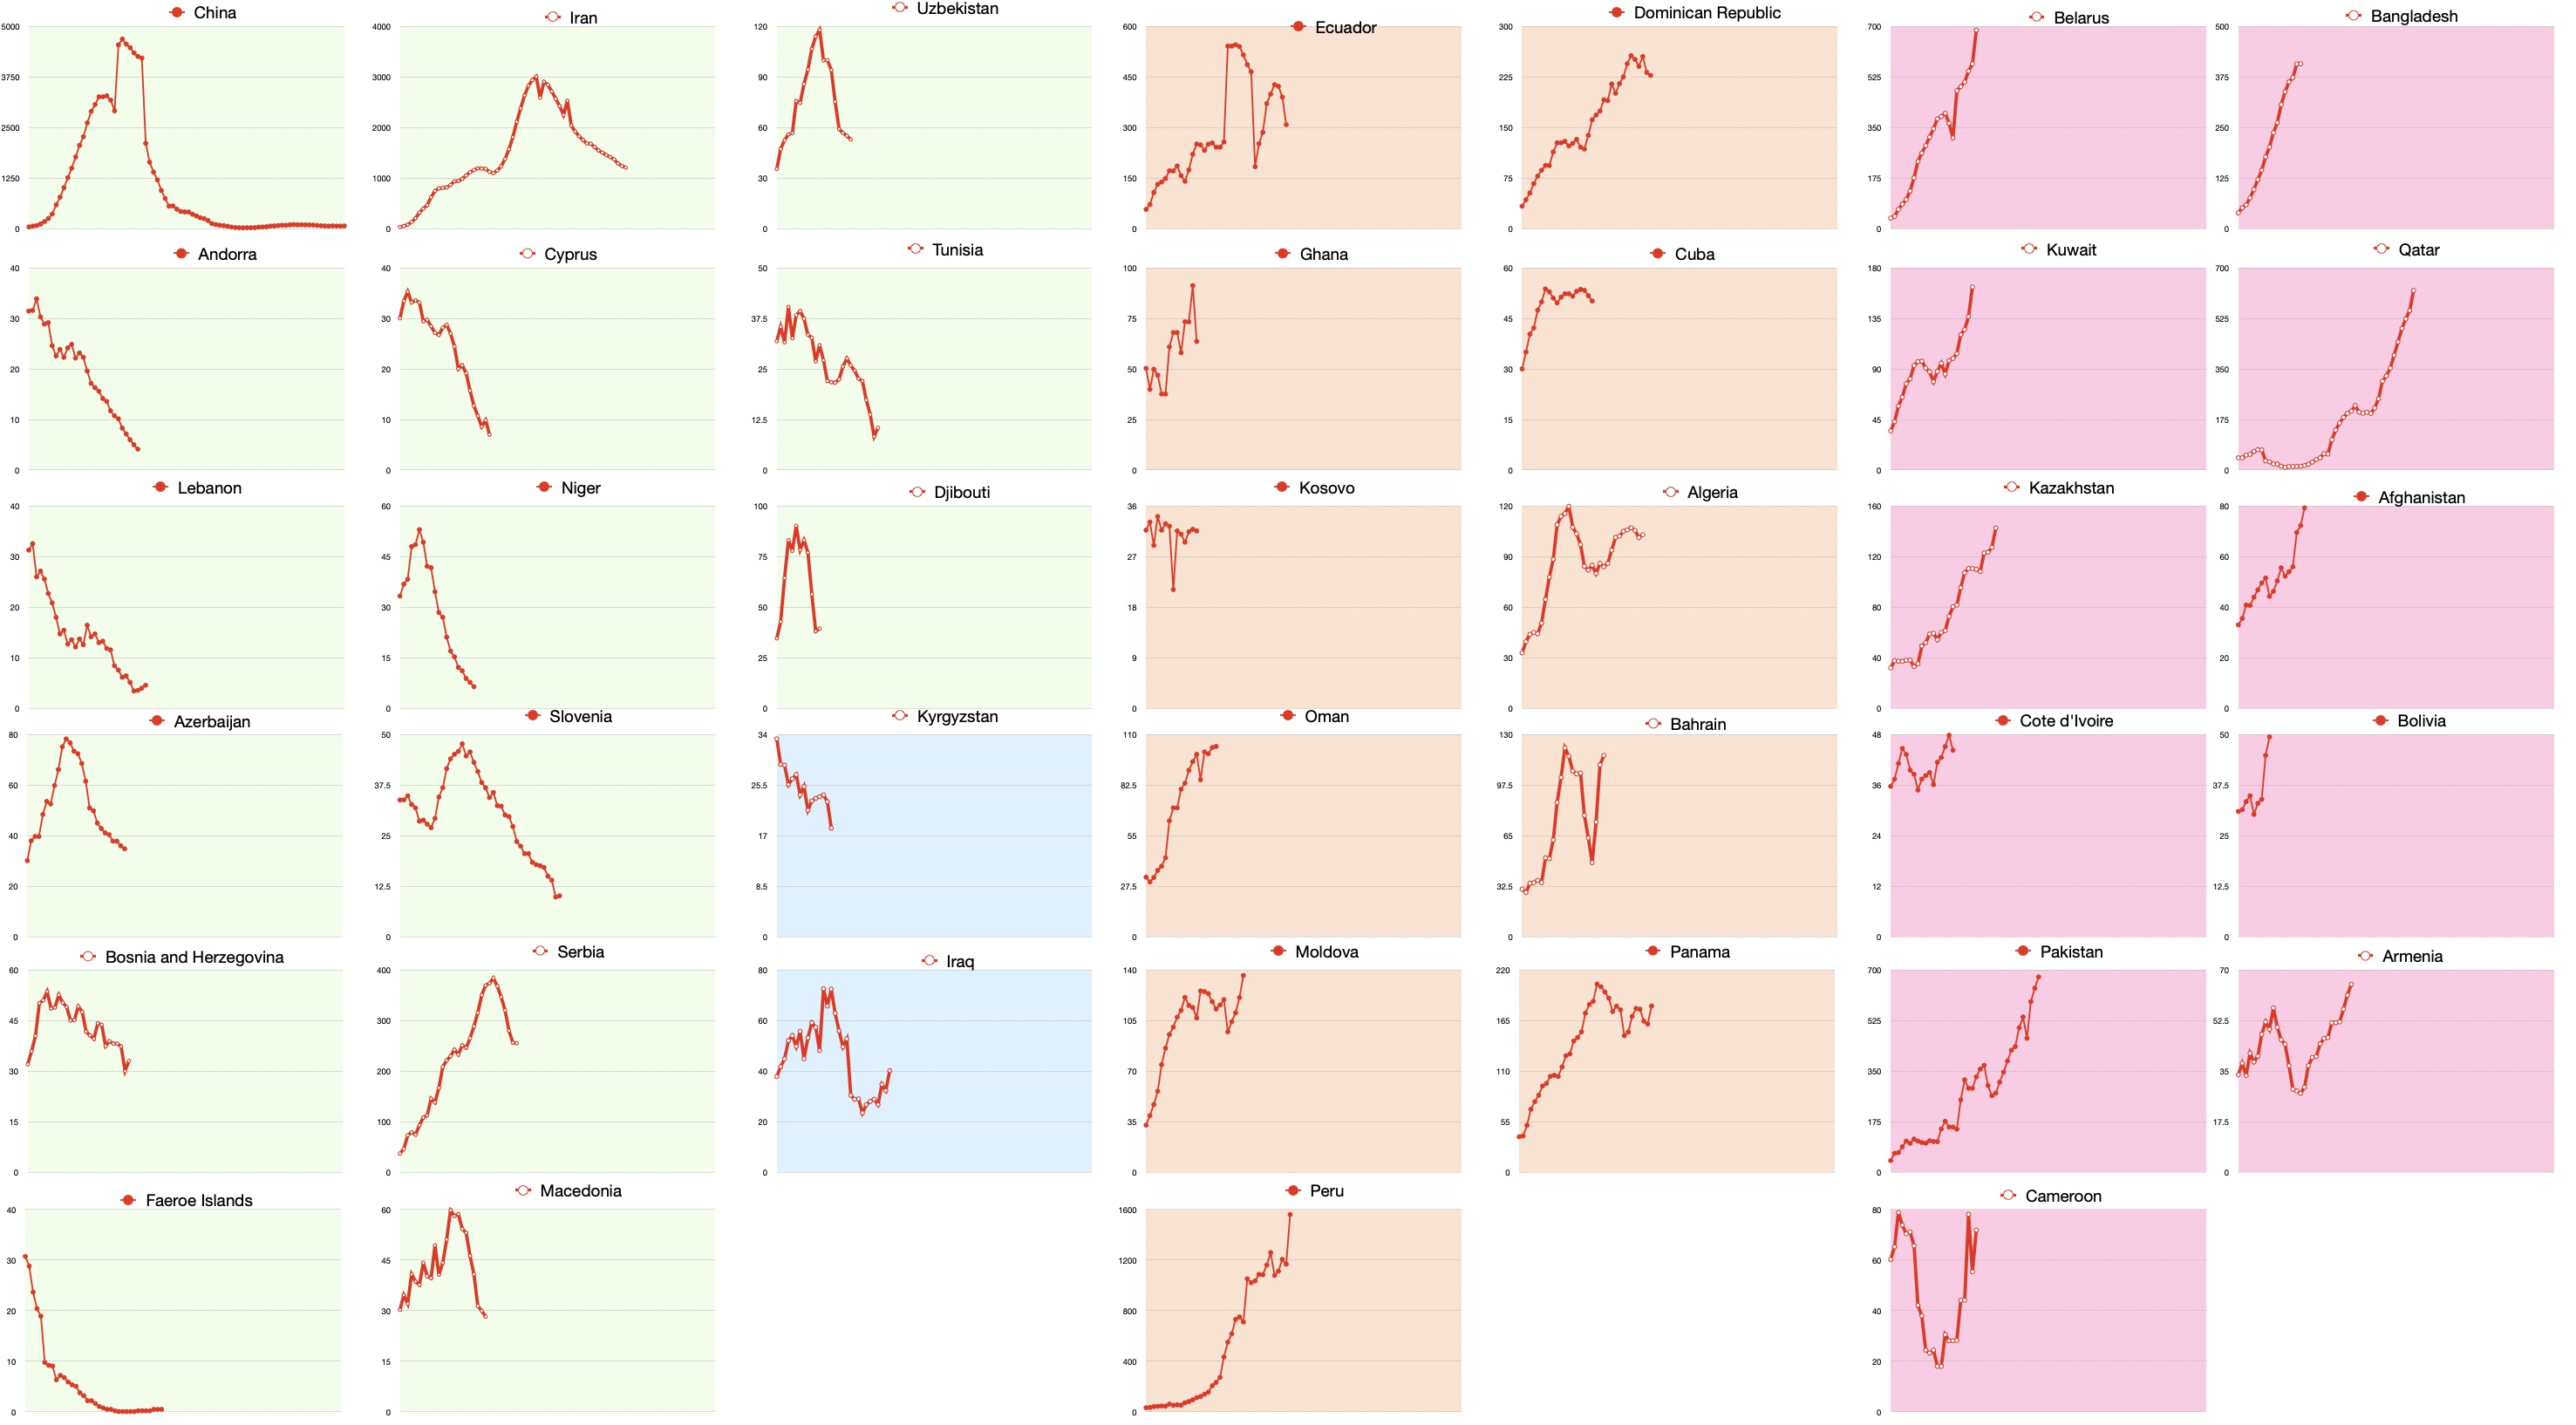
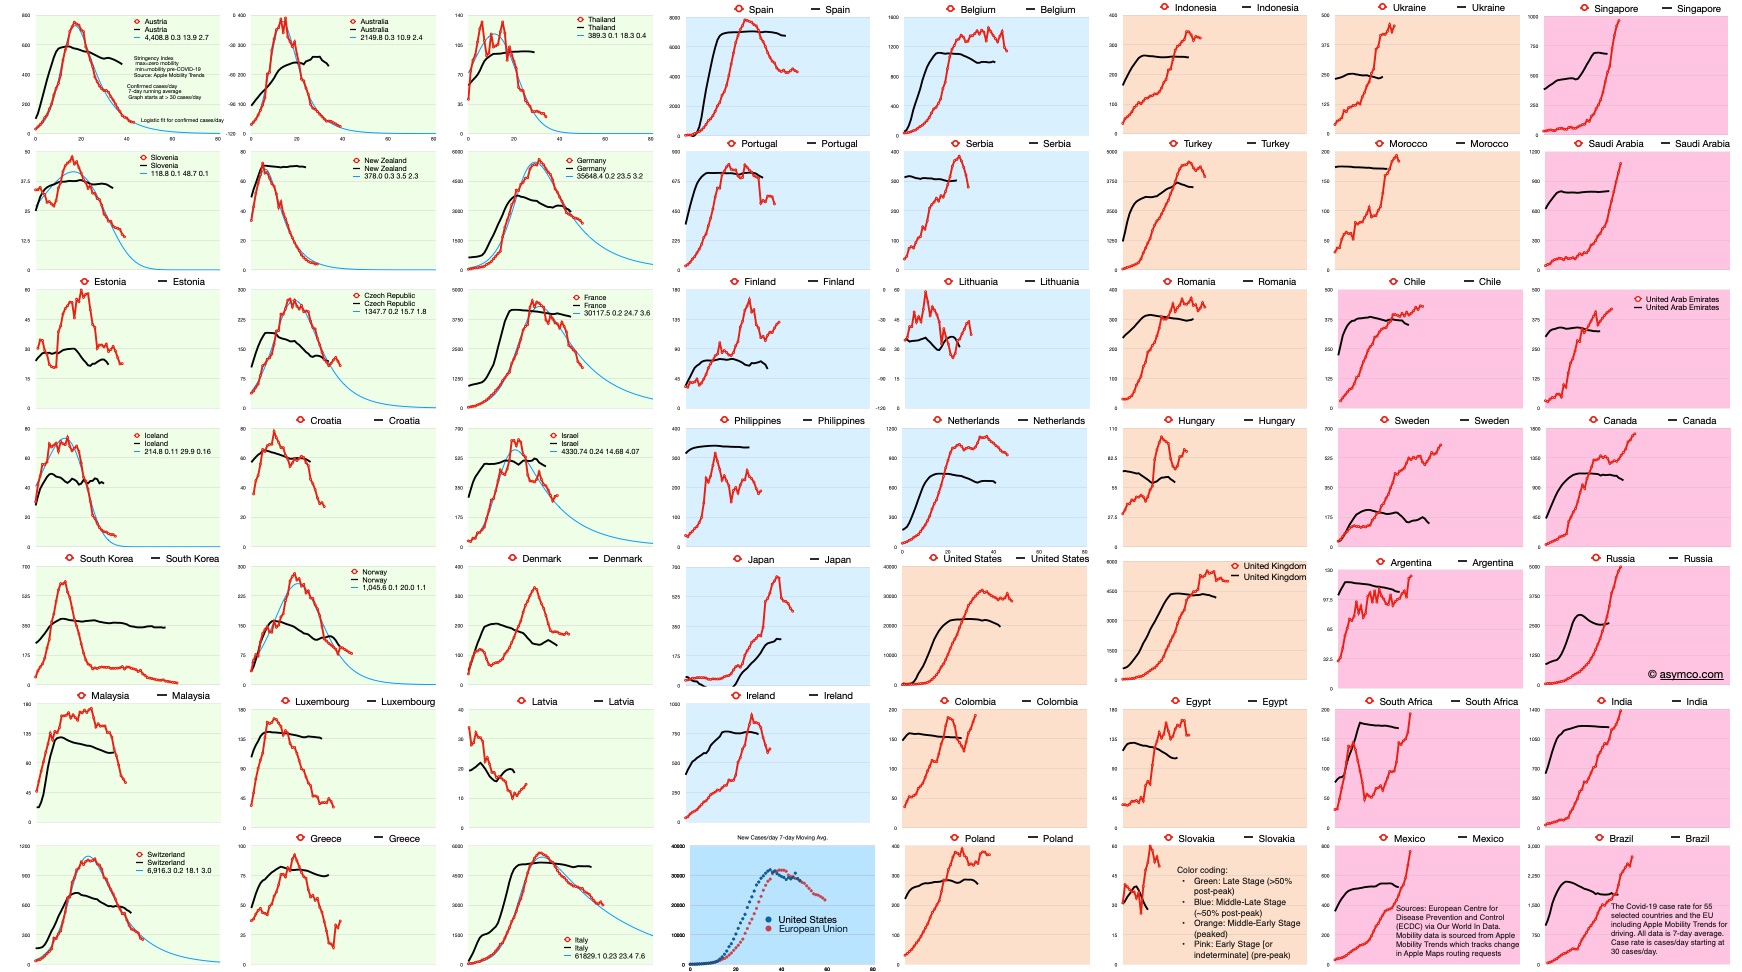
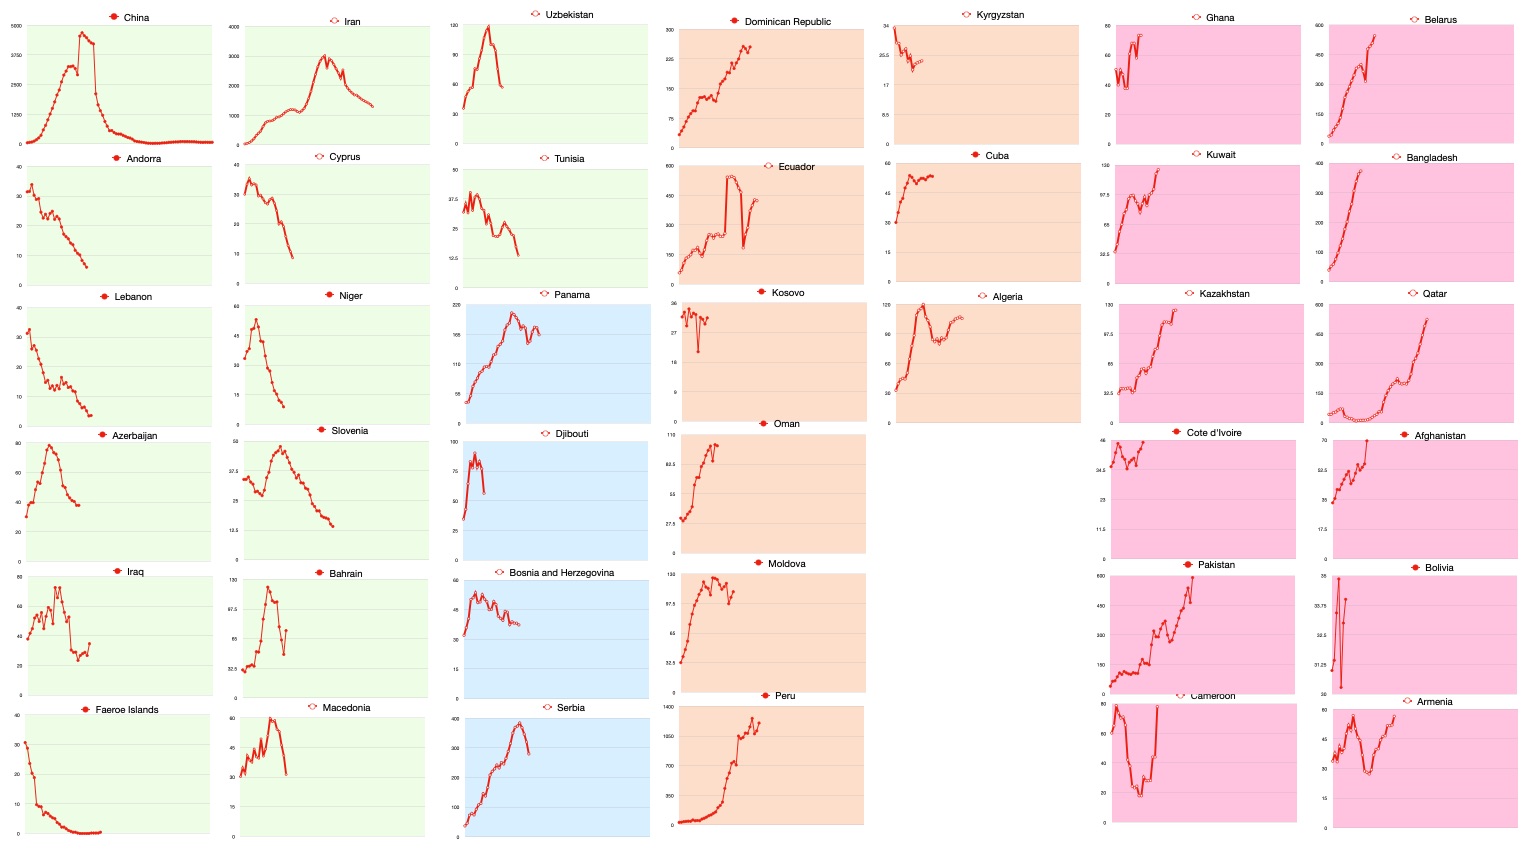
    The Covid-19 case rate for 99 selected countries and the EU. Apple Mobility Trend for 55 countries.

    Background color coding: 

    • Green: Late Stage (>50% post-peak)
    • Blue: Middle-Late Stage (~50% post-peak)
    • Orange: Middle-Early Stage (peaked)
    • Pink: Early Stage [or indeterminate] (pre-peak)
    Red line is case rate in cases/day starting at 30 cases/day. Black line is Stringency Index which is inverse of Apple Mobility Trends (lower bound means no change in mobility, upper bound is zero mobility). All points are 7-day averages. Click on images for higher resolution or download.

    Sources: Cases data from European Centre for Disease Prevention and Control (ECDC) via Our World In Data. Mobility data is sourced from Apple Mobility Trends which tracks change in Apple Maps routing requests.

  4. Covid-19 International Dashboard May 2; 52% Green or Blue

    Research

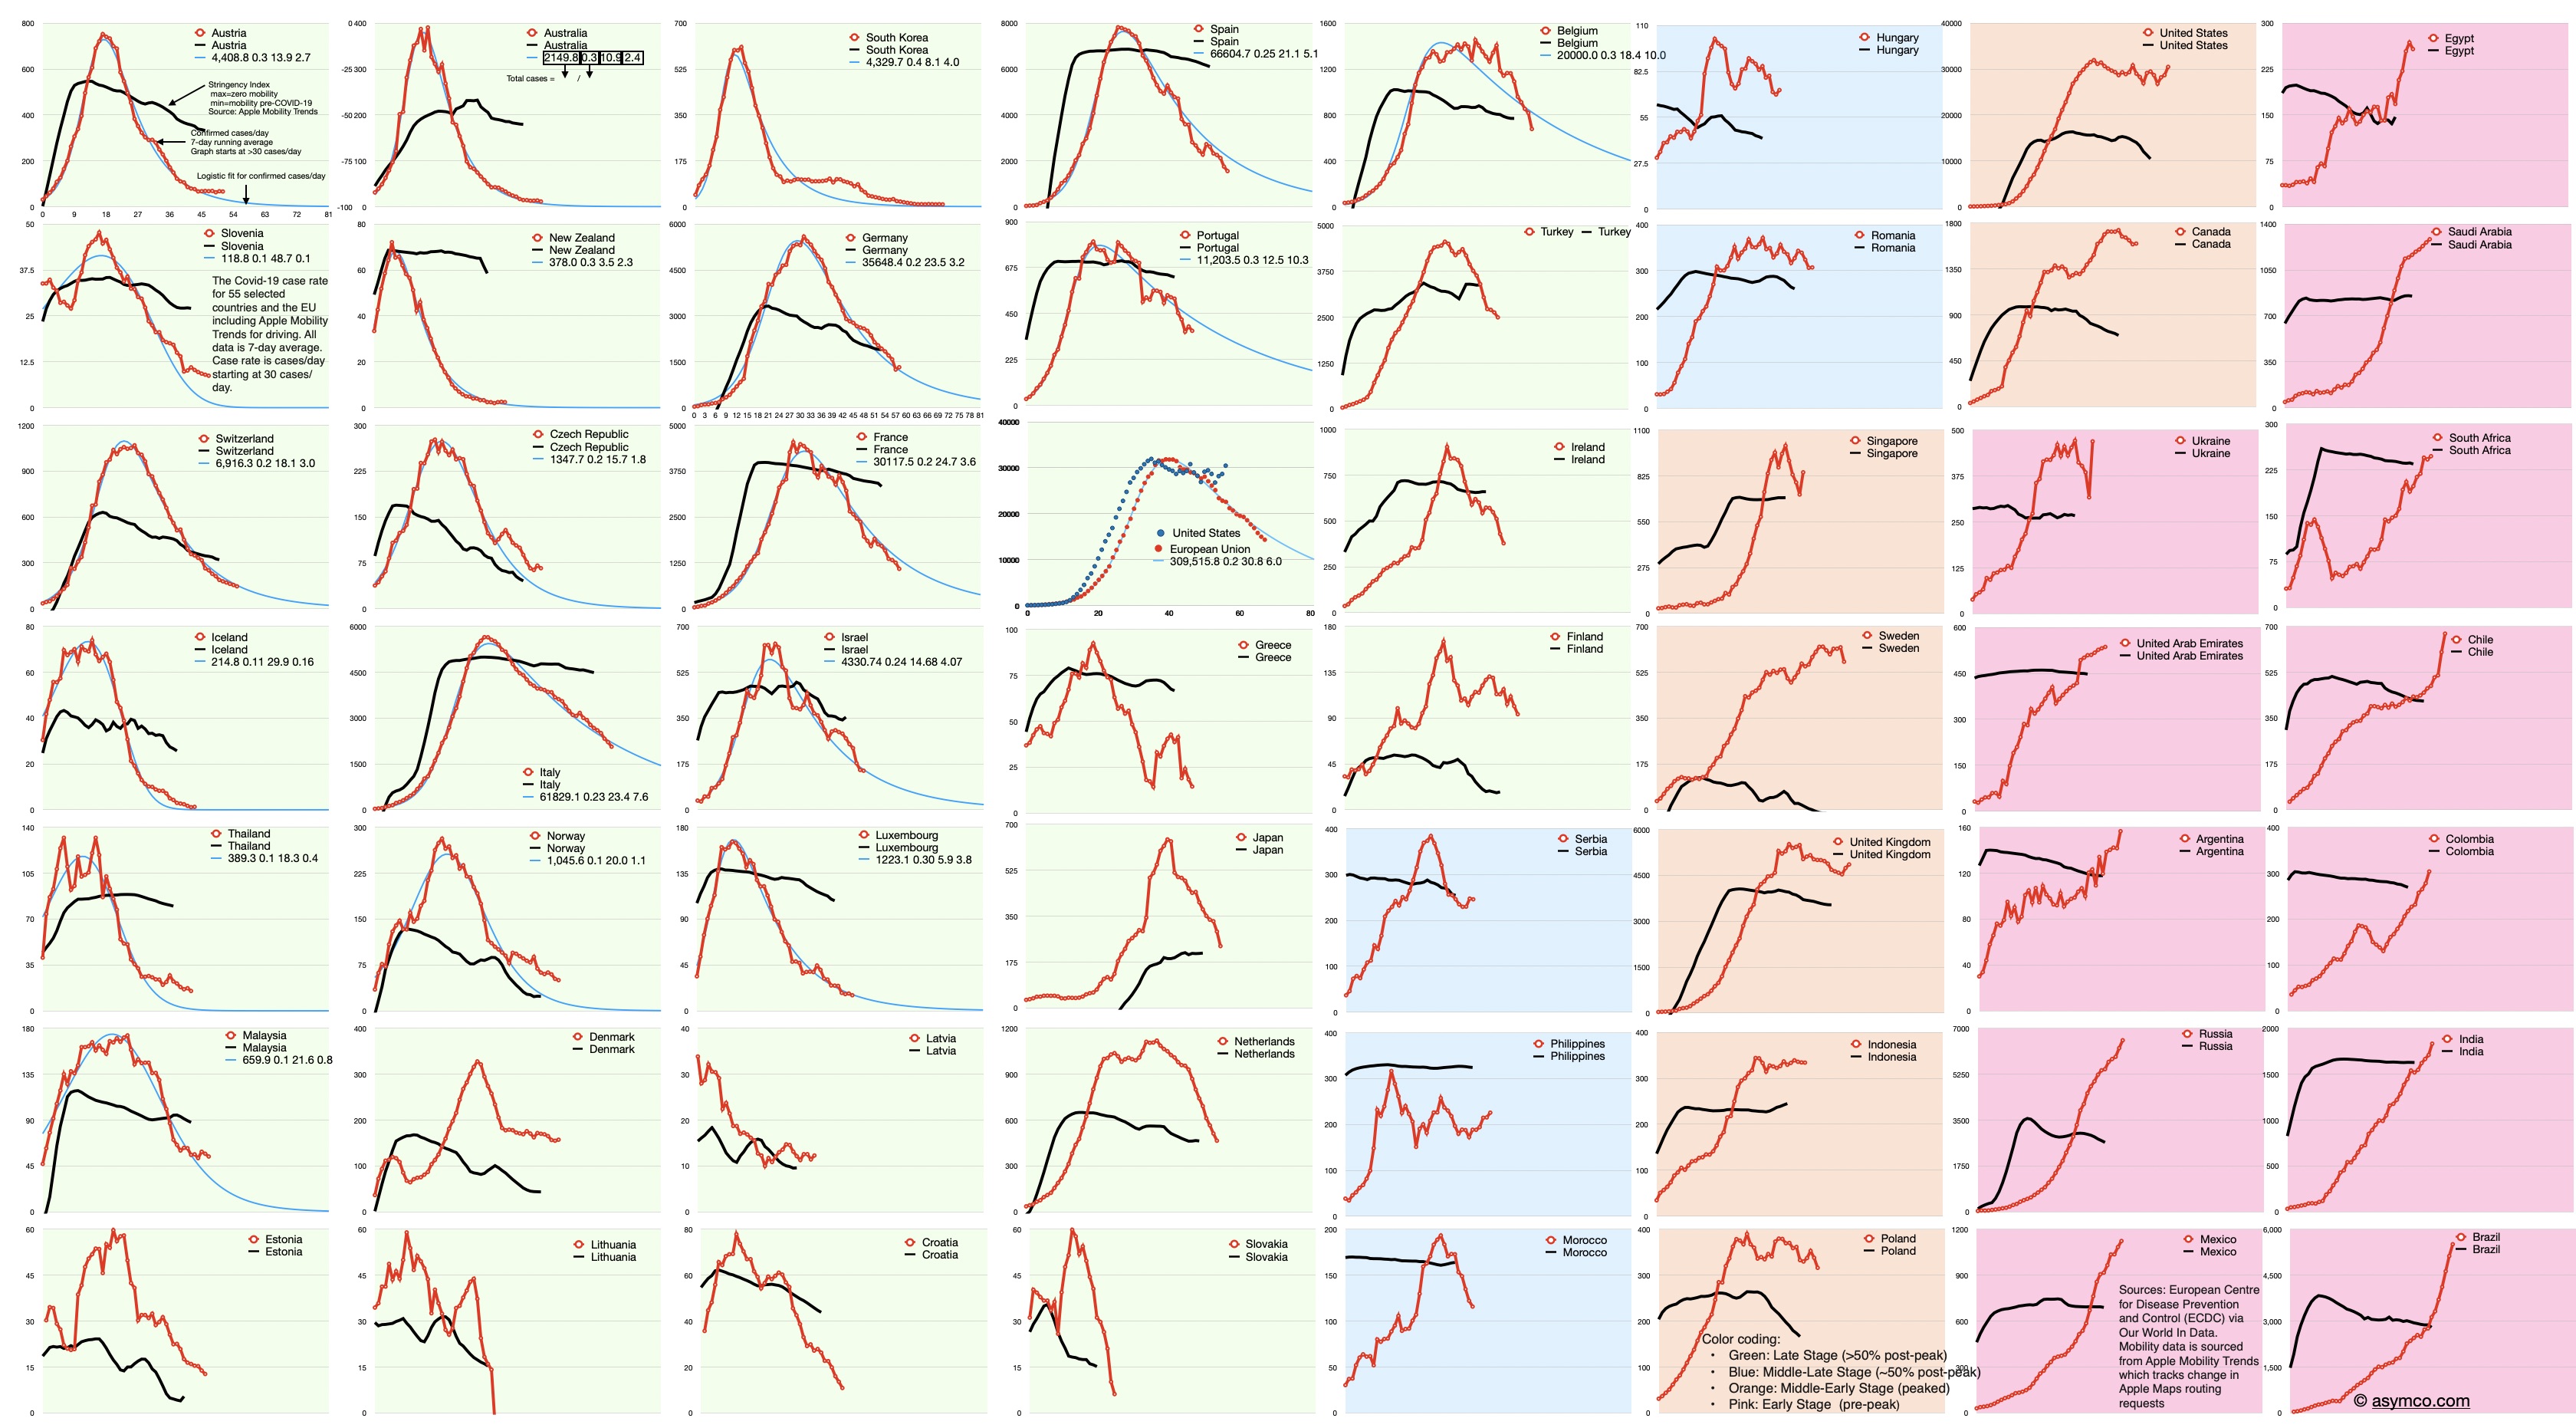
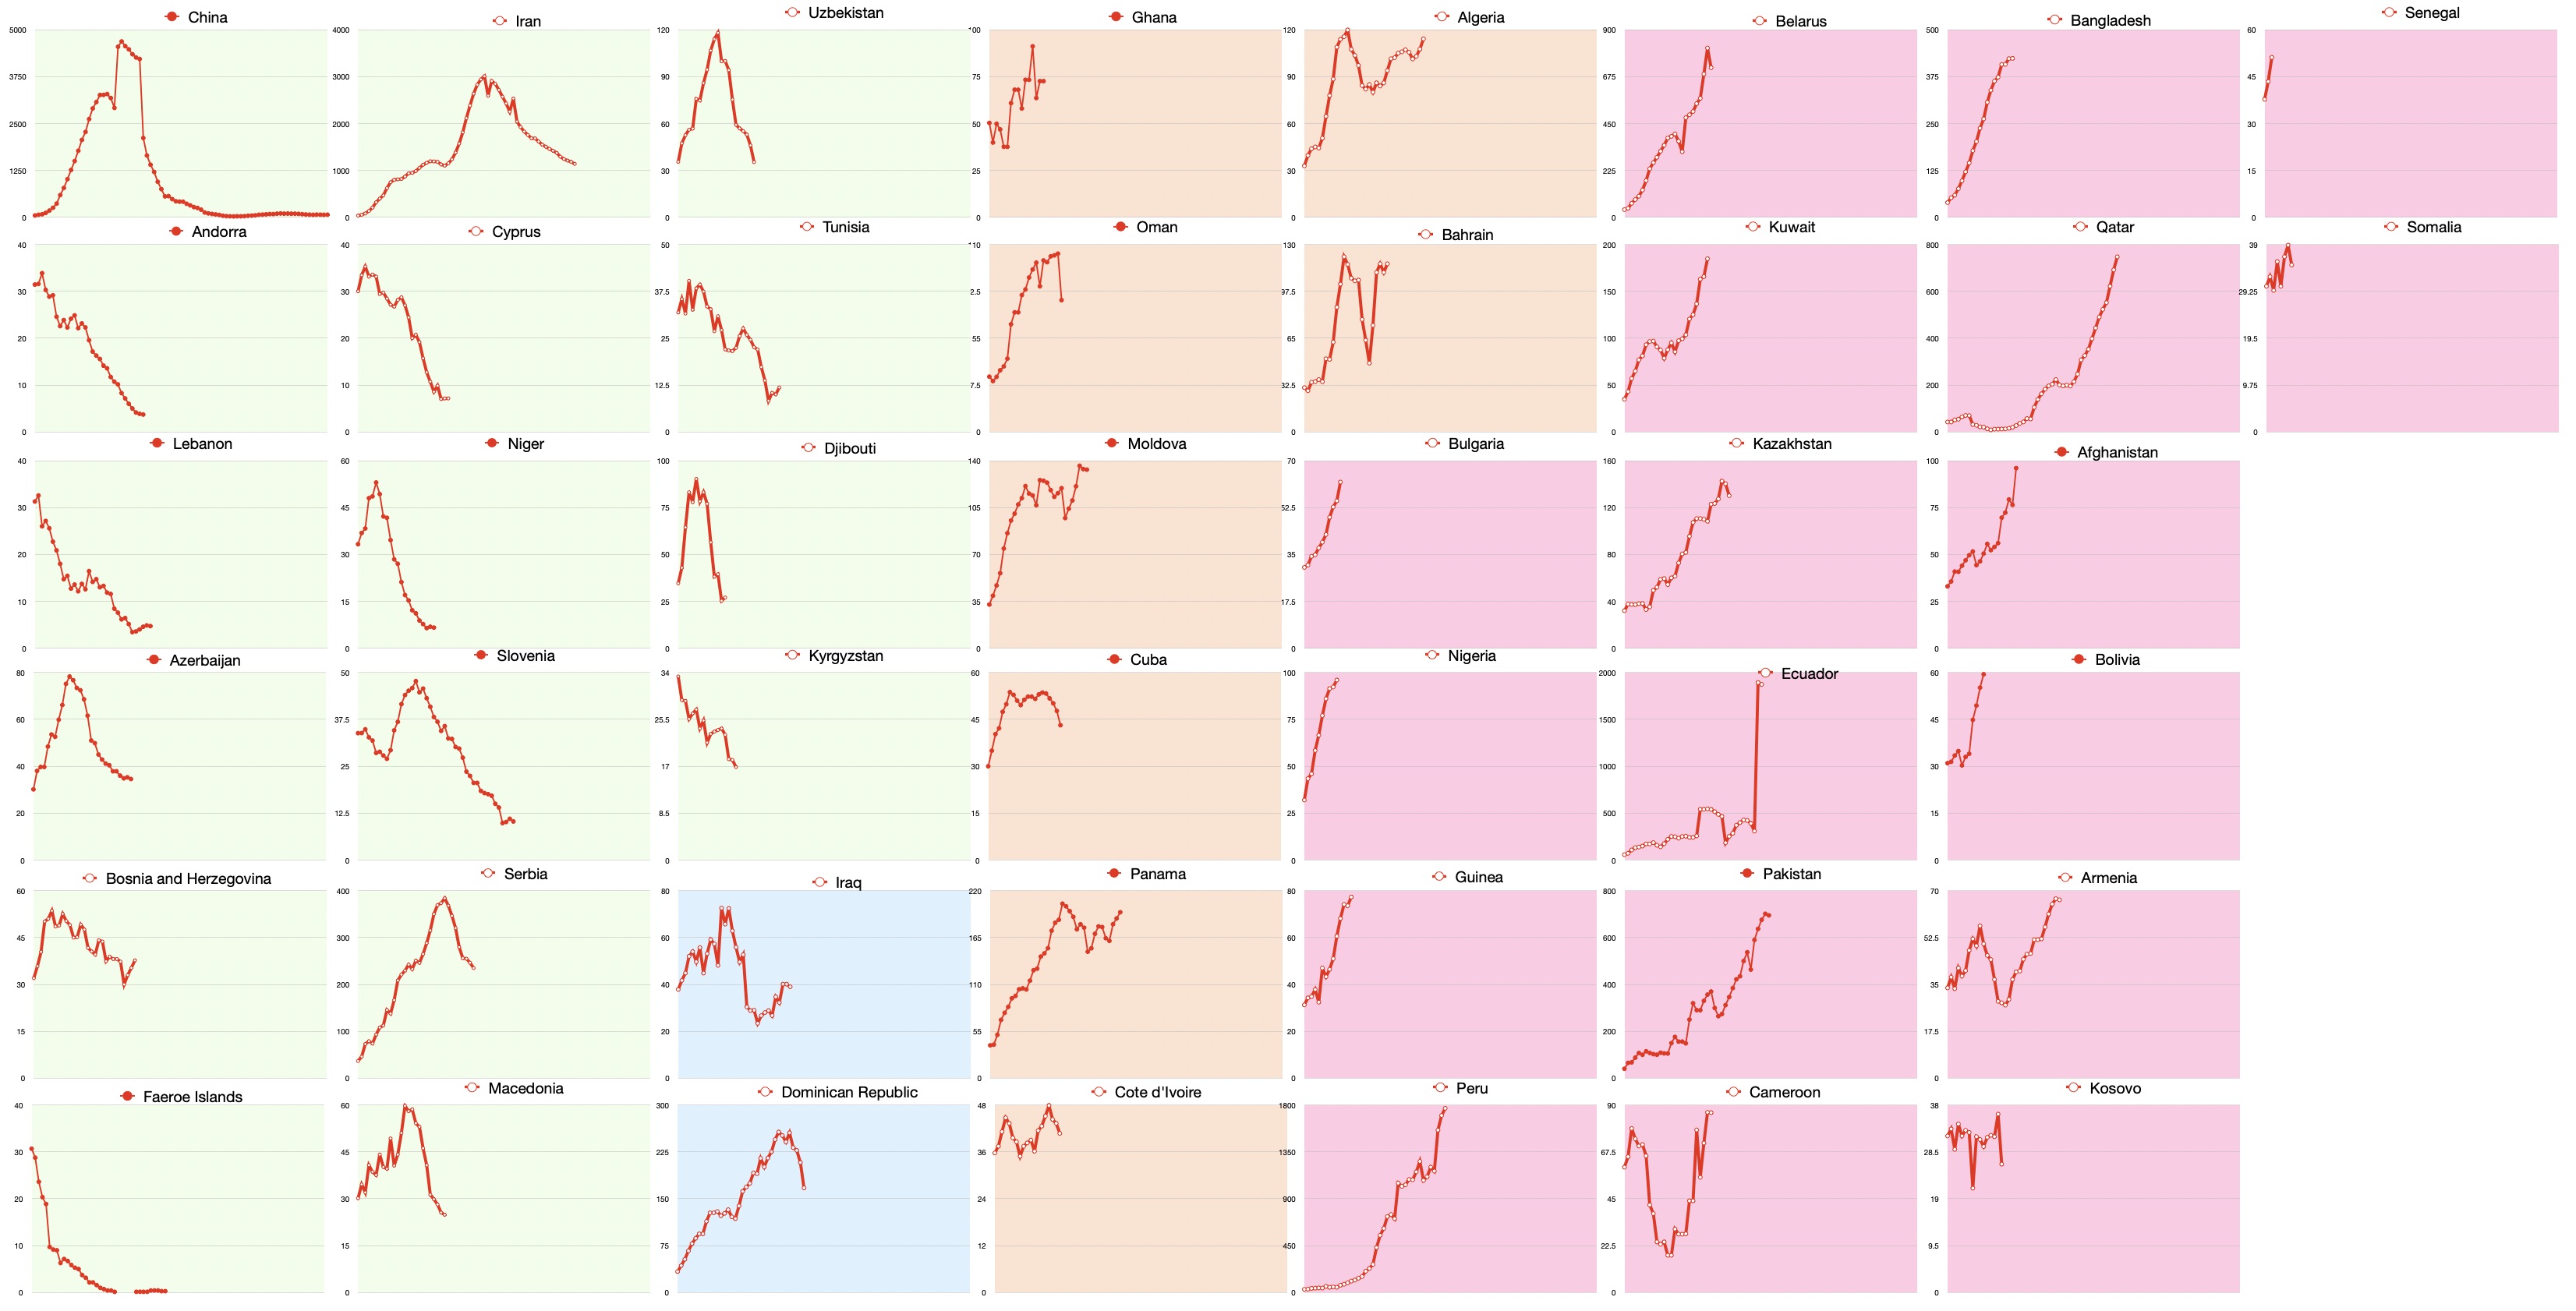
    The Covid-19 case rate for 99 selected countries and the EU. Apple Mobility Trend for 55 countries.

    Background color coding: 

    • Green: Late Stage (>50% post-peak)
    • Blue: Middle-Late Stage (~50% post-peak)
    • Orange: Middle-Early Stage (peaked)
    • Pink: Early Stage [or indeterminate] (pre-peak)
    Red line is case rate in cases/day starting at 30 cases/day. Black line is Stringency Index which is inverse of Apple Mobility Trends (lower bound means no change in mobility, upper bound is zero mobility). All points are 7-day averages. Click on images for higher resolution or download.

    Sources: Cases data from European Centre for Disease Prevention and Control (ECDC) via Our World In Data. Mobility data is sourced from Apple Mobility Trends which tracks change in Apple Maps routing requests.

  5. Covid-19 International Dashboard April 29; 46% Green

    Research

    Join me for #AsymcoFridayNight a discussion of the methodology of predicting Covid-19 infection rates and the Apple financial report for Q1 2020.

    Here are the links to sign up:

    Buy Ticket ($20)

    Click if you can't afford $20

    The Covid-19 case rate for 99 selected countries and the EU. Apple Mobility Trend for 55 countries.

    Background color coding: 

    • Green: Late Stage (>50% post-peak)
    • Blue: Middle-Late Stage (~50% post-peak)
    • Orange: Middle-Early Stage (peaked)
    • Pink: Early Stage [or indeterminate] (pre-peak)
    Red line is case rate in cases/day starting at 30 cases/day. Black line is Stringency Index which is inverse of Apple Mobility Trends (lower bound means no change in mobility, upper bound is zero mobility). All points are 7-day averages. Click on images for higher resolution or download.

    Sources: Cases data from European Centre for Disease Prevention and Control (ECDC) via Our World In Data. Mobility data is sourced from Apple Mobility Trends which tracks change in Apple Maps routing requests.

  6. Covid-19 International Dashboard April 28; Now 100 Countries

    Research

    Join me for #AsymcoFridayNight a discussion of the methodology of predicting Covid-19 infection rates and the Apple financial report for Q1 2020.

    Here are the links to sign up:

    Buy Ticket ($20)

    Click if you can't afford $20

    The Covid-19 case rate for 99 selected countries and the EU. Apple Mobility Trend for 55 countries.

    Background color coding: 

    • Green: Late Stage (>50% post-peak)
    • Blue: Middle-Late Stage (~50% post-peak)
    • Orange: Middle-Early Stage (peaked)
    • Pink: Early Stage [or indeterminate] (pre-peak)
    Red line is case rate in cases/day starting at 30 cases/day. Black line is Stringency Index which is inverse of Apple Mobility Trends (lower bound means no change in mobility, upper bound is zero mobility). All points are 7-day averages. Click on images for higher resolution or download.
  7. Covid-19 International Dashboard April 27; 19% of countries are Pink

    Research

    The Covid-19 case rate for 94 selected countries and the EU. Apple Mobility Trend for 55 countries.

    Background color coding: 

    • Green: Late Stage (>50% post-peak)
    • Blue: Middle-Late Stage (~50% post-peak)
    • Orange: Middle-Early Stage (peaked)
    • Pink: Early Stage [or indeterminate] (pre-peak)

    19% of countries are currently Pink.

    Red line is case rate in cases/day starting at 30 cases/day. Black line is Stringency Index which is inverse of Apple Mobility Trends (lower bound means no change in mobility, upper bound is zero mobility). All points are 7-day averages. Click on images for higher resolution or download.

    Sources: Cases data from European Centre for Disease Prevention and Control (ECDC) via Our World In Data. Mobility data is sourced from Apple Mobility Trends which tracks change in Apple Maps routing requests.

  8. Covid-19 International Dashboard April 26

    Research

    The Covid-19 case rate for 94 selected countries and the EU. Apple Mobility Trend for 55 countries.

    Background color coding: 

    • Green: Late Stage (>50% post-peak)
    • Blue: Middle-Late Stage (~50% post-peak)
    • Orange: Middle-Early Stage (peaked)
    • Pink: Early Stage [or indeterminate] (pre-peak)

    22% of countries are currently Pink.

    Red line is case rate in cases/day starting at 30 cases/day. Black line is Stringency Index which is inverse of Apple Mobility Trends (lower bound means no change in mobility, upper bound is zero mobility). All points are 7-day averages. Click on images for higher resolution or download.

    Sources: Cases data from European Centre for Disease Prevention and Control (ECDC) via Our World In Data. Mobility data is sourced from Apple Mobility Trends which tracks change in Apple Maps routing requests.

  9. Covid-19 International Dashboard April 25

    Research

    The Covid-19 case rate for 94 selected countries and the EU. Apple Mobility Trend for 55 countries.

    Background color coding: 

    • Green: Late Stage (>50% post-peak)
    • Blue: Middle-Late Stage (~50% post-peak)
    • Orange: Middle-Early Stage (peaked)
    • Pink: Early Stage [or indeterminate] (pre-peak)
    Red line is case rate in cases/day starting at 30 cases/day. Black line is Stringency Index which is inverse of Apple Mobility Trends (lower bound means no change in mobility, upper bound is zero mobility). All points are 7-day averages. Click on images for higher resolution or download.

    Sources: Cases data from European Centre for Disease Prevention and Control (ECDC) via Our World In Data. Mobility data is sourced from Apple Mobility Trends which tracks change in Apple Maps routing requests.

  10. Covid-19 International Dashboard April 24

    Research

    The Covid-19 case rate for 94 selected countries and the EU. Apple Mobility Trend for 55 countries.

    Background color coding: 

    • Green: Late Stage (>50% post-peak)
    • Blue: Middle-Late Stage (~50% post-peak)
    • Orange: Middle-Early Stage (peaked)
    • Pink: Early Stage [or indeterminate] (pre-peak)
    Red line is case rate in cases/day starting at 30 cases/day. Black line is Stringency Index which is inverse of Apple Mobility Trends (lower bound means no change in mobility, upper bound is zero mobility). All points are 7-day averages. Click on images for higher resolution or download.

    Sources: Cases data from European Centre for Disease Prevention and Control (ECDC) via Our World In Data. Mobility data is sourced from Apple Mobility Trends which tracks change in Apple Maps routing requests.

  11. Covid-19 International Dashboard April 23

    Research

    The Covid-19 case rate for 94 selected countries and the EU. Apple Mobility Trend for 55 countries.

    Background color coding: 

    • Green: Late Stage (>50% post-peak)
    • Blue: Middle-Late Stage (~50% post-peak)
    • Orange: Middle-Early Stage (peaked)
    • Pink: Early Stage [or indeterminate] (pre-peak)
    Red line is case rate in cases/day starting at 30 cases/day. Black line is Stringency Index which is inverse of Apple Mobility Trends (lower bound means no change in mobility, upper bound is zero mobility). All points are 7-day averages. Click on images for higher resolution or download.

    Sources: Cases data from European Centre for Disease Prevention and Control (ECDC) via Our World In Data. Mobility data is sourced from Apple Mobility Trends which tracks change in Apple Maps routing requests.