What I argued then was that of the problems that Apple had the means to fix, production was what most needed fixing.
Since then we've seen evidence of significant investment in manufacturing tooling, where Apple is effectively purchasing the means of production rather than just renting or contracting it out. This capital equipment investment is the equivalent of owning one of the three asset classes that make up a manufacturing operation:
Tooling or capital equipment. The "Capital" at the root of the concept of "Capitalism".
Skills, talent and knowledge. This is the softer kind of asset that turns out to be harder to replace or buy.
Labor pool. Although considered a commodity even unskilled labor is difficult to obtain if flexible employment is needed in a regulated environment.
It did not stop there. It has also used capital to ensure capacity through pre-orders thereby allowing the skills and labor to be more predictably applied by its suppliers (and preventing competitors from having sufficient supplies). Apple has also taken control of chip design for the vast majority of its CPUs thus building a more bespoke supplier chain.
However these are not enough steps to make production "good enough" to meet the demands of a billion customers buying a new product every other year.
An insidious problem emerges when outsourcing: suppliers tend to become competitors. It happened in the PC industry with Acer vs. Dell. But it's also happening to Apple. Consider how Samsung's foreknowledge of Apple's orders allowed them to anticipate the demand for large screen smartphones. Receiving orders years in advance for memory, screens and CPUs in the hundreds of millions would be a clear indication of demand. Receiving funds with which to build capacity is an enormous help when turning on production for your own versions of the product.
With that knowledge and the capacity built to serve Apple, Samsung was able to go from near zero market share in smartphones to being the largest vendor in two years a feat that Apple itself could not accomplish.
The supplier-turned-competitor is one of the risks of outsourcing production and is at the root of disruption from value chain evolution.
And next year we are going to bring some production to the U.S. on the Mac. We’ve been working on this for a long time, and we were getting closer to it. It will happen in 2013. We’re really proud of it. We could have quickly maybe done just assembly, but it’s broader because we wanted to do something more substantial. So we’ll literally invest over $100 million. This doesn’t mean that Apple will do it ourselves, but we’ll be working with people, and we’ll be investing our money.
For the first time since the 90s, Apple is taking steps to control the last pieces of the value chain it participates in.
It's a baby step and perhaps it's going to remain symbolic, but one can imagine a trajectory for this effort which will pay off as well as retail has paid off ten years after the first Apple store opened.
–
Looking for more information on the renaissance of production and its effect on the technology industries? Then come to Asymconf and take part in the debate.
The latest yearly report from Apple includes, as it has in the past, the forecast of Capital Expenditures. I've been tracking this data as an indicator of both strategic intent and potential forecasting tool for iOS device production.
Before exploring Apple's own forecast, we should look at how they met expectations for fiscal 2012.
In October 2011 the company forecast was as follows:
The Company anticipates utilizing approximately $8.0 billion for capital expenditures during 2012, including approximately $900 million for retail store facilities and approximately $7.1 billion for product tooling and manufacturing process equipment
The Company’s capital expenditures were $10.3 billion during 2012, consisting of $865 million for retail store facilities and $9.5 billion for other capital expenditures, including product tooling and manufacturing process equipment, and other corporate facilities and infrastructure. The Company’s actual cash payments for capital expenditures during 2012 were $8.3 billion.
There are two points that need to be highlighted:
Expenditures overall were $2.3 billion higher than forecast. Nearly all of the over-spending was for "product tooling, manufacturing process equipment and infrastructure". Retail was planned at $900 million and actual was $865 (an under-spend of $35 million). As no major real estate assets were acquired (change in those assets was $380 million, less than 2011 or 2010) the "deficit" in budgeted expenditures can be attributed entirely to product tooling and manufacturing process equipment.[1] The $2.3 billion spending over expectations amounts to 34% of forecast.
The cash payments for capex were $2 billion lower than expenditures. This is a curious situation which was not highlighted in previous 10 K reports. What this implies is that much of the "over-spend" was not paid for though cash and since no new debt was booked it's likely to have been paid for through some form of vendor financing. I'll explore some explanations below.
So it's important to note that the company spent a great deal more (one third more) than expected and paid for some of the acquisitions through uncharacteristic or unorthodox means.
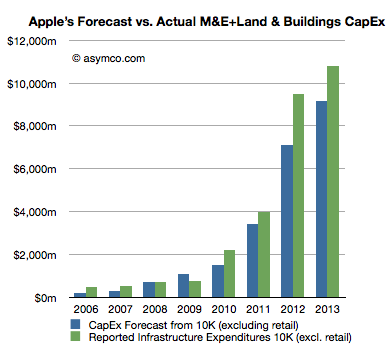
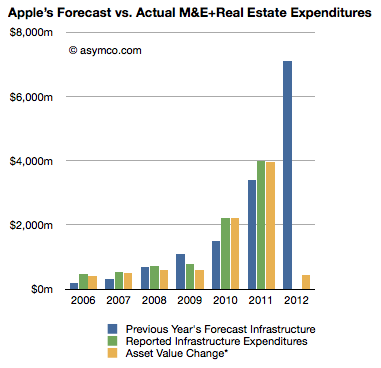
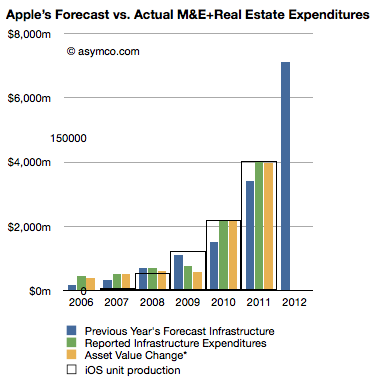
The historic budgeting for Machinery & Equipment (+Land & Buildings) is shown in the following graph:
I included the forecast for 2013 ($9.15 billion) and added 18% to estimate 2013 actual spend.
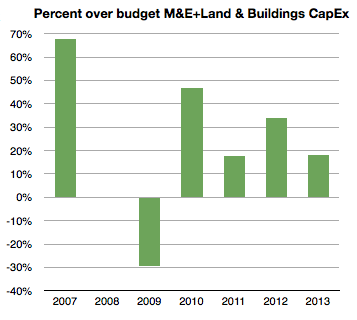
The percent over/under budget (percent difference between green and blue bars above) is shown below:
[Again, note that I took the liberty of forecasting 2013 over-spending at 18% or $10.8 billion.]
Note that 2008 and 2009 were either on target or below target. The recession of 2008/2009 might have had something to do with that. The under-spending situation of 2009 was made up for during 2010 with over 45% extra spending. 2011 came in at 18% over and 2012, as already noted, was 34% over budget. I then suggest that 2013 will be at 18%, same as in 2011.
When seen in this historic context, the increase of 2012 is even more dramatic. Apple overspent in 2012 more than it spent overall two years earlier. 2012 spending on M&E (and Land) was up 138% sequentially and nearly seven times the level of three years ago.
With this splurge in mind it's necessary to think about that second noteworthy point above. There is evidence that at least some of the $2.3 billion over-budget was unanticipated and came late in the year. We saw the surge in spending in FQ4 from the gross asset value change data. The question is what was it spent on and why did it not go through the cash flow statement?
Circumstantial[2] evidence points to the asset being production equipment (or even a whole plant) previously owned by Sharp. Sharp is a key supplier of screens to Apple but is also in financial distress. Sharp has also been the object of an intended investment by Foxconn [Hon Hai]. That deal fell through as Sharp's finances deteriorated. My guess is that these attempts to shore up Sharp are directed by Apple to ensure both continuity of supply and a balanced supplier base (offsetting Samsung, another supplier.) If Sharp were to enter into some form of bankruptcy, the key plant(s) used in producing screens for Apple might be "up for grabs" by creditors and they might be taken off-line, jeopardizing Apple's production capacity, irrespective of contractual obligations. I believe that Apple's late and unprecedented expenditure was to secure this asset. I further believe that the financing for this deal was done through a swap of "pre-orders". Stepping even further into the hypothesis, I believe Apple arranged to move a Sharp screen production line onto its books and "paid" for it through a pre-payment of components. This being a pre-payment it would be in the form of an "off balance sheet" commitment. Apple reported that "As of September 29, 2012, the Company had outstanding off-balance sheet third-party manufacturing commitments and component purchase commitments of $21.1 billion" [my emphasis]. This is a significant increase from earlier years and allows for a huge "slush fund" to cover asset swaps.
If we take the timing of this expenditure into consideration, I consider it reasonable to assume that 2013 spending is lower by this amount. In other words, I think that about $2 billion, including the Sharp plant, may have been "brought forward" by a few months from 2013. If the company had spent more on schedule and on budget (i.e. with an over-spend of 15% rather than 34%) it would have spent about $8.2 billion. Therefore, as next year's forecast is for $9.15 billion and as I would also expect an over-spend of 18% or $10.8 billion total, adding the brought-forward $2 billion would imply sequential growth from $8.2 to $12.8 or 56%.
This is in contrast to the indicated change of $9.5 billion (actual) to $9.15 billion (forecast), or decrease of 4%.
So, recapping the CapEx story, the company over-spent far more in 2012 than anticipated. It did so late in the year. It did it while a supplier was in distress and another's supplier's efforts in rescue failed. Furthermore, it indicated a modest and thus uncharacteristic increase in the next year's CapEx budget. My take is that the trajectory of investment is not being altered dramatically but it's had an adjustment in timing, a kink in the line. The overall story remains that Apple is still injecting vast and growing amounts of capital into production and placing those assets on its own balance sheet.
---
Notes:
I track this spending through asset value changes in the balance sheet. That change in value excludes depreciation which turned to to be substantial in 2012: $2.44 billion.
What follows is strictly hypothetical and based only on pieces of evidence that have become public hinting at an explanation but there is no proof.
In previous posts I described the patterns of asset value growth for Property Plant and Equipment at Apple and how that change has been thus far correlated to the production of iOS devices.
The analysis was based on looking at the declared value of the PP&E assets on Apple's balance sheet. These values include depreciation so they reflect not only the "spending" on new assets but also the value lost due to wear and tear. As such it's not a perfect measure of investment.
The better approach is to use declarations on the cash flow statement. Apple reports a specific cash flow related to PP&E: Under Investing Activities, Payments for acquisition of property, plan and equipment.
In the latest 8-K the amount for the 12 months ended September 29 the value was $8.295 billion.
Compare this with the statement in the Annual Report from one year ago:
The Company anticipates utilizing approximately $8.0 billion for capital expenditures during 2012, including approximately $900 million for retail store facilities and approximately $7.1 billion for product tooling and manufacturing process equipment, and corporate facilities and infrastructure, including information systems hardware, software and enhancements.
Compare also with the PP&E net asset value on the Balance Sheet currently at $15.452 billion but valued at $7.777 billion a year ago (an increase of $7.7 billion).
This means that Apple intended to spend $8 billion, actually spent $8.3 billion and realized a net asset gain (after depreciation) of $7.7 billion.
So there are no major surprises. The spending was only about 4% above expectations a year earlier.
The other pattern to observe is that the spending rose dramatically into the fourth quarter. The fiscal quarterly spending was:
$1.32 billion
$1.46 billion
$2.06 billion
$3.46 billion
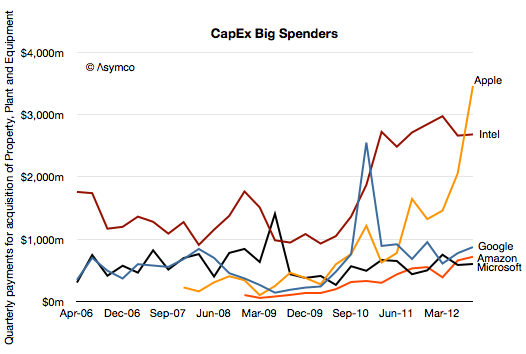
I illustrate this pattern (and previous quarterly spending) in the following chart.
The question remains what is this $8.3 billion being spent on?
To help answer I also added the comparable spending (from cash flow statements) of a few other technology companies. Google, Amazon and Microsoft have been spending in the same range of $500 million per quarter. Over the past eight quarters the average spending of these companies has been:
Amazon $487 million
Microsoft $583 million
Google $800 million
Intel is different. Its average spend level has been $2.6 billion/quarter.
But Apple has just spent about 30% more than Intel. And it spent three times in Q3 than Google, 4.8x Microsoft and 3.8x Amazon.
The level of spending and growth from a far lower level implies to me that Apple is spending primarily on process equipment (aka tooling) rather than servers. Data centers are expensive at $1 billion for a large one, but they are not being built fast enough to account for $3.5 billion in one quarter.
Note that Apple's CapEx is above that of Intel whose fab-based semiconductor production method is known as particularly capital intensive. And Intel's Capital Expenditures have been increasing to all-time highs.
If Apple spent at Google levels on server infrastructure it would only be spending a quarter of what it's actually spending. If Apple spent on production at Intel levels it would only be spending three quarters of what it's spending.
In other words, Apple is spending at the equivalent of one Intel of fabrication and one Google of server infrastructure.
In a few days we will learn what the plan for expenditure for fiscal 2013 is. Historically, the company has roughly doubled spending for each year of the iOS platform. If that continues then Apple will be spending the equivalent of several Intels and several Googles.
We can put all of our products on the table you’re sitting at. Those products together sell $40 billion per year. No other company can make that claim except perhaps an oil company.
We are the most focused company that I know of, or have read of, or have any knowledge of.
We say no to good ideas every day; we say no to great ideas; to keep the number of things we focus on small in number.
Since then the only product that has been added to the kitchen table has been the iPad. The sales level however, has increased in proportions shown in the chart below.
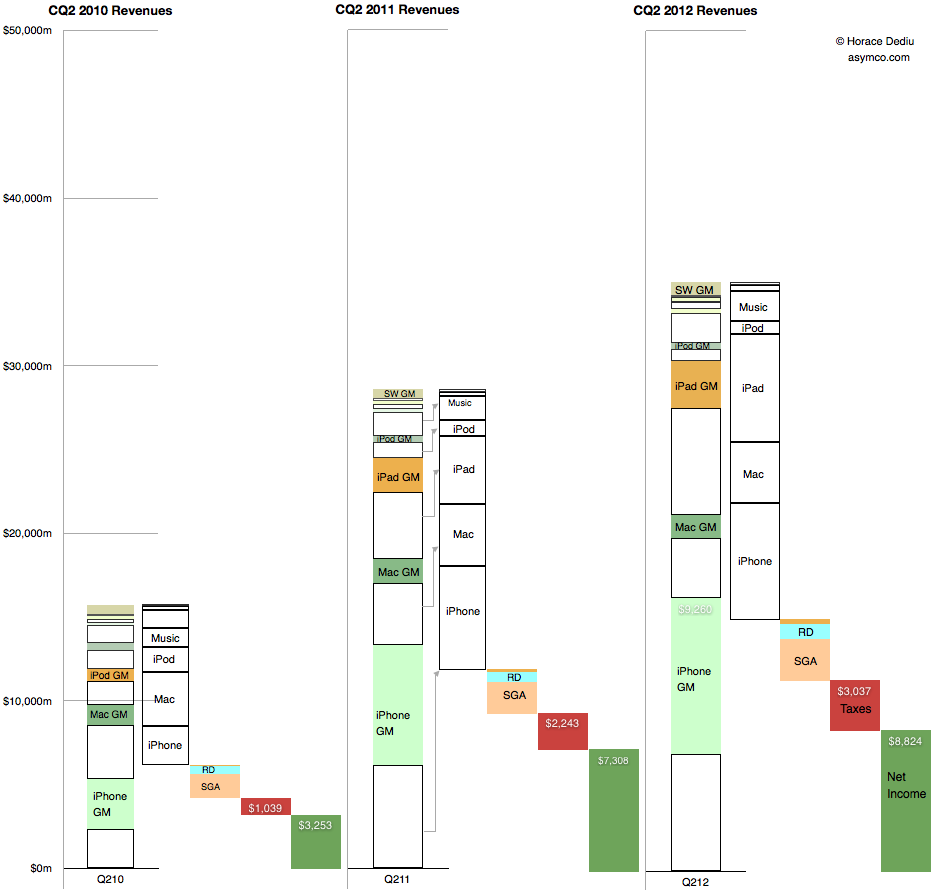
The revenues are shown with their contributory products and the costs of those products. The payments for costs of sales as well as R&D, SG&A and Taxes are then subtracted revealing the Net Income (in green). This is done for the second quarters of 2010, 2011 and 2012.
Since Tim Cook made the analogy, the table holding the products has not gotten any bigger but the sales level has more than doubled while profits have nearly tripled.
In his talk he cited revenues of $40 billion (for the pervious year, 2009). In the last twelve months Apple's revenues were $148 billion.
Tim Cook went on:
I think this is so ingrained in our company that this hubris you talk about that happens to companies that are successful and sole role in life is to get bigger, I can tell you the management team at Apple would never let that happen. That's not what we're about. [We have a] Small list of things to focus on.
The irony is that by thinking small, Apple became the biggest company that ever was.
The trick to thinking small is the same as that of "focusing" which means saying no, a lot. I touched on this in February 2011. Focusing is the willful rejection of the Nobel-prize winning theory of portfolios.
From the wiki link above,
Diversification eliminates non-systematic risk, but at the cost of increasing the systematic risk. Diversification forces the portfolio manager to invest in assets without analyzing their fundamentals, solely for the benefit of eliminating the portfolio’s non-systematic risk (the CAPM assumes investment in all available assets). This artificially increased demand pushes up the price of assets that, when analyzed individually, would be of little fundamental value. The result is that the whole portfolio becomes more expensive and, as a result, the probability of a positive return decreases (i.e. the risk of the portfolio increases).
This theoretical view into asset management applies in spades to product portfolio management. The idea that it's better to spread one's bets and cover all segments is "safer" has been thoroughly debunked by Apple.
Understanding the "fundamentals" of a product is far more important than having lots of products for the sake of diversification alone.
The fundamentals of a product are knowing its job to be done and thus its requirements which, when well executed, will position it precisely and unambiguously on an opportunity.
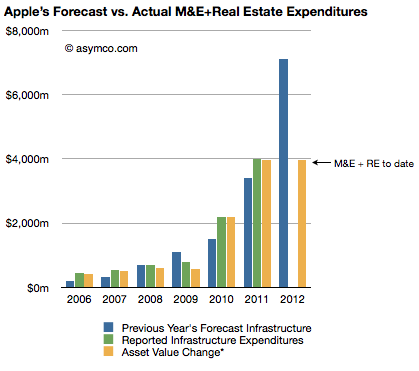
The Company anticipates utilizing approximately $8.0 billion for capital expenditures during 2012, including approximately $900 million for retail store facilities and approximately $7.1 billion for product tooling and manufacturing process equipment, and corporate facilities and infrastructure, including information systems hardware, software and enhancements.
The history of these expenditures is shown below (the blue bars are statements from 10K reports including the one above shown as the right-most bar):
Three 10Q reports so far this fiscal year have given us updates on asset values and the change in these values are shown as the right-most yellow bar. The asset value change suggests $3.9 billion has been spent so far of the $7.1 billion budgeted. Thus we can estimate that about $3.2 billion remains to be spent in the fourth fiscal quarter (thus bringing the yellow bar to parity with the blue bar in the chart above--a parity that was achieved or exceeded for five out of the last six years).
Assuming $200 million of the fourth fiscal quarter budget will be for land and buildings[1] results in an estimated $3 billion remaining for product tooling and manufacturing process equipment and data centers.
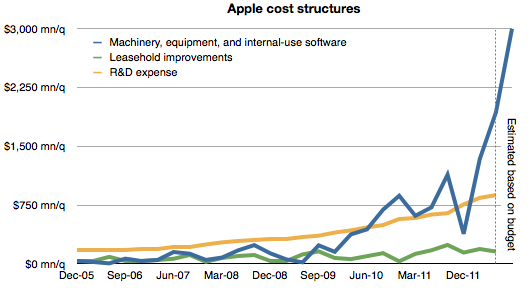
The history of spending for various cost centers is shown below.[2]
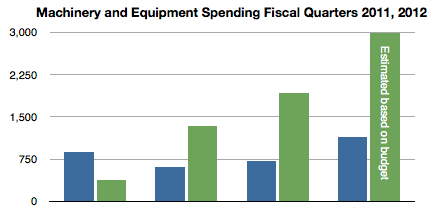
Note again the forecast for the fourth quarter based on budget given last October. Also shown below is the spending on machinery and equipment by quarter for the fiscal years 2011 and 2012 including the estimate for FQ4 2012. (Blue bars represent 2011 quarters and green represent 2012.)
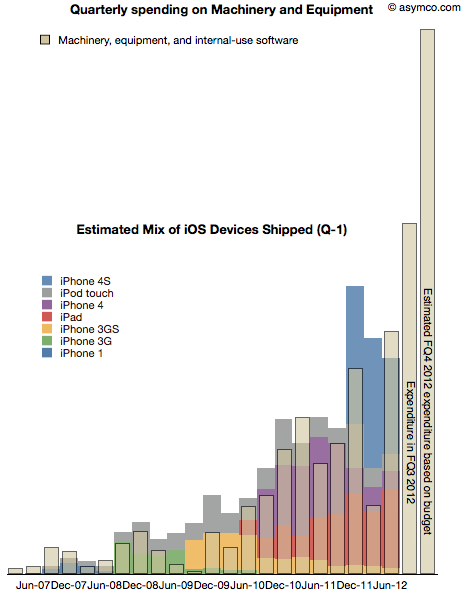
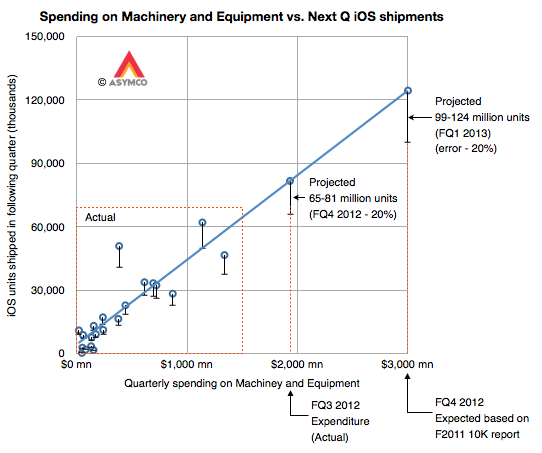
As discussed previously, spending on machinery and equipment has shown a strong correlation with the output of iOS devices in the following quarters. The following chart shows the superposition of M&E spending in a given quarter and iOS output in the following quarter.
Note that due to the time-shifting the Expenditure for FQ3 does not have a corresponding output--expected in FQ4--and that FQ4 expenditure is estimated based on budget.
With this data in place, we can now begin to answer the question of what are the total iOS device shipments expected in the current (ending September) and the following (ending December) quarters.
Our eyes are pretty good at seeing patterns in data so perhaps it would suffice to know the scale to the graph above and thus fill in the colored output bars to match the spending. But to make it a bit more precise, I drew the following chart:
It shows the same data but as an X-Y scatter plot where the X axis is quarterly spending and the Y axis is iOS unit shipments. Note that the actual data points are in the lower left area delineated with a dashed red rectangle.
I drew the blue line corresponding to an assumed linear relationship between the two variables to project the iOS output based on additional expenditures for FQ3 and FQ4.
I used error bars of -20% to show a possible conservative range.[3]
This yields an iOS output of approximately between 65 and 80 million units in the current quarter and 100 to 125 million in the fourth calendar quarter. The sum of the low ends of this estimate is 165 million units.
My current forecast is 53 million units in CQ3 and 110 million units in CQ4 which, together, add up 163 million. Close enough.
Stay tuned for a padcast report with more details on this approach.
---
Notes:
The company spent $31 million, $66 million and $159 million for the first three quarters on Land and buildings. $200 million in the fourth quarter seems reasonable unless there is a pending large land deal closing in the next two months.
I added leasehold improvements as a proxy for store openings and R&D expense as a proxy for overall product development. These are in contrast to expenditures for product production and support which are represented by Machinery and Capital Equipment.
At the end of 2011 Apple's net property, plant and equipment (PP&E) was $7.8 billion. This reflects $12.34 billion gross PP&E net accumulated depreciation and amortization of $4.5 billion. The depreciation and amortization increased by a total of $533 million and the gross PP&E increased by only $572 million. I say "only" because in the previous quarter PP&E increased by $1.42 billion. If we assume that this growth is equivalent to capital expenditures for the quarter, it's also a very small amount given the company's stated intentions to spend $7.1 billion during the fiscal year.
The gap is illustrated in the following chart:
The blue bar in the 2012 year represents the company's stated intentions (from the 10K). The Yellow bar in 2012 is what has been spent so far as measured by the change in reported asset values. Given that the company has been exceeding their targets lately, one should expect the yellow bar to reach as high as $8 billion after another three quarters.
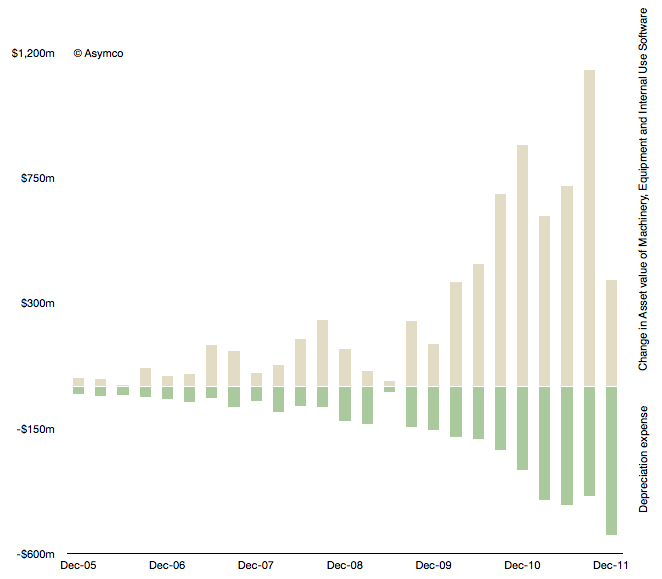
Another view into this data is provided by the following chart.
The beige bars represent the quarterly change in asset value and the green bars are the depreciation expenses for the same quarter. This view also shows a significant slowing in spending.
In the past I showed that CapEx, especially spending on machinery, equipment and internal-use software correlates with iOS device production during the next quarter. It's not a relationship that helps much in quarterly predictions due to the elastic nature of product transitions. There were quarters when spending and output were de-coupled, for example spending in March and June 09 quarters was far lower than one would expect for the 3GS launch quarters that followed.
We will have to keep an eye on the change in asset value to be reported for CQ1 to see how the spending ramps up during the year. At this time the company needs to spend at least $6.5 billion in three quarters or over $2 billion per quarter to meet its target for the fiscal year (ending October this year). We have to see whether and why Q1 (fiscal) was too low.
This discussion is also affected by the discussion on Apple's other balance sheet item: cash and cash equivalents. The magnitude of its assets is staggering: $100 billion in cash, $7.8 billion in PP&E, $3.47 billion in acquired intangible assets (mainly patents), and $896 in Goodwill (acquisitions). With this much "capital" the company does not make use of any debt facilities.
In this regard Apple is also an apparent anomaly. As it gets subtracted out of indexes because it weighs too much or skews "reality" so Apple and its balance sheet is causing a warp in "time-space" of capital markets. The traditional relationship between financiers and operating companies assumed some form of symbiosis but as the credit crisis has shown some have not kept their part of the implied bargain.
So we have to ask yet another unsettling question: what is the value of capital markets when their products are commoditized by relatively unsophisticated CFOs?
---
Notes:
This is the material accompanying the third case discussion at Asymconf. Participants are encouraged to read it at the material linked before the show.
In his third “The Critical Path” podcast, Horace Dediu explained how Apple’s cash can be viewed as a strategic option, an opinion that resonated also with other analysts [1]. Cash is one of the most flexible resources as it can convert quickly into other resources such as brands, companies, technologies, people and even processes. More cash means more strategic flexibility. The large cash reserve Apple has accumulated provides high flexibility for future investments. These characteristics of cash already imply an intrinsic option value. But how big is this value?
Calculating Option Value
To help us determine, I will apply the Black-Scholes model. The model has two key characteristics that are applicable to valuing the option character of Apple’s cash. First, the simple form of the calculation excludes dividends and, as far as we have seen, there is no new information available that would suggest that Apple will pay dividends in the near term. Second, it implies that the option can be exercised at any given time until the end of the option exercise period - just like any buying or investment decision made by consumers. Lastly, we will assume that Apple’s cash (including short-term and long-term cash as well as financial investments) is instantly available. Although large amounts are held by foreign subsidiaries or are invested in maturities longer than one year, we can overcome these practical issues by borrowing against it. As we are interested in the value of the whole pile, we use the latest reported figure of $81.6 billion as the strike price (or exercise price).
What other inputs do we need to determine the option value of Apple’s cash [2]?
Volatility: A measure that determines financial risk of a certain asset. Apple’s share has shown a volatility of 26,1% over the last year.
The risk free rate determined by the 10 year US governmental bond interest rate: 1,96%.
A timeframe in which the option can be exercised. Let’s assume a 10 year timeframe in line with the risk-free rate and an imaginable horizon for mere mortals.
The value of the underlying (or what Apple is investing in):
The return of the investment exercised with the cash at hand should yield a higher Return on Capital Employed (RoCE) than previously achieved to increase shareholder value. On the other hand, such a high cash pile also provides the flexibility to invest into lower return ventures. Such an investment would be taken if a certain technology or trend has been missed by management or becomes suddenly more important in the priorities of the company. In defensive moves or moat creating ventures, the expected return would be significantly lower or can even be negative. For the last twelve months, Apple has returned 106% in terms of operating income over its capital employed [3]. I use the return to value the underlying. For example, investing $81.6 billion in assets that yield 106% return equals a underlying value of $168 billion.
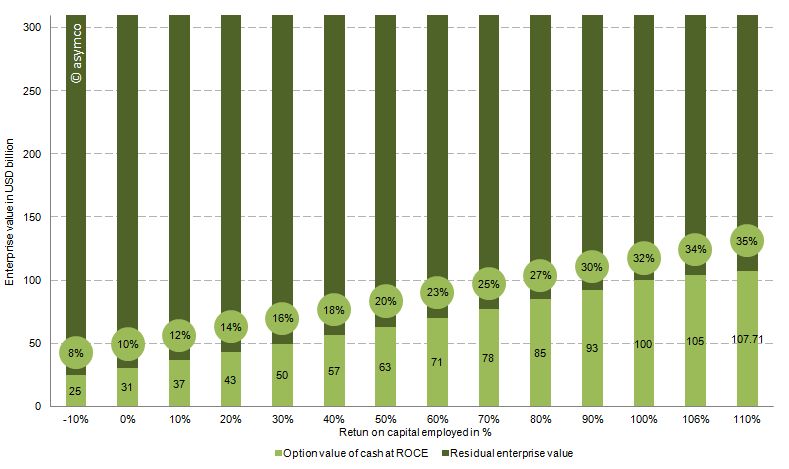
The chart below shows the option value of the cash as a percentage of enterprise value of Apple (at the time of writing $310 billion) based on the range of the expected return on capital employed. Or in other words, how much of Apple’s current value is explained by the option value in holding such a large cash reserve.
Conclusion
Therefore, with the assumptions above and a RoCE from -10% to 110%, between 8% and 35% of Apple’s current valuation is explained by the option value of cash. We can see that even with large variations of the key input variables, Apple’s enterprise value is partly explained by the option value of cash which, in turn, is attributable to the sheer amount of cash at hand.
If we look at the option value explaining 25% of Apple's enterprise value then 75% or $232 billion is the "Residual Enterprise Value" (REV) representing the value of Apple's cash flow generating operations. That puts Apple's valuation at 6.9x REV/EBIT 2011 or 6.5x REV/EBITDA 2011 -- fairly low relative to recent performance. EBITDA and EBIT have been growing at a rate of 70% for the last two years and at a rate of 84% over the last year alone.
It’s good to be king (http://5by5.tv/criticalpath/3) , Apple: Behold The ‘iEndowment,’ Says Wedgewood (http://blogs.barrons.com/techtraderdaily/2011/09/20/apple-behold-the-iendowment-says-wedgewood/)
Operating income of the last twelve month of 33.8 USD billion divided by capital employed of 31.8 USD billion defined as total assets minus cash (or sum of all asset excluding cash)
Prior to the third quarter earnings report I discussed a part of Apple's balance sheet related to tangible assets (Plant, Property and Equipment). In a series of three posts I covered the Land and Buildings (data centers and campuses), Leasehold Improvements (store investments) and Machinery, equipment (tooling and factory equipment as well as servers.)
The data shows that there is a consistent pattern of investment in pursuit of strategic goals: extending reach into distribution through stores, extending services through cloud infrastructure spending, and extending control over the supply chain. One story that still remains largely untold is how much does Apple know in advance what it will spend.
In other words, can we tell if Apple can anticipate demand and does it plan its expansion well in advance?
For an answer, the 10 K report comes in handy. Published only once a year, this document shows some data that is not present in any other public release. For example, Apple makes forecasts for capital spending.
But first, an update.
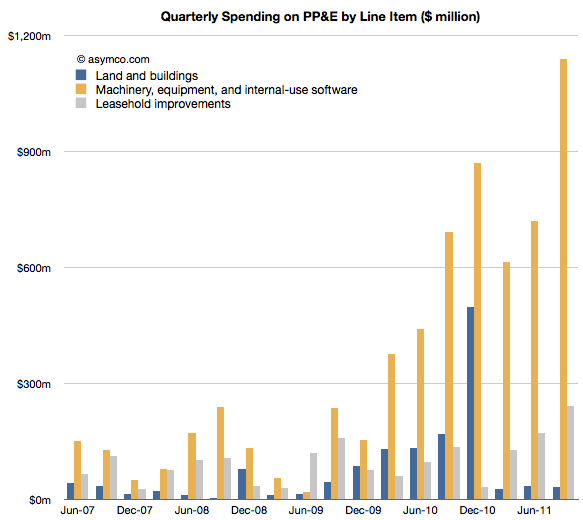
Since the last discussion on PP&E, Apple reported third calendar quarter data. The 10K offers the details on how much was spent in the last quarter. Leasehold improvements increased by 240 million, a new record high. That might have gone into the 30 new stores opened in the quarter but it also signals more openings and renovations still to come.
Land and buildings did not see any significant increase ($31 million).
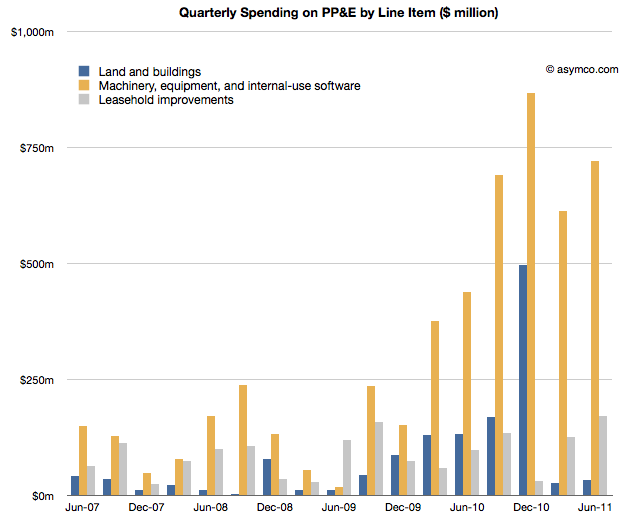
Machinery and Equipment growth was explosive. Over $1.1 billion was added to the value of those assets. The previous high was $868 million in Q1, presumably getting iPad and iPhone production ramped. The total for Q3 is about half of what was spent in all of 2010. The chart below shows the three items:
The increase in M&E foreshadows increased device production so, while not very precise, it gives an idea that volumes are expected to be substantially higher in the following quarter. More about this when I make my forecast.
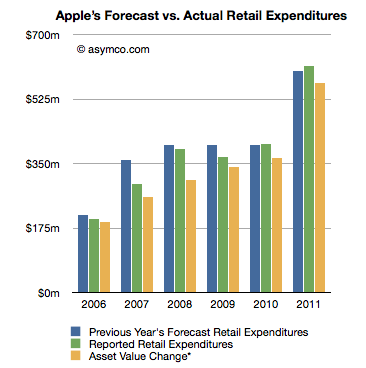
Now I want to focus on Apple's ability to forecast its own production. As I mentioned, once a year, Apple predicts its CapEx. That prediction is broken down further by Retail expenditures and M&E+Real Estate. Let's look at Retail first.
The following chart shows three bars: a previous year's forecast (from the 10K), reported expenditure (from the next 10K) and my own running estimate based on asset value changes.
If we consider the forecast as a "budget" for the next year, what can be observed is that the spending was closely "within budget".
Going by reported expenditure, the company was within 1% of expected budged for store spending in 2010 and 2% in 2011. It underspent for the years 2006 through 2009, though again, but modest amounts.
What this suggests to me is that store roll-outs are predictable for Apple. The costs involved are also quite predictable and things seem to be happening on schedule. The retail expansion is a steady slog.
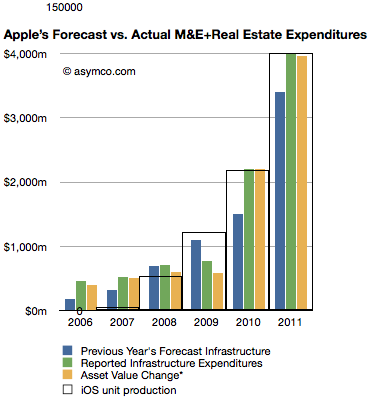
The next chart does the same comparison but with Machinery and Equipment and Real Estate.
Here the story is different. The company has typically over-spent what it forecast.
Here are the "deficits" for this asset class by fiscal year:
2006: 154%
2007: 68%
2008: 0%
2009: -30% (surplus)
2010: 47%
2011: 18%
This suggests that unlike retail, production for Apple has been far less predictable and that the predictions for spending were mostly lower than actuals. It might imply that production was higher than expected as well.
What this analysis suggests overall is that although production (and spending) are increasing, the rate of increase is a bit higher than what Apple expects a year in advance. Some of that might be due to increased costs, but some may be due to changes in capacity.
Note the iOS unit production "wireframe" bar chart overlaid on the expenditure chart. As with quarterly data, the yearly (fiscal) production ramps remarkably consistently with M&E expansion.
Looking forward, the company predicts $8 billion in PP&E, exactly twice what it forecast last year. Retail expansion is forecast at $900 million an increase of 50% and "Infrastructure" (M&E) increase of 110% to $7.1 billion.
Knowing that Apple tends to over-spend on M&E, we can assume that they will at least double spending on machinery and equipment. Knowing further that increase in M&E spending correlates to iOS device production (see chart at left noting the inset scale marked with 150 million units), it implies that iOS device production is set to continue growing at the same rate it always has: 100%.
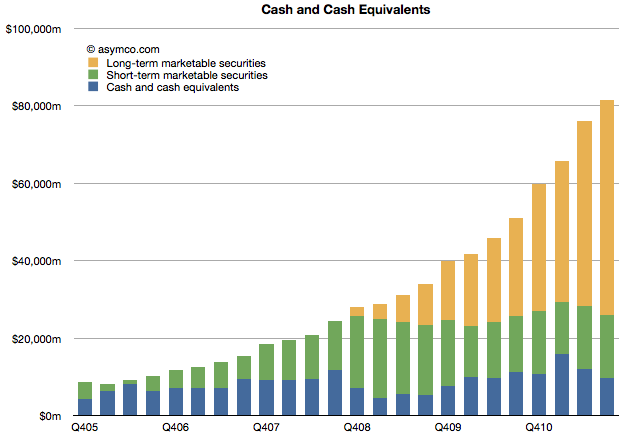
Apple's Cash and Marketable Securities has been the focus of attention for many year now. It has now reached $81.6 billion equivalent to a value of $86.8 per diluted share. Currently each share is worth about $393 making the enterprise value $306/share or 11 times last twelve month's earnings.
The division of liquid cash and cash equivalent asset types is shown in the following chart.
The company added $5.4 billion to its cash reserves during the quarter and now keeps two thirds of that outside the US. Long-term securities (bonds mainly) are now also about two thirds of total. Both of these ratios have increased this year. Some of this shift may be explained by changes in the strategy employed by the CFO/treasurer, but there is another set of assets that has changed dramatically and may explain the change in cash allocation.
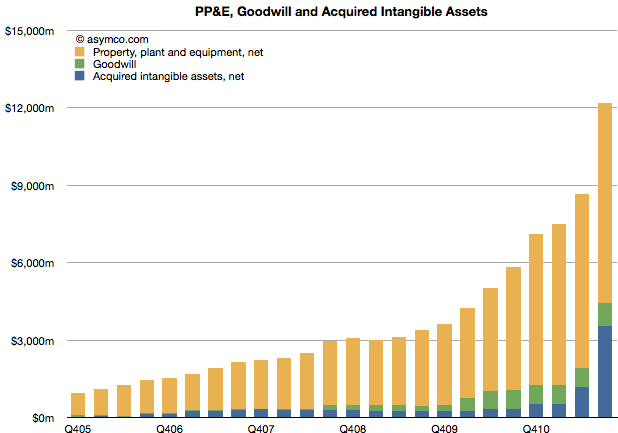
I've written about the PP&E assets and their dramatic increase, but the "Acquired intangible assets" have also had a huge increase in the last quarter ($2.3 billion). Much of that is attributed to the acquisition of Nortel's patents.
Unlike cash, these assets can be considered an "investment" by the company. They are expected to (but may not) return value to shareholders in excess of the average cost of capital. Therefore, they demonstrate that some of Apple's capital is being "put to work" rather than resting idle as many suggest. Apple is buying patents and companies and intellectual property. $12 billion worth so far.
Whether they will be a good investment, we cannot tell, but the allocation of capital to non-cash assets is already significant and has grown more quickly than cash. They have, in fact, more than doubled in a year and quadrupled in two.
In his recent posts Horace took a look at Apple’s fixed assets and their development over the recent years. He also tested the hypotheses that Apple is making investments into machinery & equipment on which iOS devices are produced by overlaying iOS volumes with preceding changes in property, plant and equipment (PP&E).
The question that has arisen is: Are Apple’s investments in PP&E extraordinary?
To answer, I have compiled the capital expenditures (CapEx) for our previously established peer group [1].
But first we need to clarify what CapEx include and not include. CapEx includes investment into property, plants, equipment, office furniture, larger IT hardware and in some cases patents; CapEx do not include investment into long-term marketable securities or other long-term financial instruments, acquisitions or capitalized R&D. Furthermore, CapEx are gross values and are not net of any sold equipment [2]. CapEx are largely depending on a company’s business model and strategy. For example if you are a manufacturer you need equipment to operate, if you are a software company or a retailer, your business will not be capital intensive.
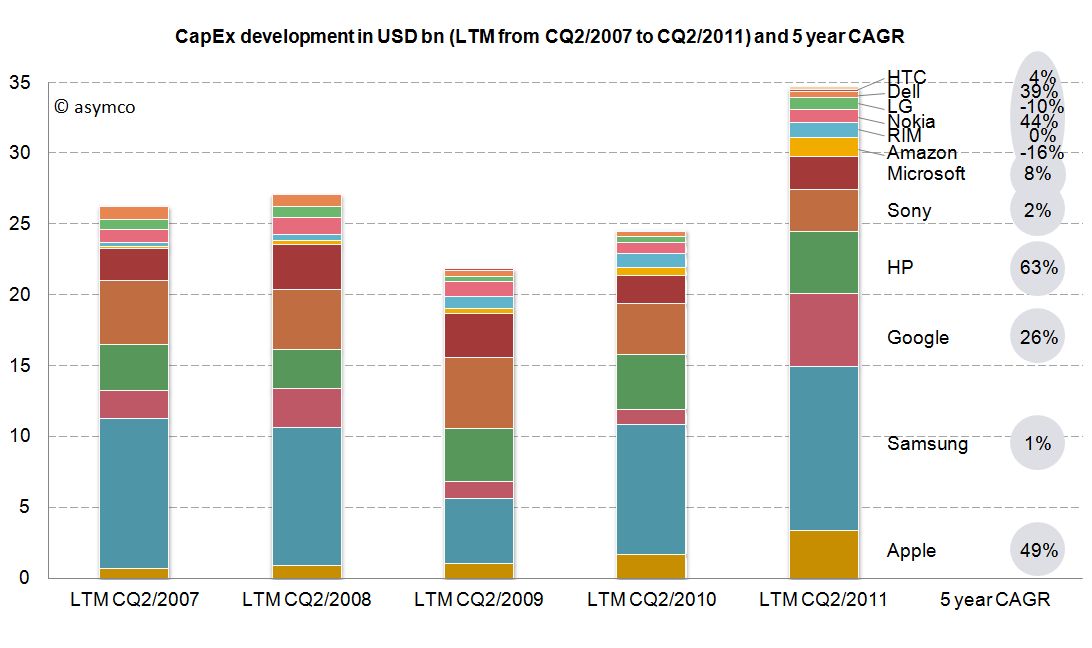
As the second calendar quarter of 2011 is the latest quarter for which all companies have reported figures, we will take a look at last twelve months’ (LTM) figures from Q2/2011 backwards. The following stacked bar chart shows the combined CapEx of our peer group:
The combined capital expenditures of our peer group for the LTM CQ2/2011 have outpaced even pre-crisis levels of investments and, combined, account for $34.7 billion. Samsung, a diversified manufacturer of IT hardware and other equipment, has invested more than $11.6bn with Google ($5.1bn), HP ($4.4bn) and Apple with $3.4bn following in line. While Google’s CapEx mostly account for its infrastructure of server farms and other IT hardware, HP’s CapEx mostly account for IT hardware it leases to its customers [3]. In absolute terms, Apple takes fourth place in CapEx spending for the last twelve months ending in CQ2.
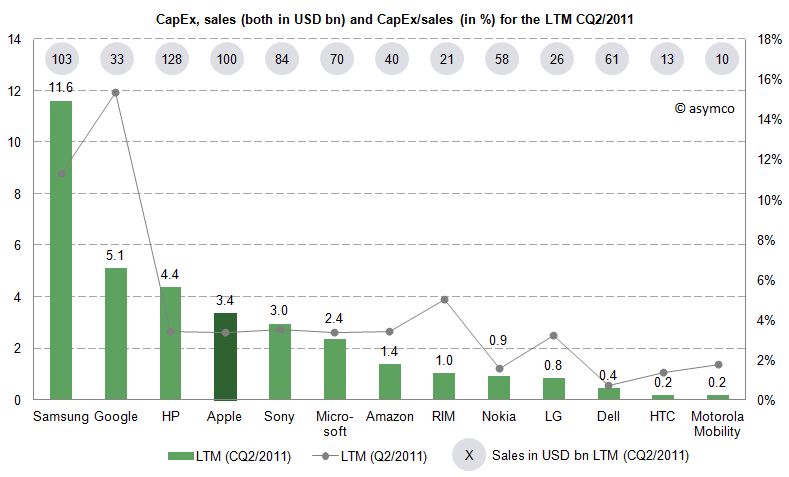
Since the business model and sales magnitude varies largely in our peer group, we can also take a look at a common measure to compare CapEx intensity by dividing CapEx by sales achieved in the same period. For the last twelve months we can depict the following chart:
The average of the peer group accounts for 4.4% of CapEx over sales. Samsung’s and Google’s business model are clearly more capital intensive, while Apple’s CapEx ratio of 3.4% is below the peer group average but above some of its peers like Nokia, Dell, LG, HTC or Motorola Mobility. Interestingly, capital intensity of HP, Apple, Sony, Microsoft and Amazon is at a comparable level of around 3.4%.
As noted before, business models and strategies are significantly different among companies in our peer group. However, while Apple’s CapEx intensity is not extraordinary, Apple’s CapEx in absolute terms are among the largest in it this peer group and have grown constantly throughout a five year period.
Is this a good thing and why does it matter?
CapEx by itself does not tell us much. We still do not know in what companies specifically invest as financial regulations do not require detailed CapEx accounts. We know that even if a company is not growing assets they need to be maintained, upgraded and replaced – this spending is also called "Maintenance CapEx". Everything else can be called "Expansion CapEx" associated with new product launches, entry to new business area or geographies or expansion of (manufacturing) capacity.
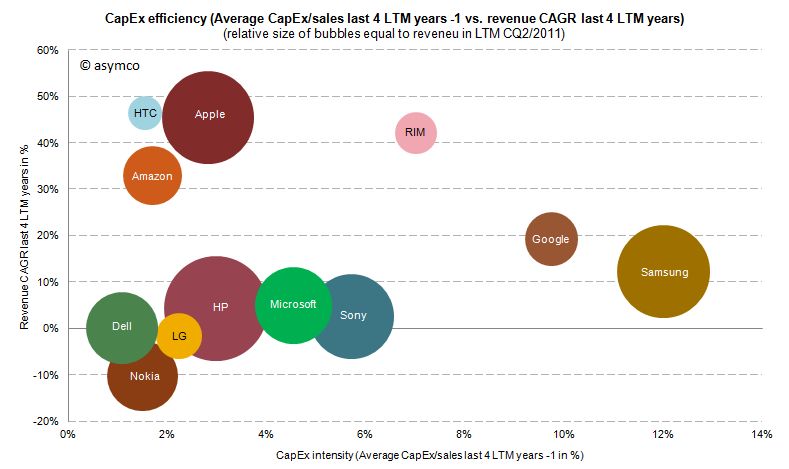
Therefore, Expansion CapEx is closely linked to expected organic sales growth in the future. So let’s go ahead and link CapEx ratio of the previous years with the sales growth of the following year. The following chart shows the cumulative average growth rate (CAGR) over the last four years versus the average of CapEx/sales ratio of the four last preceding years:
We can see that high CapEx efficiency has been achieved by Amazon, Apple and HTC with sales growth rates of 33-47%. RIM reached similar revenue growth but with higher CapEx intensity. Google and Samsung with high CapEx intensity have only reached modest growth rates. Dell, HP, Microsoft and Sony have not grown significantly but have close to average CapEx intensity.
We cannot state that CapEx in absolute terms have been extraordinary for Apple, but we can witness that with below average CapEx/sales ratio Apple outgrew in absolute terms Dell, LG, Microsoft, Nokia and Sony and has grown close to the revenue size of Samsung and HP in the last four years.
---
Notes:
Excluding Lenovo (not reported) and Acer (extra-ordinary low numbers reported, to be investigated), Motorola Mobility figures only available for the last six quarters
Minor differences may occur due to local Generally Accepted Accounting Principles (GAAP)
HP assumes ownership of these assets and rents them to the customers who in turn have a smaller balance sheet and can run IT hardware CapEx through the income statement as lease expenses
In the last two posts (How much does an Apple store cost?, The down payment on iCloud) I discussed two line items in the PP&E asset class on Apple's Balance Sheet. In isolation, the data is interesting as it gives us an idea of the cost structure of stores and facilities being developed to sustain its current business model. In aggregate, it provides insight into Apple's strategic intent.
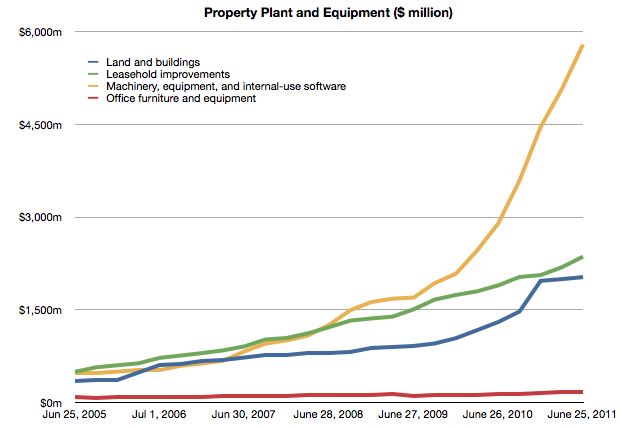
To complete the picture, I will look at the third asset: "Machinery, equipment and internal use software." It's the yellow line in the chart below:
It's plain to see at first glance that it's the most significant asset. What does it represent and what conclusions can we draw about Apple's strategy?
Before I begin, I should make clear what this asset represents and what it does not represent. These expenditures cover equipment used in production. They do not include components used in the production nor loans to suppliers for purchasing equipment. These are fixed assets that can be depreciated on a schedule and have specific tax treatment as a result. These are, in plain language, instruments used for producing things to be sold. They are things Apple owns.[1]
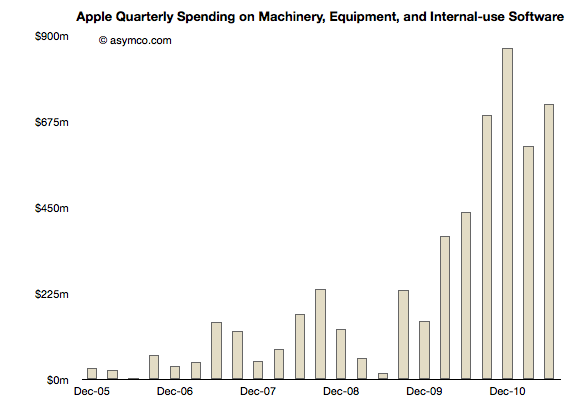
Using the same method as in the other asset analyses I took a measure of the sequential change in that asset over the time period and tried to see if there is a correlation between that spending and some other measure of output from the company.
Here is the sequential change chart since the end of 2005:
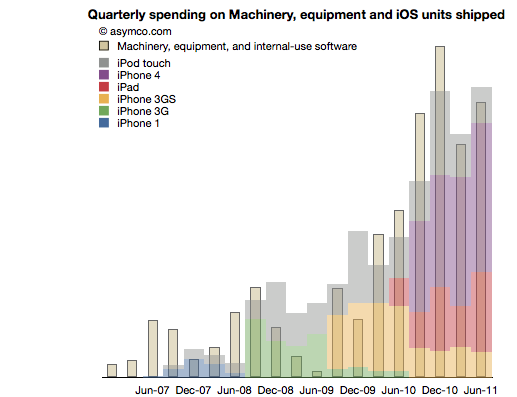
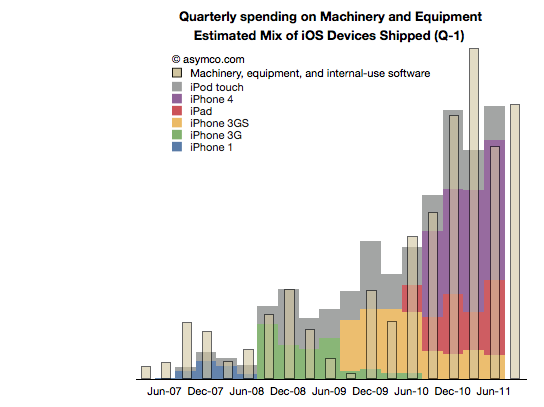
I noted that the pattern seems to relate closely with the increase in shipments of iPhones. More specifically, iOS devices. To test this I overlaid the overall volumes (with estimates of product types) of iOS shipments. This is a modified version of the chart published here.
There is a broad similarity. But again, as in the other analyses, the spending on assets typically predates the "output" from that asset. As we saw in land and buildings, the operational start of a facility may happen many quarters after the purchase is made. Similarly, stores open some time after the spending on fitting them out.
So it is with Machinery and Equipment. If we time-shift the output one quarter to account for spending before production we have a better fit (note the change in the title with "Q-1" indicating that the dates for the iOS shipments are offset by 1 quarter to the left).
We can even take the analysis further by breaking the spending and output into Phases corresponding to specific product cycles and introductions.
Phase 1: The original iPhone
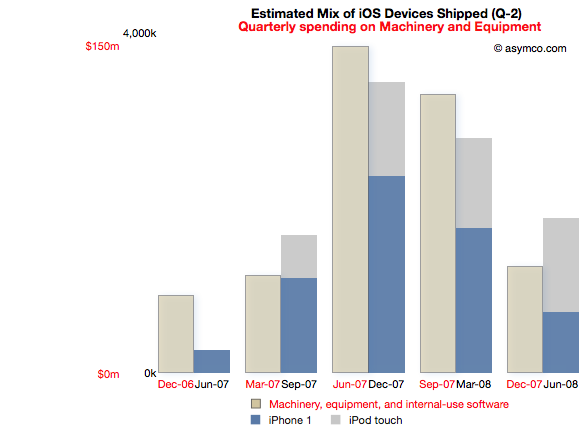
Spending on M&E prior to the iPhone launch began two quarters in advance of sales. The following chart reflects this delay. Note that the M&E payments are marked with quarters ending six months earlier than the shipment schedule. Note also the scale (red denoting the M&E spending and black the units shipped). I also separated the two product types (iPod touch are my estimates, iPhone numbers are published by Apple).
This Phase corresponds to the first "bump" in the expenditure chart but offers more detail. There is an evident relationship between the "input" expense and the "output" of units shipped.
The cost of Phase I was $408 million.
Phase II: The iPhone 3G series
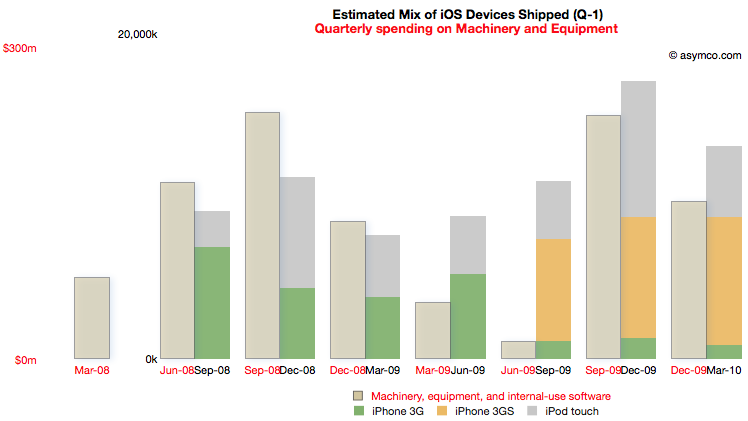
Phase II covers spending from the quarter ending March '08 to December '09 and production from September '08 to March '10.
For this Phase the time shift is only one quarter but there is a quarter's worth of spending that is initiated prior to any shipments. I chose to demarcate this Phase to cover production for both the 3G and 3GS as they probably shared a lot of common equipment. Some spending on new production lines however still had to happen as volumes increased during 3GS production.
Note the scale change from the first Phase. Whereas the maximum in Phase I spending was around $150 million per quarter, the peak is nearly twice as much in the second Phase. The peak output is 5x higher.
The cost of Phase II was $1 billion.
[I had to guess whether the Sep 09 and Dec 09 M&E spending was for 3GS or whether it was to prepare for the ramps in the new products about to be launched in the third Phase.]
Phase III: The iPhone 4 and the iPad
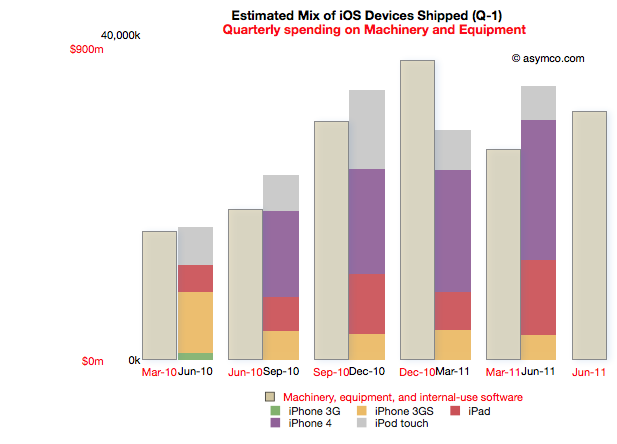
Phase III begins with spending prior to the launch of the iPad 1 (March '10) to the last quarter (ending June 2011). Coupled to this is production starting in quarter ending June '10 and ending in the last quarter.
Note that due to the time offsetting on production, the output from the spending on the quarter just ended will not be known until Apple publishes their shipments for the June quarter (scheduled for October 18th).
The relationship between pre-dated spending and production one quarter later holds quite well. There is a "surplus" of spending in December 2010 but that could be seen as the ramp being prepared for the second iPad.
Phase III cost is $3.7 billion so far.
Note again the change in scale from the previous two Phases. Peak M&E expenditures are around $900 million per quarter while production peaks at around 35 million units. This is a tripling of spending coupled to about a doubling of output.
Observations
The data suggests spending on equipment is correlated with the volume of production of its iOS devices. However, Apple is understood to be a company that outsources its production and does not "own" its own factories. Claiming that it keeps equipment used in the production of iOS devices on its books is an extraordinary claim.
I make a further claim that the scope of spending itself is extraordinary.
The following chart shows the three asset classes discussed in the three latest posts relative to each other (quarterly change in asset value).
In How much does an Apple store cost? I noted that the spending on leasehold improvements of $2 billion over a few years is significant and sustaining and largely asymmetric to competitors. You can see that spending in the grey bars above.
In The down payment on iCloud I noted that spending on Land and Buildings is significant and sustaining to iOS but not on a scale many can match. Those costs are shown in the blue bars above.
If, as I claim here, the yellow bars show the spending on Machinery and Equipment used in the production of iOS devices, then the commitment Apple has made to controlling production is even higher. In December 2010, M&E expenses were 50% higher than the spending on the data center and the new Cupertino campus put together.
The M&E assets have cost a total of $6 billion. The Apple stores have cost $2.3 billion and land and buildings $2 billion. In other words, Apple's machinery and equipment is worth much more than all its buildings and stores put together.
Compared with what Apple spends on other fixed assets, M&E is spectacularly significant.
In the twelve months ended June, Apple will have spent $2.9 billion in M&E to manufacture 118 million iOS devices. To put that in perspective, Nokia, which manufacturers a large (if not majority) of the 340 million phones it sells, expects full year 2011 capital expenditures of $1.1 billion.
Correcting for amortization and depreciation and deducting some spending on Mac M&E, it's very likely that Apple spent twice as much as Nokia on the instruments of production for one third the number of devices.
Conclusions
It may be too early to draw conclusions from this analysis. The claims should be debated and the claims should be tested, but I can suggest some tentative strategic implications.
Last December I wrote that I thought Apple should use its capital to own the means of production for iOS. I reasoned that device supply was its biggest deficiency and that perhaps ownership would allow them to become better at it.
Indeed, Apple has used capital to ensure it has better control over the supply of components and to also perhaps ensure capacity of production of those components.
But this analysis shows that Apple has gone much further toward integrating its value chain. It suggests that a large part of the tooling in its supply chain is owned by Apple. It suggests that those tools are put out of reach of its competitors.
The implications could be profound but given the length of this post, I'll leave that discussion for another day.
---
Notes:
Some of the capital expenditures were also allocated to servers or "information systems hardware, software and enhancements." From the Annual Report 2010: Capital Assets. The Company anticipates utilizing approximately $4.0 billion for capital expenditures during 2011, including approximately $600 million for retail store facilities and approximately $3.4 billion for product tooling and manufacturing process equipment, and corporate facilities and infrastructure, including information systems hardware, software and enhancements.