Asymco

Asymmetric Intelligence

capex

  1. The rear view mirror

    Research · 57 comments

    In the Innovator's Curse I reflected on the fact that a serial innovator cannot be efficiently financed or even rewarded for having figured out how to repeatably create. If anything, a serial innovator has to suffer a discount to peers who do not habitually (or ever) innovate. The innovation process is the proverbial goose that lays the golden eggs but is destined to perish due to the lack of faith in its existence.

    So how can I back this up?

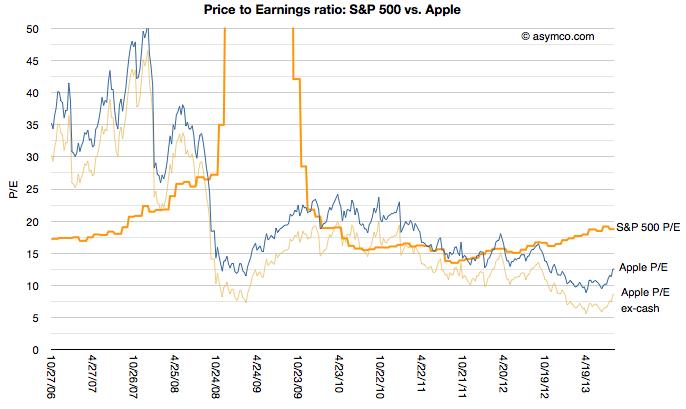
    To start, this is partially evidenced in this graph of Apple's price to earnings ratio since 2006 vs. the S&P 500's. The S&P reflects the 500 largest companies in the US and is thus a proxy for the "average" company.
    Screen Shot 2013-08-30 at 8-30-6.36.23 PM

    [I added Apple's P/E excluding cash for additional perspective.]

    The graph shows that during the period of time when iPhone and iPad changed computing and telecommunications, Apple was mostly held in contempt: the profits it was generating were not considered of "sufficient quality" relative to an average company. Since markets look forward, not backward (one assumes), the vote cast is decidedly that success cannot be repeated. Put another way: you can trust that a soft drink maker like Coca Cola (P/E of 19) or a utility like ConEd (P/E of 18) will continue in the manner we've seen them perform in the last year more than Apple (P/E of 12) will.

    I can offer yet another way to consider this curse. Apple's iOS business is designed to capture profits through the sale of hardware. That hardware is manufactured through a process where, while not being the manufacturer, Apple purchases tooling in a capital-intesive strategy to control the means of production.  I've discussed this at length before.

    But Apple's business is more complex than just enabling manufacturing. Tooling allows for production and production allows for supply but supply is nothing without demand. And demand of the product is driven by investments in software and services and design and marketing and countless details.

    In other words, for Apple's modus operandi, if anything should correlate with value it's opex, not capex. It's the investment in the people Apple employs not in the tools it buys.

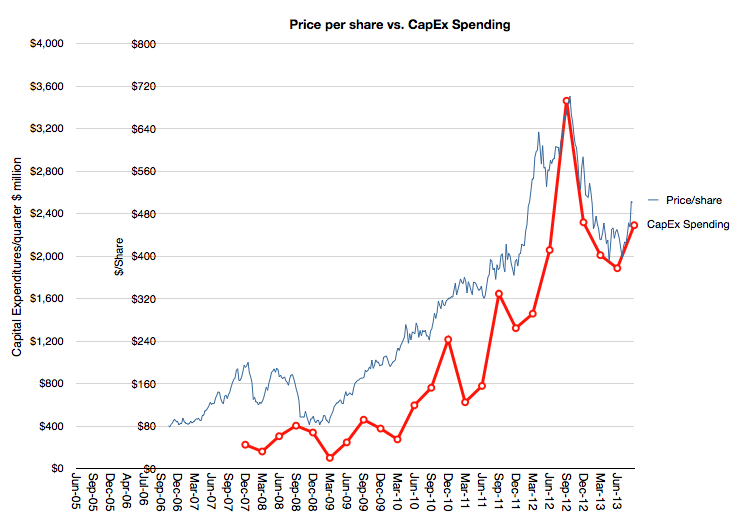
    And yet consider this graph:
    Screen Shot 2013-08-30 at 8-30-6.50.57 PM

    It shows how the market (though its pricing of Apple shares) values the company overlaid with a Apple's spending on capital equipment (PP&E capex).

    The relationship is uncanny. I'm not suggesting causality—that capex (which is publicly pre-announced) determines the share price level—but I am suggesting that there is a valuing of Apple as a producer of goods (for which tooling is a handy proxy). There is no sophistication to this formula. The more iPhones are built, the more the company is valued. Obvious.[1]

    But it's not obvious that prior to the iPhone there was iPod, which was a different business (and prior to it was the Mac, ditto.) The stock did not reflect the transitions nor does it assume that anything else will follow. It is, in other words, looking backward, not forward.

    --

    Notes:

    1. One could suggest looking at CapEx months in advance and predict the stock price, but who would believe such an absurd idea?
  2. In the weeds

    Research · 55 comments

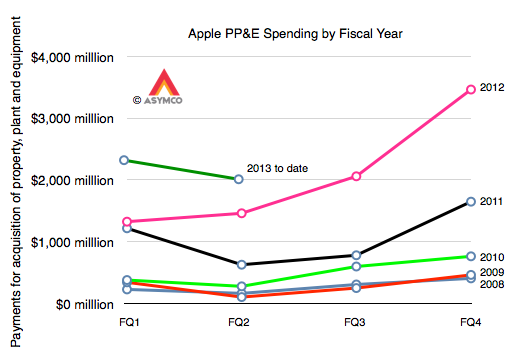
    Although discussions related to how Apple will "use its cash" center on acquisitions of companies, Apple's has been busy acquiring, just not companies. It has been buying capital equipment. Capital meaning (in the original sense of the word[1]) the means of production.

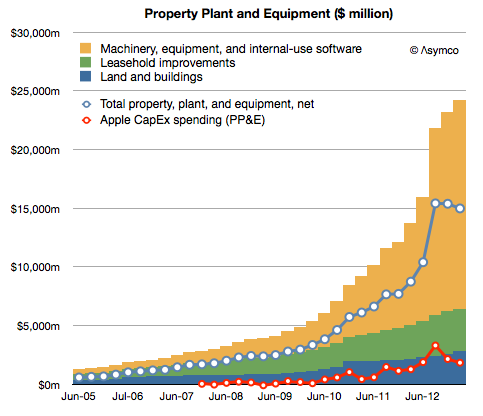
    Since the launch of the iPhone Apple has spent $21.1 billion on the acquisition of property, plant and equipment. The company has already stated that they will spend another $10 billion or so for the current fiscal year. This has been mostly machinery and equipment used in manufacturing.

    The result in asset value is shown below:

    Screen Shot 2013-05-30 at 5-30-6.29.53 PM

    [The Net value, shown as a blue line, is after accumulated depreciation. The red line represents spending as reported on the cash flow statement.)

    The change in spending year/year (fiscal) is shown in the following graph:

    Screen Shot 2013-05-30 at 5-30-6.31.27 PM

    So these are very large numbers, even compared to other capital-intensive semiconductor manufacturers:

    Screen Shot 2013-05-30 at 5-30-6.48.22 PM

    Given this enormous spending one could imagine it's the subject of intense scrutiny. However the only question on the subject that I've ever seen was from Steve Milunovich of UBS to which Peter Oppenheimer, CFO offered an explanation:

    Steve Milunovich - UBS
    …second question would be on CapEx, you spent almost as much Intel does. I think you guys have said you’re not going to become vertically integrated per se but in a sense you are since [you buy] equipment for your partners, could you talk about the strategy here and how much of a differentiator this gives Apple in terms of your ability to ramp new products over time? And maybe a little bit more about how deep you will go in terms of semiconductor components for you, etc.?

    Peter Oppenheimer - Chief Financial Officer
    Sure. Steve it’s Peter. We expect to spend about $10 billion in CapEx this fiscal year that will be up little under $2 billion year-over-year. We expect to spend a little bit under $1 billion in the retail stores. And the other $9 billion is spent in a variety of areas. We are buying equipment that we will own that we will put in partners’ facilities. Our primary motivation there is for supply, but we get other benefits as well. We are also adding to our datacenter capabilities to support all the services that Tim spoke about in answering Ben’s question and in facilities and in infrastructure. So, that’s where the capital is going.

    I would say that this is not a very satisfying answer, which is why I thought it merits further questioning[2].

    Alas, no.

    Whereas there is a constant clamoring for Apple's to use its cash to "acquire" or "buy" something, anything, maybe people not looking hard enough. If you need the satisfaction that comes from knowing that money is being spent, a glance at the Cash Flow statement and Balance Sheet shows that Apple buys the equivalent of one Yahoo! every three years[3].

    The main difference with this type of acquisition is that there is less value destruction. Using the capital to ensure access to capacity, differentiation and hence a high margin is better than writing off the goodwill after a few years.

    --

    1. The term capitalism, in its modern sense, comes from the writings of Karl Marx
    2. I am prepared to be alone in this quest as it seems to merit no mention from others
    3. or 10 Tumblrs every year
  3. The cost of building Galaxies (and iPhones)

    Research · 33 comments

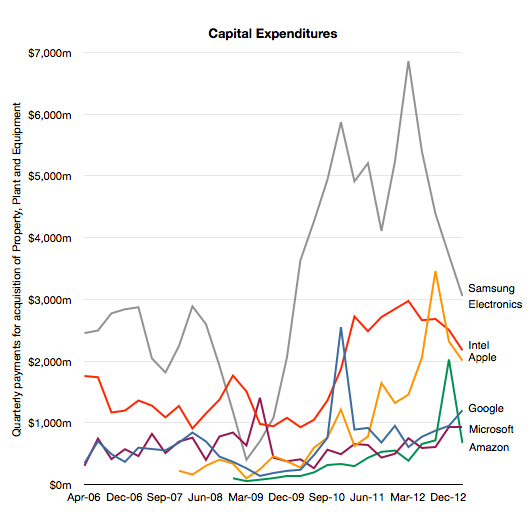
    Although Samsung and Apple are acclaimed as the leaders in profit capture for smart (and otherwise) phones, what is not lauded is how much they spend on capital equipment used in the making of these phones.

    In 2012 Samsung spent around $20 billion while Apple spent about $10 billion (excluding leasehold improvements or Apple stores but including real estate).

    Compare these figures with Intel at $11 billion, Google at $3.2 billion, Microsoft about $2.8 billion and Amazon $3.8 billion (including presumably new distribution centers.)

    Screen Shot 2013-04-04 at 4-4-5.51.15 PM

    What each company spends on differs depending on its business model, but as the graph above shows it's easy to see that there is a class of "big spenders" who spend so much that it makes it hard to imagine just what $10 billion/yr could actually buy.

    To get an idea of just how big that figure is consider that a Nimitz class aircraft carrier costs about $4.5 billion to build and it takes several years to do it. Or consider that the largest data center in the world probably costs about $1 billion or that the largest office building will cost between $4 and $5 billion. Either of these infrastructure projects are massive multi-year projects. Apple, Intel and Samsung spend well more than this every six months.

    So it's a special class of equipment which falls in the multi-billion dollar range: semiconductor process equipment.

    Whereas in the case of Intel it's the obvious target for the funds, how can we assume it's the case for Apple and Samsung.

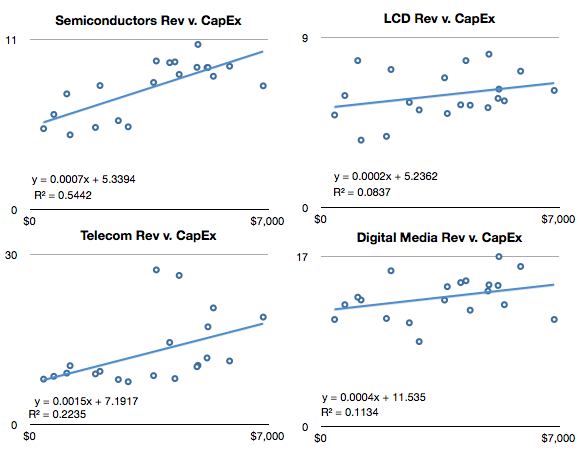
    We don't have proof but there is a remarkable correlation between CapEx and Semiconductors in Samsung's divisional financial reports:

    Screen Shot 2013-04-04 at 4-4-5.58.22 PM

    We also have the historically reported allocation of CapEx as reported prior to 2008:

    Screen Shot 2013-04-04 at 4-4-6.00.26 PM


    Therefore I consider it safe to assume that the bulk of Samsung's Capital Expenditures are in support of semiconductor production (note that this does not include display panels).

    Note however that in the first graph, Samsung's expenditures seem to be declining. Measured in Won, the level in Q4 '12 was about the same as that in Q1 2010 and down 30% y/y. Apple's spending also dropped sequentially in Q4 but was up 75% y/y. It's also nearly ten times higher than what Apple spent in Q1 2010.

    So the question I would ask is whether Samsung's reduction CapEx (which is safely assumed to be supporting semiconductor production, and which, in turn, is, to a large degree, supporting Apple) is being picked up by Apple.

    If so then then this would be evidence of the re-alignment of role and control in the value chain of a terribly important industry.

  4. Estimates for Apple’s first fiscal 2013 quarter

    Research · 130 comments

    I've postponed my estimates for the fourth calendar for a long time. The reason is that there have been conflicting data to deal with and I've been hoping for some clues to give clarity. Unfortunately, even though I waited, I have not received many clues. Here are the challenges we have to deal with in this quarter:

    1. Management gave very low guidance for the quarter's earnings and sales. Normally this should not be a concern since the long-term pattern has been for them to "sandbag" significantly. For example last year's fourth quarter was guided at $9.3 EPS while the company delivered $13.87, a 49% "beat" to their guidance. However Q2 and Q3 beats were only 7% and 13% respectively and if we assume a similar number (10%) for Q4 we get about $13/share which would be a year-on-year decline in earnings (down from $13.9). This has not happened for many, many years. Management explained this through a lengthy set of reasons including a shorter quarter (13 weeks vs. 14 weeks), new product launches, currency fluctuations, deferrals and unfavorable component pricing. Then again, similar explanations were used in the past with no reflection in what actually happened.
    2. Management also launched a large number of new products. This normally leads to a surge in sales. In fact, 80% of revenues would come from a new portfolio of products. Having such a broad launch quarter into a holiday, would normally imply huge growth. Not only is this a critical launch quarter for many products but they also rolled out the iPhone to more markets more quickly than ever: 100 countries in three months. The broad roll-out implies a steeper ramp in production and thus more volumes. This would also contradict the lowered expectations from the CFO. However...
    3. Production was constrained. It was quite a long time before waiting times decreased for the iPhone--longer than what we saw last year. In the earnings call Tim Cook said "It's difficult to predict when supply and demand will balance, but I'm feeling very confident on our ability to supply quite a few iPhones". This again implies significant acceleration but did they achieve the targets? He did also announce that they met their target of 100 countries during the quarter but it's not clear if this was as quickly met as they would have liked.
    4. Margins are complicated. Launch quarters have lower margins typically and this is well understood. However, we have new products in the form of a new iPad at a new price point as well as the new iPhone which may have had some difficult manufacturing issues (i.e. yield). So how much faith do we put in the perennial pessimism in guidance?
    5. There was a vast increase in CapEx in the prior quarter. Normally CapEx spending "leads" production and is in proportion to it. However, the surge in Q2 and Q3 seemed to be unmatched by vast new production, at least that's what we are led to believe by both consensus and by management guidance. Did this CapEx differ in character from previous CapEx? Was it more "strategic" and less "tactical"? Will the disconnect continue?

    There are also the deeper questions:

    • Why there are no new operators being signed? The addressable market has not increased in the last 6 months. Why?
    • Is there a faster product cycle in the works? Is there a shifting of gears to a new product development process?
    • What's the nature of the relationship with Samsung as a supplier? Is their replacement characterizing the new type of CapEx spending?

    All these currents make this quarter doubly difficult to forecast. And it does not help that it comes on the back of two weak quarters which were argued away as exhibiting transition effects.

    So I'm very uncomfortable with my forecast and find it hard to defend this quarter. I considered not publishing one at all because it gives too much confidence when none is warranted. However, I received so many requests to publish that I relent and offer the following:

    • iPhone units: 55.5 million (50%/62%)
    • Macs: 5.0 million (-4%/+3%)
    • iPads: 24.4 million (58%/70%)
    • iPods: 11.2 million (-27%/-22%)
    • Music (incl. app) rev. growth: 25%/38%
    • Peripherals rev. growth: 10%/19%
    • Software rev. growth: 5.5%/14%
    • Total revenues: $60.0 billion (30%)
    • GM: 39.8%
    • EPS: $15.74 (13%)

    I included two growth figures (in parentheses). The first is a straight y/y value and the second is adjusted by assuming there were 13 weeks last year (and that sales were evenly distributed over those weeks).

    [We'll get a chance to go over this forecast and what is actually reported at Asymconf. Don't forget to sign up.]

  5. The new age of Capital Intensity

    Research · 117 comments

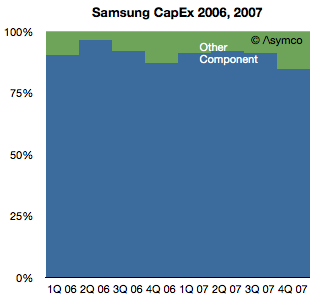
    In the post reviewing Samsung's Capital Structure I noted that its component divisions have historically taken 90% of capital investments and that the overall capital intensity for Samsung Electronics has increased in proportion to its component revenues.

    In another post regarding the capital structures of other technology companies with different business models I noted that Apple has changed its capital structure to a significant degree over the previous three years.

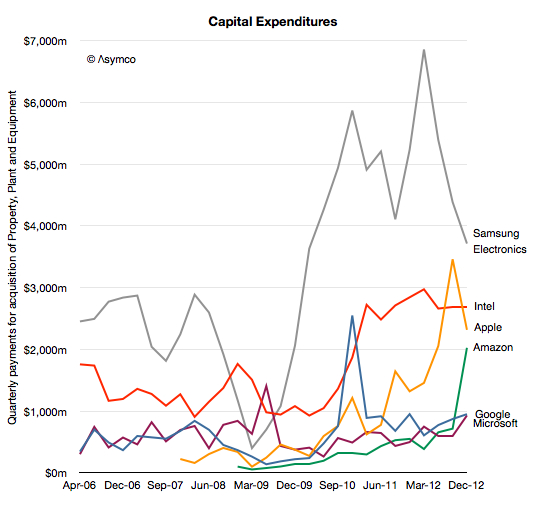
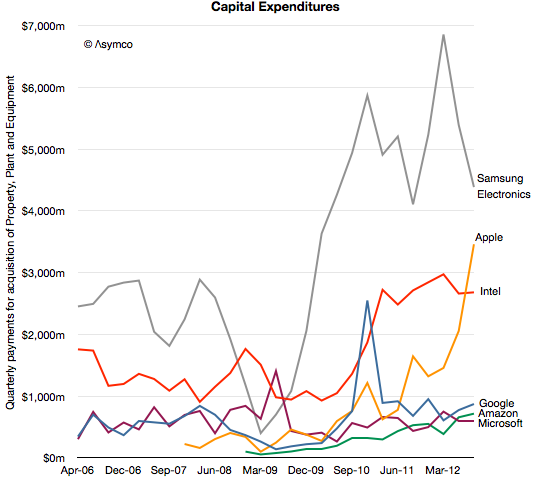
    In the following graph I combined these observations to show how capital expenditure patterns may be used to discern the underlying business model.

    I would group "cloud" or "platform" based companies like Google, Amazon and Microsoft as a cohort which, although spending significant amounts on capital equipment, do so mainly to support services. Their primary employment of capital is to sustain the infrastructure of data centers necessary to deliver the services underpinning their business models.

    I would group Intel and Samsung as "component" based companies which use capital to build production capacity that delivers, hopefully, a control point in the value chains they participate in. Note that I am assuming that Samsung Electronics' CapEx primarily targets semiconductors and displays as it did during the 2006 and 2007 period when data was available.

    Therefore, given the patterns over the last six years, it might be possible to classify a company's core business by just looking at its CapEx: The services group showing growth but relatively stable patterns and the components group showing more volatility, macroeconomic sensitivity and an overall higher level of spending, especially as a percent of sales.

    The question that pops up then is in what category does Apple fall?

    My observations for over a year have been that Apple is increasing its capital spending to such a degree that it is neither fish nor fowl. It operates data centers but presumably does not operate fabrication plants. And yet it spends more than Intel and Google combined.

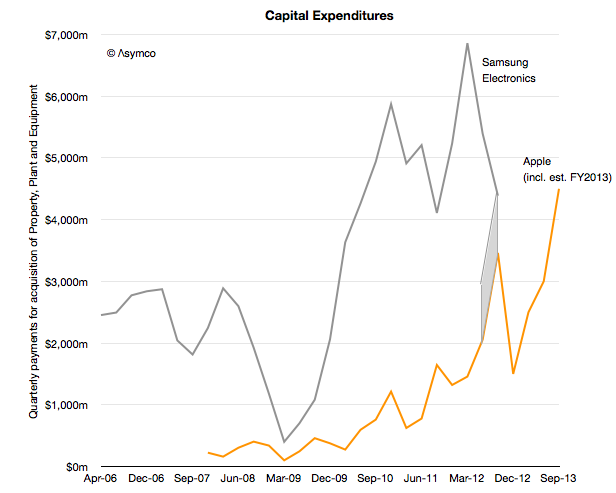
    Contrasting Apple and Samsung Electronics tells an even more interesting story. In the following graph I've added two additional items of information: First, although CapEx spending is recorded in the cash flow statement, Apple reported in its yearly (10K) report that it spent an additional $2 billion for equipment which did not pass through cash flow.

    If we were to add $1 billion to each of the previous two quarters, the graph would look like this:

    The second piece of information is that Apple projected its spending for the following fiscal year. I've added that spending in a pattern matching the last fiscal year.

    Apple is still spending less than Samsung. In its fiscal year 2012 Apple spent about $10 billion while during the same time frame Samsung spent nearly $22 billion. However, Apple has begun to bump against Samsung's spending level on a quarterly basis.

    I consider this extraordinary evidence of an extraordinary shift in strategy.

    For a year we've been debating here to what degree Apple has a "capital intensive" business and what exactly could it be spending capital on. One early hypothesis has been that it's on data centers or on real estate for spaceship campuses. These can be easily dismissed on the knowledge that they can't cost that much (and that the spending happens gradually). Another hypothesis is that the tooling for milled aluminum cases and other mechanical components is expensive and Apple has to buy a lot of it. But, again, the level of expenditure is in the league of Intel and Samsung which make vast quantities of semiconductors in very expensive plants. It's hard to imagine milling machines being cost equivalent to chip foundries.

    The comparison with Samsung, whose vast capital commitments are legendary and are its primary strategic asset puts Apple in a new light. Perhaps we can't yet call Apple a semiconductor company or even a fabricator but they are putting their "money where their mouth isn't". We can infer that it's not going where the company currently operates. The capital is being deployed almost silently and, though vast in scale, barely gets a mention from analysts. Not even a single question has been raised at any earnings call about this spending.

    So what tale does this capital tell?

    One interpretation is to apply the value chain disruption theory and ask whether Apple is acting to counter a potential disruption. In other words, that this is a specific threat response from an incumbent. There is some logic to this because  the antagonism between Samsung and Apple is so strong that it might justify a reaction of this kind.

    However, I believe that there is a more measured process at work over a long period of time. The one distinguishing advantage and attribute that Apple has  is its preference for integration. This preference is not a secret and Tim Cook repeats it often. The integration is evident with their move into retail and component design, in other words in both directions along a value chain. So my hypothesis is that this is part and parcel of an ongoing re-alignment of their role in the value chain.

    This second explanation suggests that Apple simply wants to control all the areas which affect the value they produce. First because they feel that there are areas that are not good enough and the product/experience cannot be good enough if its constituent parts are not good enough. Second because without control there are constraints to what it can do strategically.

    Whatever the reason, I read the evidence of increasing commitment and engagement in parts of the value chain as part of a continuous evolution of Apple's role. Furthermore, it's something that should be seen as a signal of a new era in how technology companies operate. We see hints of "vertical integration" with Microsoft building hardware, and Google buying Motorola and Amazon selling devices. Apple did all these things and now it casts an eye over the next frontier: components.

    ---

    If you want to learn more about the future of the technology industries and the evolution of value chains, consider participating in Asymconf.

  6. Samsung's Capital Structure

    Research · 28 comments

    Having described the Revenue, Operating Margin and cost structure for Samsung Electronics it's time to review their investment strategy.

    The Economist summarized it well:

    [Samsung's] businesses look remarkably disparate, but they share a need for big capital investments and the capacity to scale manufacture up very quickly, talents the company has exploited methodically in the past.

    Samsung's successes come from spotting areas that are small but growing fast. Ideally the area should also be capital-intensive, making it harder for rivals to keep up. Samsung tiptoes into the technology to get familiar with it, then waits for its moment. It was when liquid-crystal displays grew to 40 inches in 2001 that Samsung took the dive and turned them into televisions. In flash memory, Samsung piled in when new technology made it possible to put a whole gigabyte on a chip.

    When it pounces, the company floods the sector with cash. Moving into very high volume production as fast as possible not only gives it a price advantage over established firms, but also makes it a key customer for equipment makers. Those relationships help it stay on the leading edge from then on.

    The strategy is shrewd. By buying technology rather than building it, Samsung assumes execution risk not innovation risk. It wins as a “fast follower”, slipstreaming in the wake of pioneers at a much larger scale of production. The heavy investment has in the past played to its ability to tap cheap financing from a banking sector that is friendly to big companies, thanks to implicit government guarantees much complained about by rivals elsewhere.

    Can we find evidence of this capital intensity?

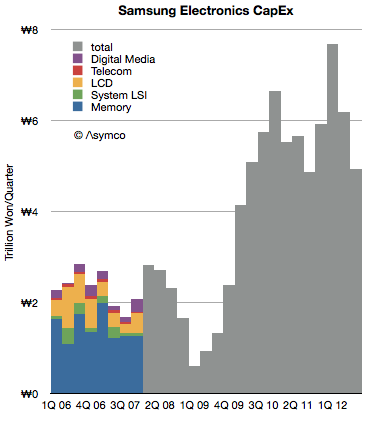
    To answer, I reviewed Samsung Electronics CapEx as reported in their quarterly cash flow statements. The following graph illustrates the data:

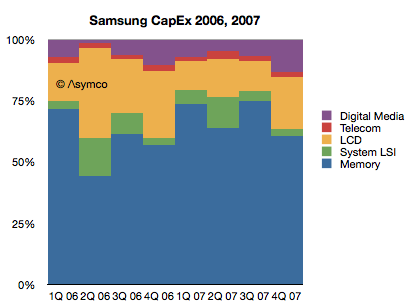
    Note that during 2006 and 2007 the company specified expenditures on an operating divisional level. Since 2008 it has reported only a total. For the years where divisional detail is available, the percent split looks as follows.

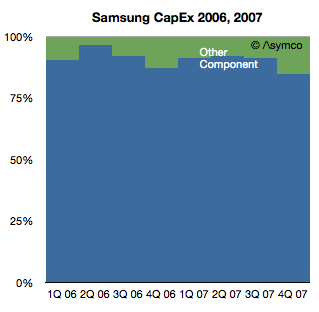
    If we combine the Semiconductor division (Memory and System LSI) with the LCD group and classify this as "components" the split looks as follows:

    Therefore, for the two years when information was available, the component divisions consumed 91% of expenditures and Consumer Electronics (Digital Media) together with the Telecom (mobile phones, mainly) were a combined 9%. The least capital intensive division was Telecom, the mobile phone group, with only a 2% allocation of capital.

    The other observation is that, after a contraction in the recession years of 2008 and 2009, CapEx expanded greatly in 2010 and 2011. [1]

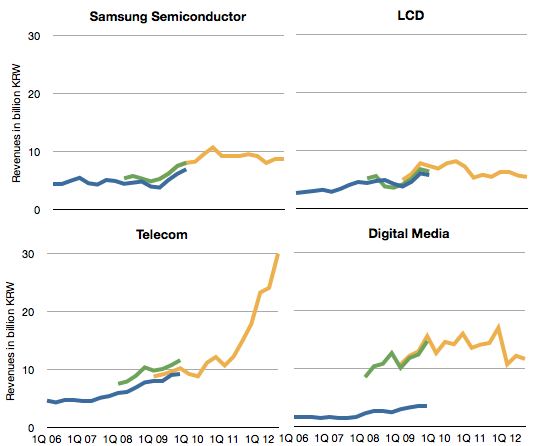
    Coincident with the growth in CapEx, the company's revenues grew dramatically as well. However, as the graphs below show, the growth has come predominantly from the Telecom division.[2]

    I calculated the correlations between each division's revenues and the growth in CapEx (total) for the time periods 2006 to present and 2008 to present and obtained the same results: The division with closest correlation to CapEx remains the Semiconductor group.

    This stands to reason. Capital expenditures are mainly in the service of semiconductor manufacturing. Semiconductors, or components in general, require more capital than assembly of devices or consumer electronics.

    However, the revenues and operating income for devices have grown far faster. Samsung's investment in capacity would have been largely profit-free had they not also been assembling the devices which capture the margins.

    One might conclude that Samsung would be better off abandoning its capital-intensive components business and focusing on the devices. However, as James Allworth points out if you only do the devices, you may find yourself vulnerable to value chain disruption. Whoever is involved "upstream" in the value chain will inevitably learn the device business from a base of "commodity" manufacturing and pose a threat.

    Now the question poses itself: Which of the usual suspects understands this?

    Stay tuned for evidence of an incumbent response.


    If you want to learn more about the future of the technology industries and the evolution of value chains, consider participating in Asymconf.

    ---

    Notes:

    1. Some of this growth is due to a new (K-IFRS) accounting standard in use after 2010, but the expansion was significant regardless.
    2. The revenues data is was reported using three different accounting methods and each is shown with a different line color: Blue is "Parent basis", Green is "Consolidated basis" and Yellow is "K-IFRS".
  7. ReCapEx: The curious case of Apple's 2012 and 2013 Capital Expenditures

    Research · 114 comments

    The latest yearly report from Apple includes, as it has in the past, the forecast of Capital Expenditures. I've been tracking this data as an indicator of both strategic intent and potential forecasting tool for iOS device production.

    Before exploring Apple's own forecast, we should look at how they met expectations for fiscal 2012.

    In October 2011 the company forecast was as follows:

    The Company anticipates utilizing approximately $8.0 billion for capital expenditures during 2012, including approximately $900 million for retail store facilities and approximately $7.1 billion for product tooling and manufacturing process equipment

    In October 2012 it reported:

    The Company’s capital expenditures were $10.3 billion during 2012, consisting of $865 million for retail store facilities and $9.5 billion for other capital expenditures, including product tooling and manufacturing process equipment, and other corporate facilities and infrastructure. The Company’s actual cash payments for capital expenditures during 2012 were $8.3 billion.

    There are two points that need to be highlighted:

    1. Expenditures overall were $2.3 billion higher than forecast. Nearly all of the over-spending was for "product tooling, manufacturing process equipment and infrastructure". Retail was planned at $900 million and actual was $865 (an under-spend of $35 million). As no major real estate assets were acquired (change in those assets was $380 million, less than 2011 or 2010) the "deficit" in budgeted expenditures can be attributed entirely to product tooling and manufacturing process equipment.[1] The $2.3 billion spending over expectations amounts to 34% of forecast.
    2. The cash payments for capex were $2 billion lower than expenditures. This is a curious situation which was not highlighted in previous 10 K reports. What this implies is that much of the "over-spend" was not paid for though cash and since no new debt was booked it's likely to have been paid for through some form of vendor financing. I'll explore some explanations below.

    So it's important to note that the company spent a great deal more (one third more) than expected and paid for some of the acquisitions through uncharacteristic or unorthodox means.

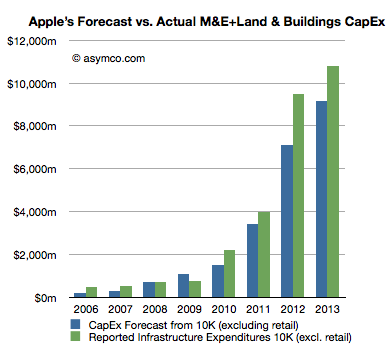
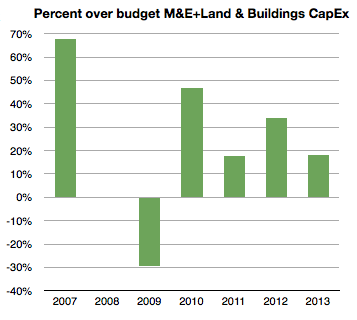
    The historic budgeting for Machinery & Equipment (+Land & Buildings) is shown in the following graph:


    I included the forecast for 2013 ($9.15 billion) and added 18% to estimate 2013 actual spend.

    The percent over/under budget (percent difference between green and blue bars above) is shown below:

    [Again, note that I took the liberty of forecasting 2013 over-spending at 18% or $10.8 billion.]

    Note that 2008 and 2009 were either on target or below target. The recession of 2008/2009 might have had something to do with that. The under-spending situation of 2009 was made up for during 2010 with over 45% extra spending. 2011 came in at 18% over and 2012, as already noted, was 34% over budget. I then suggest that 2013 will be at 18%, same as in 2011.

    When seen in this historic context, the increase of 2012 is even more dramatic. Apple overspent in 2012 more than it spent overall two years earlier. 2012 spending on M&E (and Land) was up 138% sequentially and nearly seven times the level of three years ago.

    With this splurge in mind it's necessary to think about that second noteworthy point above. There is evidence that at least some of the $2.3 billion over-budget was unanticipated and came late in the year. We saw the surge in spending in FQ4 from the gross asset value change data. The question is what was it spent on and why did it not go through the cash flow statement?

    Circumstantial[2] evidence points to the asset being production equipment (or even a whole plant) previously owned by Sharp. Sharp is a key supplier of screens to Apple but is also in financial distress. Sharp has also been the object of an intended investment by Foxconn [Hon Hai]. That deal fell through as Sharp's finances deteriorated. My guess is that these attempts to shore up Sharp are directed by Apple to ensure both continuity of supply and a balanced supplier base (offsetting Samsung, another supplier.) If Sharp were to enter into some form of bankruptcy, the key plant(s) used in producing screens for Apple might be "up for grabs" by creditors and they might be taken off-line, jeopardizing Apple's production capacity, irrespective of contractual obligations. I believe that Apple's late and unprecedented expenditure was to secure this asset. I further believe that the financing for this deal was done through a swap of "pre-orders". Stepping even further into the hypothesis, I believe Apple arranged to move a Sharp screen production line onto its books and "paid" for it through a pre-payment of components. This being a pre-payment it would be in the form of an "off balance sheet" commitment. Apple reported that "As of September 29, 2012, the Company had outstanding off-balance sheet third-party manufacturing commitments and component purchase commitments of $21.1 billion" [my emphasis]. This is a significant increase from earlier years and allows for a huge "slush fund" to cover asset swaps.

    If we take the timing of this expenditure into consideration, I consider it reasonable to assume that 2013 spending is lower by this amount. In other words, I think that about $2 billion, including the Sharp plant, may have been "brought forward" by a few months from 2013. If the company had spent more on schedule and on budget (i.e. with an over-spend of 15% rather than 34%) it would have spent about $8.2 billion. Therefore, as next year's forecast is for $9.15 billion and as I would also expect an over-spend of 18% or $10.8 billion total, adding the brought-forward $2 billion would imply sequential growth from $8.2 to $12.8 or 56%.

    This is in contrast to the indicated change of $9.5 billion (actual) to $9.15 billion (forecast), or decrease of 4%.

    So, recapping the CapEx story, the company over-spent far more in 2012 than anticipated. It did so late in the year. It did it while a supplier was in distress and another's supplier's efforts in rescue failed. Furthermore, it indicated a modest and thus uncharacteristic increase in the next year's CapEx budget. My take is that the trajectory of investment is not being altered dramatically but it's had an adjustment in timing, a kink in the line. The overall story remains that Apple is still injecting vast and growing amounts of capital into production and placing those assets on its own balance sheet.

    ---

    Notes:

    1. I track this spending through asset value changes in the balance sheet. That change in value excludes depreciation which turned to to be substantial in 2012: $2.44 billion.
    2. What follows is strictly hypothetical and based only on pieces of evidence that have become public hinting at an explanation but there is no proof.
  8. Using Capital Expenditures to predict Apple's share price

    Research · 96 comments

    It takes money to make money. That's a cliché. But it's also true. The interesting question is how much can be gained from how little.

    In previous articles I explained how Apple's expenditures of capital for equipment used in manufacturing affects their output of products. The relationship between capital in and product out should stand to reason.

    The more surprising aspect of that analysis is that we get to know in advance how much Apple spends (since they tell us their budget a year before it's spent.) and therefore it becomes possible to get a rough idea of how much they will produce. And since demand has generally been higher than supply we can get an estimate of how much Apple will sell.

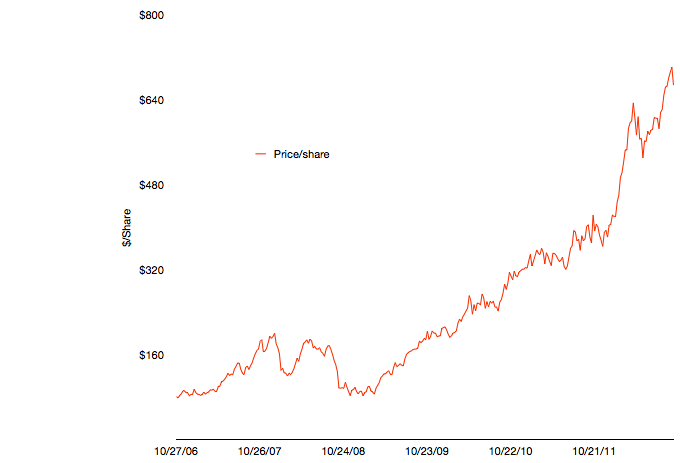
    The only missing piece to this logic chain is to estimate how much will shareholders benefit from the capital expenditure. I'll try to establish the relationship through a build-out of graphs.

    The first graph shows Apple's share price at weekly resolution.

    The time frame stretches back six fiscal years. The time span includes some dramatic periods including the financial crisis and the launch of the iPhone and iPad.

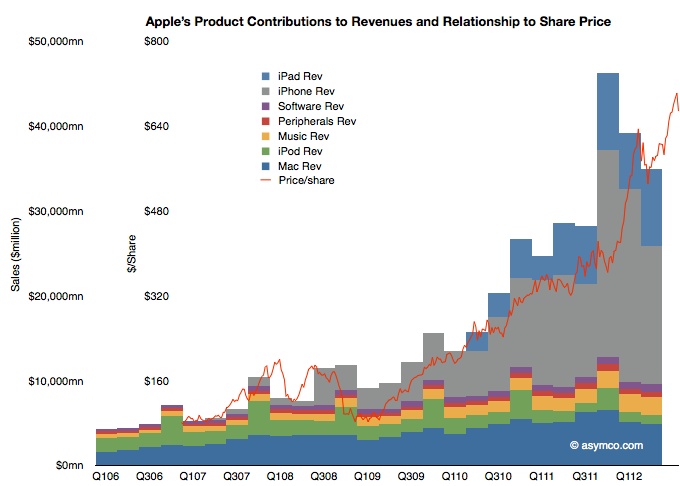
    To illustrate the effect of the iPhone and iPad on this share price appreciation, I've overlaid a quarterly resolution graph showing revenues over the same time period with each product line shown separately.


    Note that I've indexed the vertical scale to match approximately the highest peaks of both graphs. The two axes scales are shown separately on the left.

    The relationship between growing sales and growing share price is plain to see. Note that the iPhone and iPad account for the vast bulk of  sales growth and hence they are mostly responsible for the share price appreciation. Again, this should not be surprising. The scale gives an approximation of the relationship where $50 billion in quarterly revenue roughly yields a share price in the $700 to $800 range.

    As I've shown in the last post on forecasting production using CapEx (focus on the last chart) iOS device shipments (mostly iPhone and iPad) correlate with capital expenditures in the previous quarter. Using the historic relationship, the next two quarters could see a significant increase in iOS unit production. The sum of the low end of the range implies about 163 million units.

    If the relationship is therefore CapEx -> Production and Production -> Share price appreciation, then the transitive implication is that CapEx -> Share price appreciation.

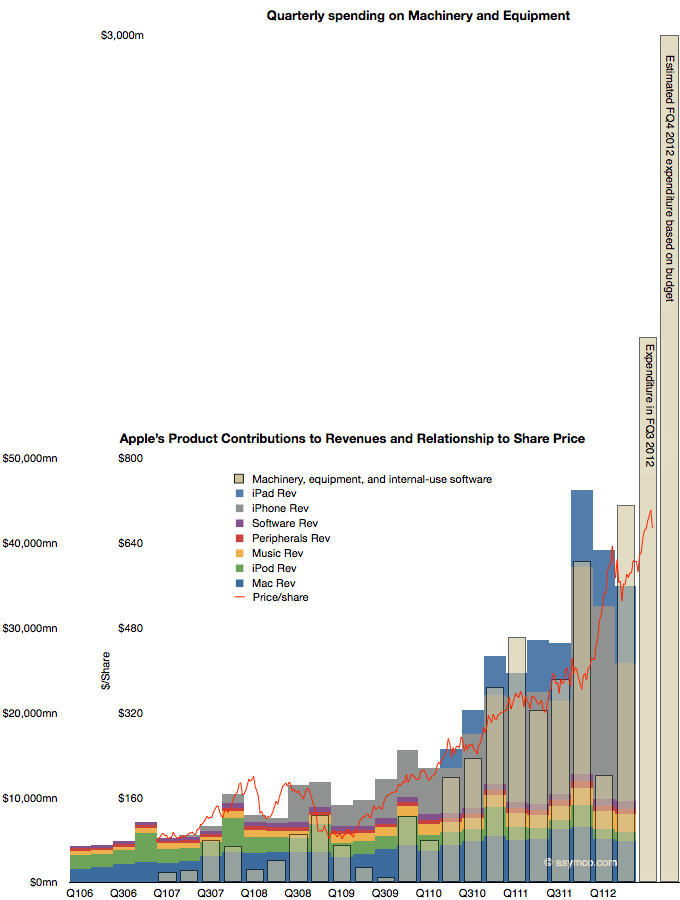
    That relationship would be illustrated as follows:

    The CapEx data shows the offset to the right due to the relationship with production being time shifted by one quarter. Recall that expenditures are booked ahead of output and therefore we have this apparent view into the future.

    The fourth fiscal quarter's spending has just ended and the output will be produced during October-December period.

    The obvious question is whether production will increase in response to spending (as it has in the past), or, put another way, will the stacked bar areas follow the beige bars and, furthermore, will share prices follow production (as they have in the past) and thus the red line will follow the beige bar.

    It takes money to make money. The relationship seems to be that $1.5 billion of CapEx per quarter yields a share price of $800. With spending reaching $3 billion per quarter will the share price reflect a similar ratio?

  9. Up to eleven

    Research · 54 comments

    During my talk at the first Apple Investor Conference in January I said that I would pay very close attention to the Machinery, equipment and internal use software line item from its PP&E during the next quarterly report (it appears on Page 13 in the latest report).

    The reason I consider this important is because capital spending has provided reliable foreshadowing of iOS device production. This is itself because Apple invests in the equipment used in the manufacturing processes for its devices. The more spending on equipment, the more production capacity is brought to bear and the more units are produced. Since iOS devices tend to be supply constrained, the more units are produced then the more are sold.

    The first quarter of the fiscal year saw a very small increase in CapEx which caused me to "backload" spending later in the year. By watching this spending, we can assess approximately when and for which products is investment allocated. If the spending happens early then we can anticipate an early update to the iPhone. If it happens late then we can anticipate a late release. So has the ramp-up begun as of the second quarter (first calendar quarter)?

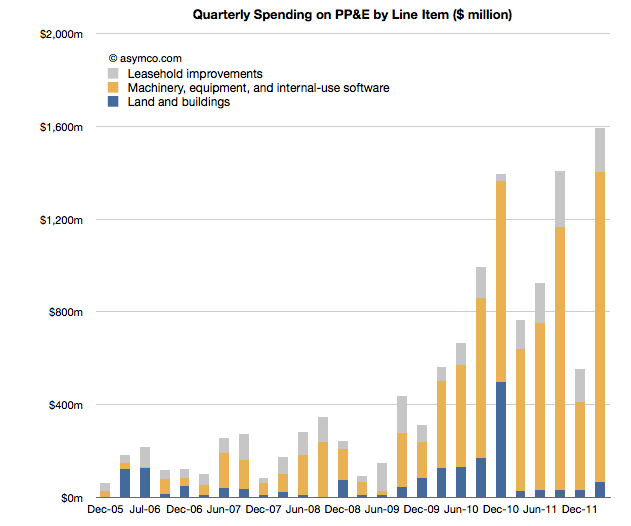
    The following chart begins to give us the answer. It tells the story of spending by tracking the change in asset values:

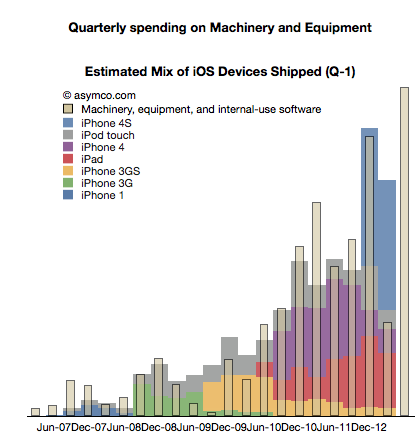
    Stripping out the Machinery and Equipment portion (in yellow above) and overlaying the following quarter's iOS shipments yield the following composite graph:

    It would appear that there is significant acceleration into the second quarter. Is it something significant?

    The increase in M&E is the highest for any quarter to date. Some of that is undoubtedly in service of the new iPad but some must also be the initial ramp-up for the new iPhone.

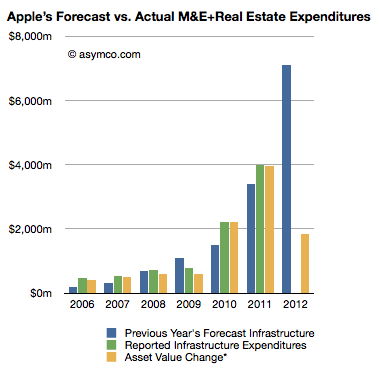
    To gauge it further however, we need to look at overall expectations. The company also signals future production plans though its yearly report. As I concluded from October's 10K, fiscal 2012 production should double from the year before (as it did from the year before that and the year before that, etc.)

    At $1.3 billion, the spending is substantial and a new record, but it does not make a big dent in the overall budget for the fiscal year. Half-way through the year, the total spending on M&E and Real Estate is still only 26% of the budgeted $7.1 billion. You can see the gap in the following chart. The yellow line needs to match or exceed the blue line after the next two quarters.

    In order to reach its own expectations, the spending therefore needs to double from the current rate to at least $2.5 billion/quarter over the next two quarters.

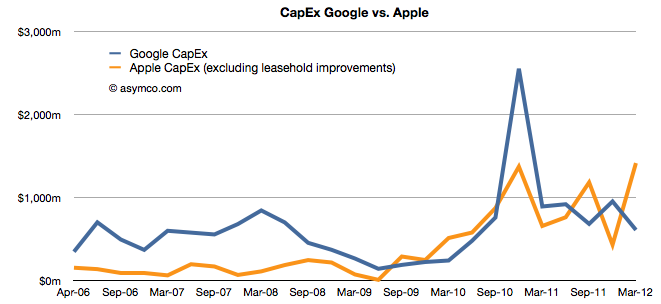
    Such numbers are hard to grasp. They are unprecedented not only for Apple but for almost any comparable company. Just as a reference point, they will have to exceed the historic average CapEx rate for Google by more than 100%.

    Regular readers will note that there is nothing new in this analysis. This is only an update in a continuing story. The pieces are in place for continuing the existing rate of growth.

    ---

    Footnote: for those who are unfamiliar with the idiom in the title: Up to eleven - Wikipedia, the free encyclopedia

  10. Are Apple’s investments in PP&E extraordinary?

    Research · 34 comments

    In his recent posts Horace took a look at Apple’s fixed assets and their development over the recent years. He also tested the hypotheses that Apple is making investments into machinery & equipment on which iOS devices are produced by overlaying iOS volumes with preceding changes in property, plant and equipment (PP&E).

    The question that has arisen is: Are Apple’s investments in PP&E extraordinary?

    To answer, I have compiled the capital expenditures (CapEx) for our previously established peer group [1].

    But first we need to clarify what CapEx include and not include. CapEx includes investment into property, plants, equipment, office furniture, larger IT hardware and in some cases patents; CapEx do not include investment into long-term marketable securities or other long-term financial instruments, acquisitions or capitalized R&D. Furthermore, CapEx are gross values and are not net of any sold equipment [2]. CapEx are largely depending on a company’s business model and strategy. For example if you are a manufacturer you need equipment to operate, if you are a software company or a retailer, your business will not be capital intensive.

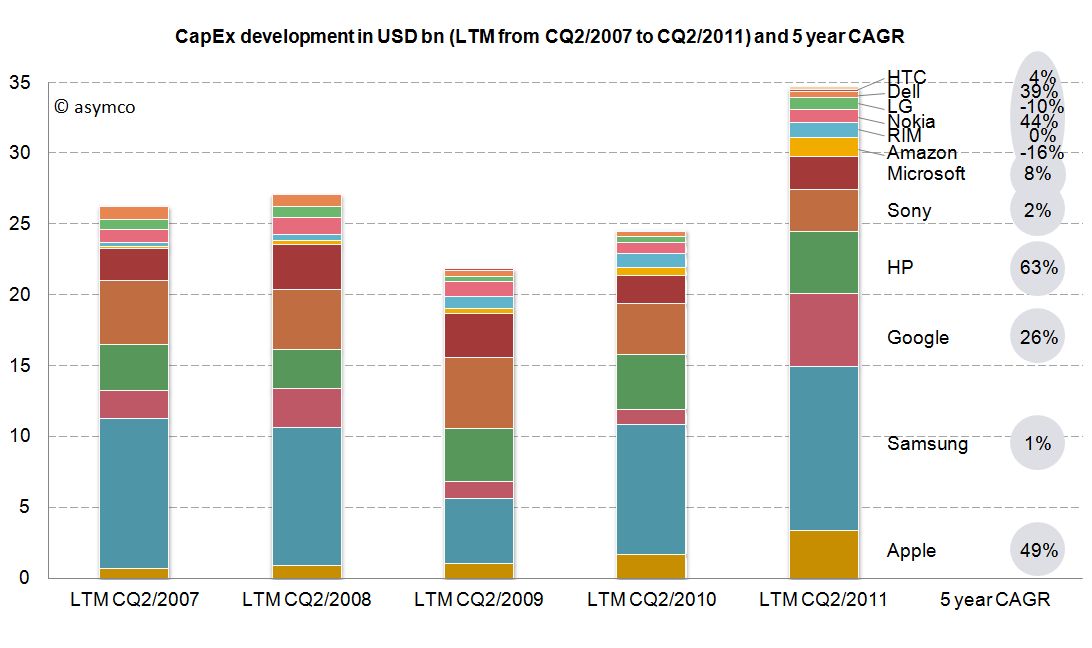
    As the second calendar quarter of 2011 is the latest quarter for which all companies have reported figures, we will take a look at last twelve months’ (LTM) figures from Q2/2011 backwards. The following stacked bar chart shows the combined CapEx of our peer group:


    The combined capital expenditures of our peer group for the LTM CQ2/2011 have outpaced even pre-crisis levels of investments and, combined, account for $34.7 billion. Samsung, a diversified manufacturer of IT hardware and other equipment, has invested more than $11.6bn with Google ($5.1bn), HP ($4.4bn) and Apple with $3.4bn following in line. While Google’s CapEx mostly account for its infrastructure of server farms and other IT hardware, HP’s CapEx mostly account for IT hardware it leases to its customers [3]. In absolute terms, Apple takes fourth place in CapEx spending for the last twelve months ending in CQ2.

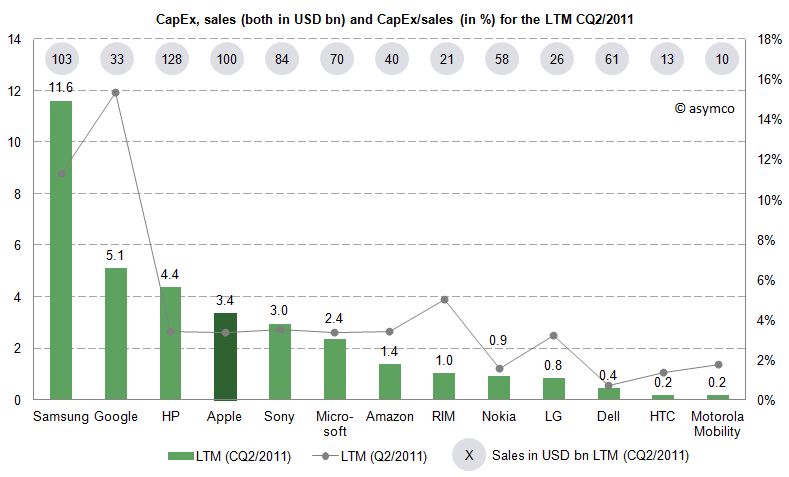
    Since the business model and sales magnitude varies largely in our peer group, we can also take a look at a common measure to compare CapEx intensity by dividing CapEx by sales achieved in the same period. For the last twelve months we can depict the following chart:


    The average of the peer group accounts for 4.4% of CapEx over sales. Samsung’s and Google’s business model are clearly more capital intensive, while Apple’s CapEx ratio of 3.4% is below the peer group average but above some of its peers like Nokia, Dell, LG, HTC or Motorola Mobility. Interestingly, capital intensity of HP, Apple, Sony, Microsoft and Amazon is at a comparable level of around 3.4%.

    As noted before, business models and strategies are significantly different among companies in our peer group. However, while Apple’s CapEx intensity is not extraordinary, Apple’s CapEx in absolute terms are among the largest in it this peer group and have grown constantly throughout a five year period.

    Is this a good thing and why does it matter?

    CapEx by itself does not tell us much. We still do not know in what companies specifically invest as financial regulations do not require detailed CapEx accounts. We know that even if a company is not growing assets they need to be maintained, upgraded and replaced – this spending is also called "Maintenance CapEx". Everything else can be called "Expansion CapEx" associated with new product launches, entry to new business area or geographies or expansion of (manufacturing) capacity.

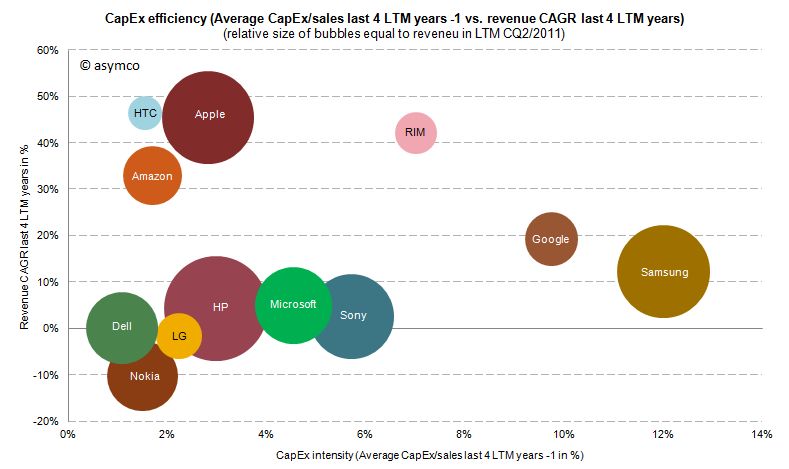
    Therefore, Expansion CapEx is closely linked to expected organic sales growth in the future. So let’s go ahead and link CapEx ratio of the previous years with the sales growth of the following year. The following chart shows the cumulative average growth rate (CAGR) over the last four years versus the average of CapEx/sales ratio of the four last preceding years:


    We can see that high CapEx efficiency has been achieved by Amazon, Apple and HTC with sales growth rates of 33-47%. RIM reached similar revenue growth but with higher CapEx intensity. Google and Samsung with high CapEx intensity have only reached modest growth rates. Dell, HP, Microsoft and Sony have not grown significantly but have close to average CapEx intensity.

    We cannot state that CapEx in absolute terms have been extraordinary for Apple, but we can witness that with below average CapEx/sales ratio Apple outgrew in absolute terms Dell, LG, Microsoft, Nokia and Sony and has grown close to the revenue size of Samsung and HP in the last four years.

    ---

    Notes:

    1. Excluding Lenovo (not reported) and Acer (extra-ordinary low numbers reported, to be investigated), Motorola Mobility figures only available for the last six quarters
    2. Minor differences may occur due to local Generally Accepted Accounting Principles (GAAP)
    3. HP assumes ownership of these assets and rents them to the customers who in turn have a smaller balance sheet and can run IT hardware CapEx through the income statement as lease expenses