Asymco

Asymmetric Intelligence

data center

  1. The new age of Capital Intensity

    Research · 117 comments

    In the post reviewing Samsung's Capital Structure I noted that its component divisions have historically taken 90% of capital investments and that the overall capital intensity for Samsung Electronics has increased in proportion to its component revenues.

    In another post regarding the capital structures of other technology companies with different business models I noted that Apple has changed its capital structure to a significant degree over the previous three years.

    In the following graph I combined these observations to show how capital expenditure patterns may be used to discern the underlying business model.
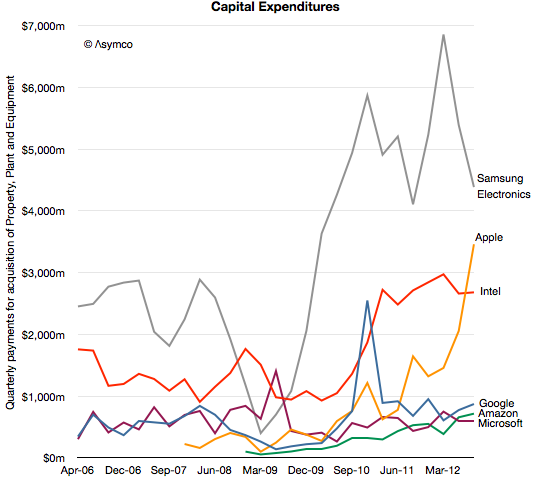
    I would group "cloud" or "platform" based companies like Google, Amazon and Microsoft as a cohort which, although spending significant amounts on capital equipment, do so mainly to support services. Their primary employment of capital is to sustain the infrastructure of data centers necessary to deliver the services underpinning their business models.

    I would group Intel and Samsung as "component" based companies which use capital to build production capacity that delivers, hopefully, a control point in the value chains they participate in. Note that I am assuming that Samsung Electronics' CapEx primarily targets semiconductors and displays as it did during the 2006 and 2007 period when data was available.

    Therefore, given the patterns over the last six years, it might be possible to classify a company's core business by just looking at its CapEx: The services group showing growth but relatively stable patterns and the components group showing more volatility, macroeconomic sensitivity and an overall higher level of spending, especially as a percent of sales.

    The question that pops up then is in what category does Apple fall?

    My observations for over a year have been that Apple is increasing its capital spending to such a degree that it is neither fish nor fowl. It operates data centers but presumably does not operate fabrication plants. And yet it spends more than Intel and Google combined.

    Contrasting Apple and Samsung Electronics tells an even more interesting story. In the following graph I've added two additional items of information: First, although CapEx spending is recorded in the cash flow statement, Apple reported in its yearly (10K) report that it spent an additional $2 billion for equipment which did not pass through cash flow.

    If we were to add $1 billion to each of the previous two quarters, the graph would look like this:
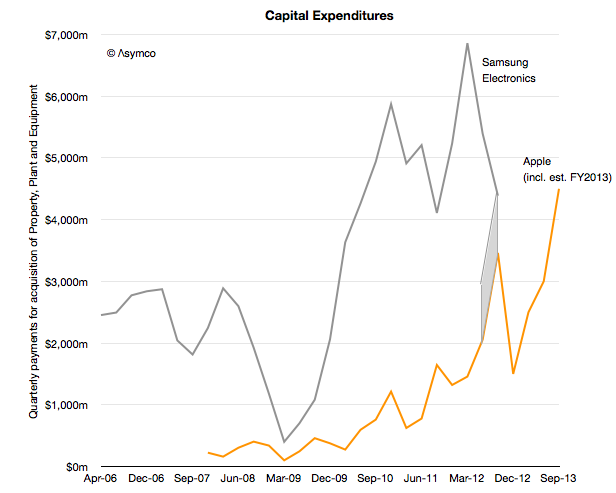
    The second piece of information is that Apple projected its spending for the following fiscal year. I've added that spending in a pattern matching the last fiscal year.

    Apple is still spending less than Samsung. In its fiscal year 2012 Apple spent about $10 billion while during the same time frame Samsung spent nearly $22 billion. However, Apple has begun to bump against Samsung's spending level on a quarterly basis.

    I consider this extraordinary evidence of an extraordinary shift in strategy.

    For a year we've been debating here to what degree Apple has a "capital intensive" business and what exactly could it be spending capital on. One early hypothesis has been that it's on data centers or on real estate for spaceship campuses. These can be easily dismissed on the knowledge that they can't cost that much (and that the spending happens gradually). Another hypothesis is that the tooling for milled aluminum cases and other mechanical components is expensive and Apple has to buy a lot of it. But, again, the level of expenditure is in the league of Intel and Samsung which make vast quantities of semiconductors in very expensive plants. It's hard to imagine milling machines being cost equivalent to chip foundries.

    The comparison with Samsung, whose vast capital commitments are legendary and are its primary strategic asset puts Apple in a new light. Perhaps we can't yet call Apple a semiconductor company or even a fabricator but they are putting their "money where their mouth isn't". We can infer that it's not going where the company currently operates. The capital is being deployed almost silently and, though vast in scale, barely gets a mention from analysts. Not even a single question has been raised at any earnings call about this spending.

    So what tale does this capital tell?

    One interpretation is to apply the value chain disruption theory and ask whether Apple is acting to counter a potential disruption. In other words, that this is a specific threat response from an incumbent. There is some logic to this because  the antagonism between Samsung and Apple is so strong that it might justify a reaction of this kind.

    However, I believe that there is a more measured process at work over a long period of time. The one distinguishing advantage and attribute that Apple has  is its preference for integration. This preference is not a secret and Tim Cook repeats it often. The integration is evident with their move into retail and component design, in other words in both directions along a value chain. So my hypothesis is that this is part and parcel of an ongoing re-alignment of their role in the value chain.

    This second explanation suggests that Apple simply wants to control all the areas which affect the value they produce. First because they feel that there are areas that are not good enough and the product/experience cannot be good enough if its constituent parts are not good enough. Second because without control there are constraints to what it can do strategically.

    Whatever the reason, I read the evidence of increasing commitment and engagement in parts of the value chain as part of a continuous evolution of Apple's role. Furthermore, it's something that should be seen as a signal of a new era in how technology companies operate. We see hints of "vertical integration" with Microsoft building hardware, and Google buying Motorola and Amazon selling devices. Apple did all these things and now it casts an eye over the next frontier: components.

    ---

    If you want to learn more about the future of the technology industries and the evolution of value chains, consider participating in Asymconf.
  2. The down payment on iCloud

    Research · 96 comments

    Balance Sheets are not typical targets of focus in software or services or "high tech" companies. Except for Cash, there are usually not much in terms of assets for analysts to contemplate. With outsourced manufacturing, even hardware companies don't maintain depreciable assets on their books.

    Apple, as usual, is different. It turns out there is a lot there and there's a lot to learn from what's there. I've looked at the Cash and Long Term Securities in the past but in the next few posts I'll dive into fixed (non-current) assets. Specifically Apple's Property, Plant and Equipment.

    Apple Inc. has selected North Carolina as the location for a new data center and will invest more than $1 billion in the project over nine years, Gov. Bev Perdue announced

    via It's Official: Apple iDataCenter to North Carolina » Data Center Knowledge.

    When Apple committed to the North Carolina data center in mid-2009 the iPhone was two years old. Only 26 million iPhones had been sold to date (about as many as Apple now sells every quarter.) Clearly if the commitment was on such a scale there must have been a plan. A big plan.

    We don't know for sure if NC was used last week or whether it was handling only part of the load, but let's assume it was. What I want to think about is how much iCloud would thus cost and hence what would be the cost for alternative providers of such a service. That analysis might let us determine if "cloud" forms a substantial barrier to entry for competitors.

    Beside the public statement above (which may have been designed for political benefit) can we find any evidence of what Apple spent on data centers? That's where the PP&E line comes in.

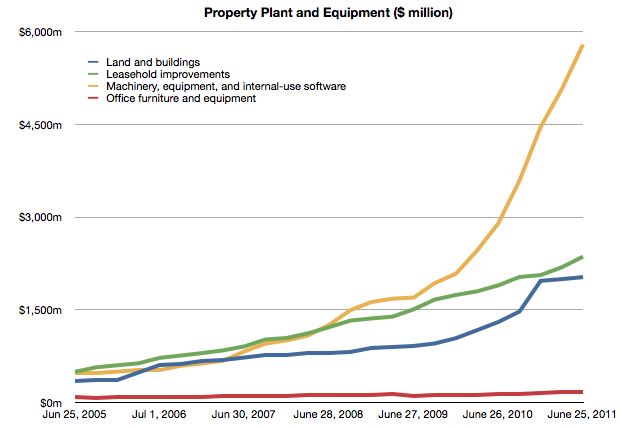
    The following chart shows the Property, Plant and Equipment asset in Apple's Balance Sheet.


    Each line represents a particular type of asset and its value at a particular point in time. I will now pay attention to the blue line, Land and Buildings. I'll look at the other lines separately.

    Note that each line represent current value so it does not say directly what was happening in the quarter. However, if we look at the change q/q for a particular line we get how much new spending occurred in the quarter for that particular asset.

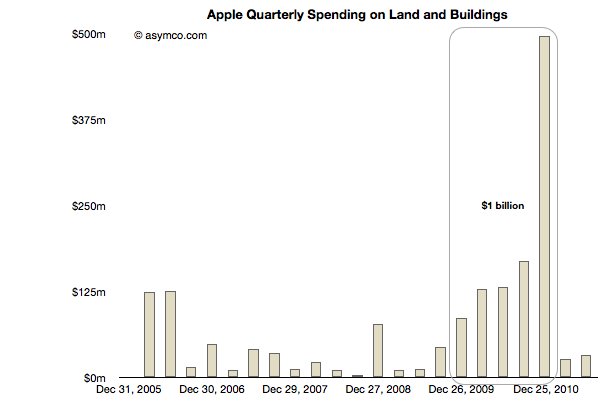
    This change in Land and Building asset value is shown in the following chart:

    Going back to 2005, there were minimal changes. Perhaps there is some significance in the $250 million spend in early 2006 or the nearly $78 million spent in Q4 2008, but there is a definite significance to the massive spending that occurred right after the NC commitment was made.[1] Some of that payment also included the old HP campus in Cupertino. "Local real estate experts said HP’s asking price may have been $300 million or more, but they also said the final amount may have been less."

    There is also a clear cut-off on that spending at the end of 2010.

    The total spending during this time adds up to nearly exactly $1 billion. If we subtract $250 million for the Cupertino expansion we still have $750 million that must have gone into NC.

    Note that the original statement quoted above was $1 billion over nine years. We can see that Apple spent $0.75 billion in one year. On the building alone. This is why I consider this a down payment. It does not include any of the equipment in the plant. It does not include the cost of operation (incl. labor) or any development costs (R&D). In fact, it does not include any of the funds that would be part of the nine year commitment.

    What this level of spending implies is that iCloud (and Siri and iTunes) are expensive. They may seem ephemeral and even trivial as services, but they require a staggering commitment few can make. Apple made that commitment and they made it early on, before the first quarter billion users were even on the horizon.

    If platforms are moving from local to distributed and if value moves from selling things to "getting to know you" and if that knowledge requires infrastructure control then the number of companies that can participate in the market shrinks dramatically. Not only in terms of who has the capabilities, but who could even afford to acquire them.

    The invoices Apple pays are shown above.

    ----

    Notes:

    1. Apple's retail stores are not included in these figures as Apple leases them. The cost of the stores will be discussed in a separate post.
  3. It takes nearly $1 billion/yr to run iTunes

    Research · 44 comments

    In recent articles I highlighted the acceleration in iTunes App downloads where the rate is approaching 18 million apps per day and the cumulative total apps which is about to overtake the cumulative songs downloaded.

    We now turn our attention now to constructing the iTunes income statement: namely total sales, gross margins and deduce its operating budget.

    Gross Sales

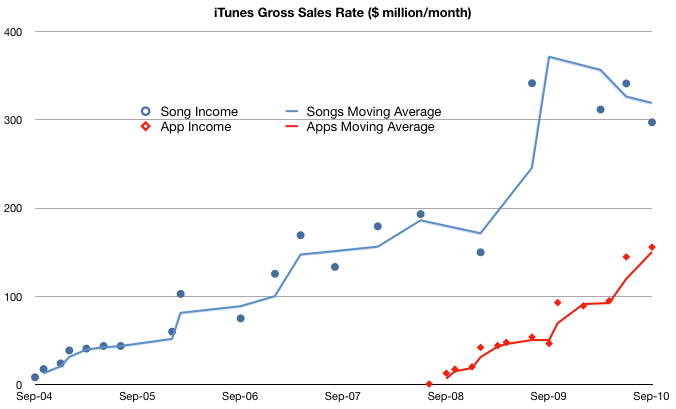
    To obtain the top line (income) for iTunes we need to know the average selling price (ASP) for songs and for apps. Apps are easy, we received that info in June: $0.29 per app. For songs, it was easy before early last year: $0.99/song. After the selective price increase, the blended price needs to be estimated. I chose $1.10 for 2009 and $1.2 for 2010. These are just assumptions and can be adjusted but should give us a rough estimate:

    I followed the convention of using income rate or $/month to show the history of sales. It shows that even with a price less than a third of the music product, apps are generating over half of the sales of music. In other words, apps are adding 50% to iTunes sales today. If the decline in music units continues and the app sales increase with the current trajectory then app sales value will overtake music sales next year, consistent with the cross-over of cumulative units sold.

    Gross Margin

    If we know how much Apple pays music licensors and developers (i.e. cost of goods sold) we can calculate how much it keeps for operations (gross margin). Apple's app margin is 30 percent. The music margin was never official but the consensus has been 10 percent for a while.

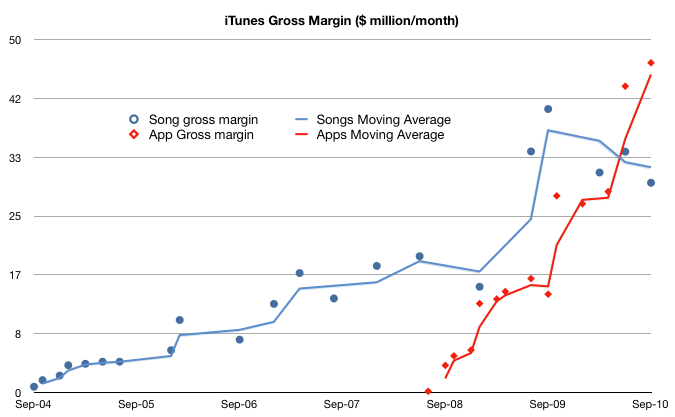
    Using these figures, we get the following chart:

    This shows that what is left after paying the content license, Apple "keeps" about $50 million every month to run the App store (iTAS) and another $30 million to run the Music store (iTMS).

    The Operating Budget

    Apple has made a point of saying that both iTAS and iTMS are run at "break even" implying that the gross margin is used up in operating costs (CAPEX, R&D, SG&A). To be sure, the cost of bandwidth and the data center(s) needed must be considerable.

    But the operating budget for the store is beginning to reach a level that may be beyond what can be spent reasonably. The amount left over for operations has increased from ~$30 million a month in 2009 to $75 million/month today.

    In fact, if this burn rate is maintained (even though it's increasing) the operating budget for iTunes is nearing $1 billion/yr.

    I'm not an expert on the cost of operating data centers but $ 1billion a year seems like a lot. I would love to see an analysis of how this could be allocated.

    Implications

    I would also add that because of the increasing mix of apps, the overall gross margin percent is increasing. I estimate that to be a blended 17%--a healthy margin for a content store--and an increase from 10% before the app store came online.

    Finally, one implication of the economics involved is that a budget like this may provide a significant barrier to entry for any competitors looking to take on the iTunes juggernaut. iTunes has reached content critical mass (12 million songs), user base (160 million users) and wide distribution (23 countries for songs and 80+ countries for apps).

    These are non-trivial operational issues that even the best in the "cloud" business models will find challenging.

    Footnote:

    This discussion excludes video sales, rentals, book sales as we don't have solid histories for these product lines. However, we can do a spot check on the cumulative totals:

    • 450 million TV episodes downloaded implies $1 billion in sales.
    • 100 million movies downloaded probably adds at least another $1 billion
    • 35 million books adds another 500 million.
    • Compare with 11.7 billion songs at ASP of $1 for about $12 billion in song sales and 6.5 billion apps at ASP of $0.29 or about $1.9 billion.

    iTMS content downloads have generated $16.4 billion in sales to date.