Asymco

Asymmetric Intelligence

earnings

  1. Pricing Paradox

    Research · 148 comments

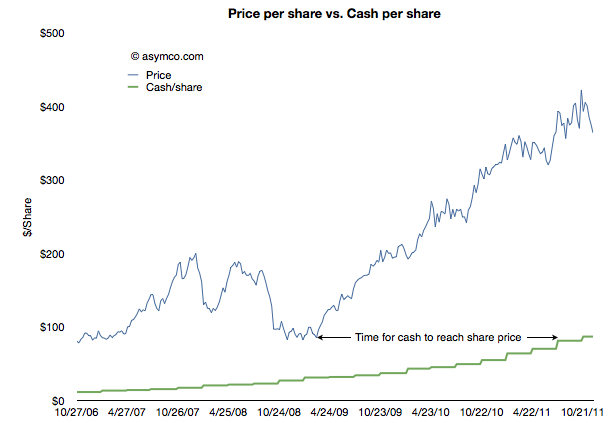
    As Apple's extraordinarily low valuation is being more widely noted, explanatory hypotheses are proliferating. Everyone seems to have an opinion. Some explanations come in and out of fashion. Others are reliable old clichés. We've seen liquidity issues with large funds forced to sell, "too much cash", management transitions, an impending loss of mojo, share price too high to afford, "law of large numbers", and that old chestnut, competition. None of these satisfy. They don't explain why reliable growth is not valuable. And reliability is indeed what Apple offers in spades. Consider the following chart:
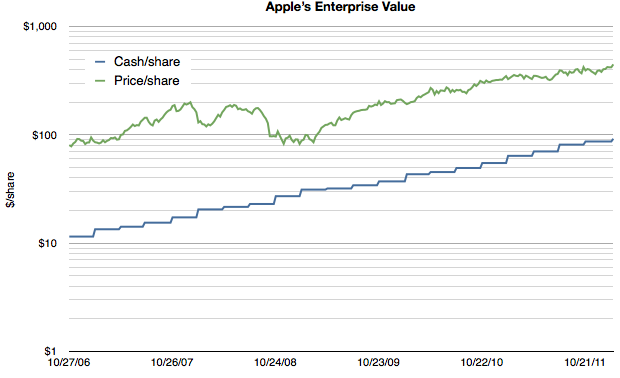
    Note that the scale is logarithmic so that the growth patterns can be seen clearly.

    It shows Apple's cash/share vs its price per share. First, it should be noted that the company's cash has been growing reliably on a log scale, increasing by a factor of 10 in five years. As a proxy for retained earnings, the cash trajectory shows exceptionally predictable earnings.

    Second, although the share price has grown it has not grown either as reliably or as quickly. It's as if the reward for reliable earnings is a significant dissent.

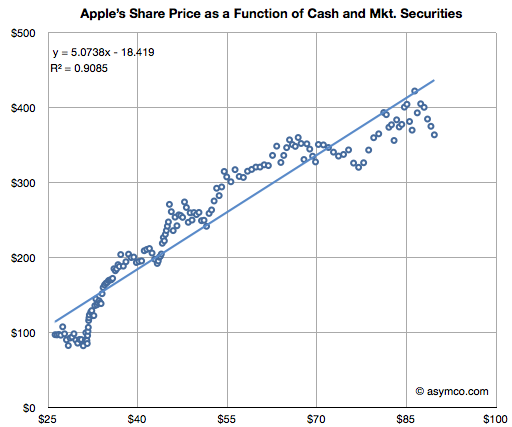
    Third, if we subtract the cash/share from the price/share we obtain the enterprise value (EV) per share. The EV reflects the future value built into the price. It reflects the expectation of more earnings. In the chart above one can see the shrinking of the gap as a multiple of the cash value. To bring that gap into focus, I prepared this chart showing the percent of the share price allocated to past value (cash) and future value (EV).
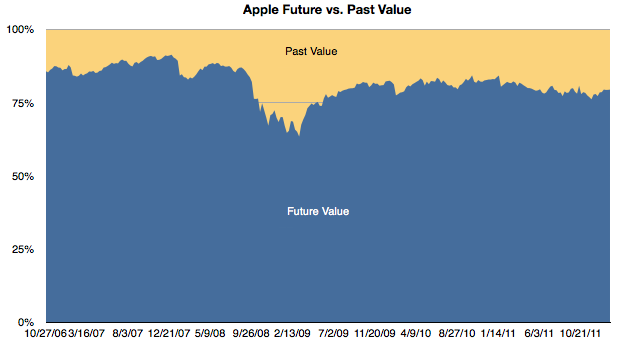
    One can see the gradual erosion of emphasis of future value. With the exception of the credit crisis induced equities crash, future value as a percent of total value is at a new low. In late 2006 the future was was about 86% of the share price. At the end of last week it had dropped to 79%.

    Another way to interpret this is that in 2007 when the iPhone was born nearly 90% of the business value was thought to be in its future. Today only 80% is future value.

    To clarify further, if a company reaches a price where 100% of its value is cash then it's seen as having no future value. Having any significant portion of the price attached to the past is extremely rare for a growing company and I would say unheard of in a company growing as rapidly as Apple is.

    This preoccupation with the past and discomfort with the future is, I believe, the key to understanding the valuation paradox for Apple. I have gone over the conventional metrics of P/E and P/E/G(trailing) that illustrate absurd pricing (updated below). But they don't help explain the mis-pricing.

    A disruptive company is inherently unpredictable. Success and growth are unrewarded because there no understanding of the underlying causes of these phenomena and therefore there is no expectation of repetition.

    In other words, a five year dead-straight line of logarithmic growth is not a sign of anything resembling reliability if the underlying causes are not understood. Today Apple is still a mystery wrapped in an enigma and without a causal understanding of its suceess its pricing will remain paradoxical.
  2. Apple's Fourth quarter 2011 Growth Scorecard

    Research · 53 comments

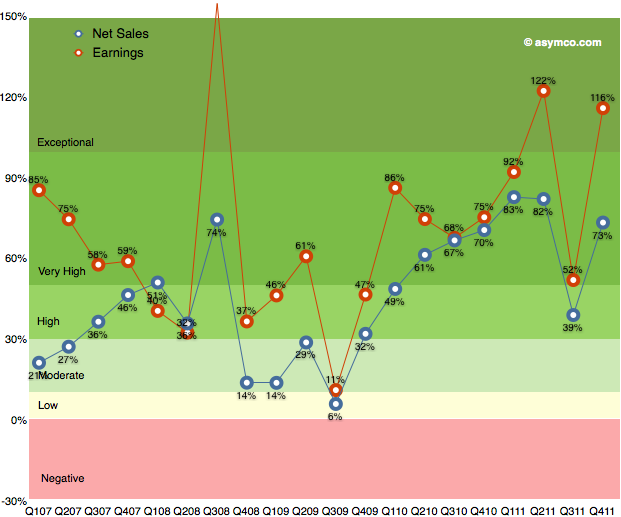
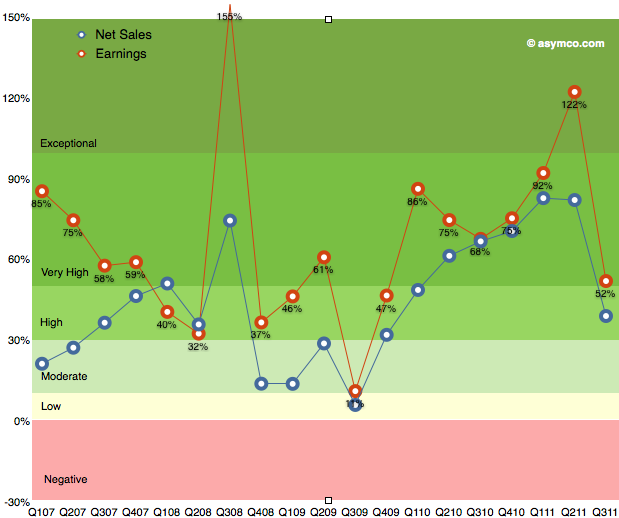
    After the transitional third quarter, Apple's earnings growth returned to an exceptional level. As the following chart shows, earnings growth has maintained above 50% growth since 2009.

    Q3 turned out to be a transitional quarter with 52% growth but Q4 proved to be  "exceptional" with growth above 100%.  This is the third highest rate of growth in the five year span shown. Sales growth was also very near the top of the range, coming in fourth historically.

    When looking at the components making up sales, we can see each product line's revenue growth in the following table: 

    The growth leaders were also the largest product lines in terms of revenue. iPhone and iPad had triple digit growth rates and that translated into the bottom line growth.

    Music related products and services which Includes revenue from sales from the iTunes Store, App Store, and iBookstore in addition to sales of iPod services and Apple-branded and third-party iPod accessories grew at 42%. This is the highest rate during the time frame shown.

    Peripherals which Includes revenue from sales of displays, networking products, and Apple TV was next with 29% revenue growth.

    The Mac line followed with 22% growth and Software which includes sales of Apple-branded and third-party Mac software, and services through the Mac App Store grew at 7%.

    The iPod line continued to shrink with -26% decline.

    I used color coding in the table to show the patterns of change and what I note is that the iPhone and iPad lines continue to be exceptionally fast growing businesses. The duration and amplitude of these streaks of growth should be a clear signal about the dynamics of these markets and Apple's role within. Too often, I find, these signals are ignored.

  3. On being reasonable

    Research · 144 comments

    The discussion on why Apple is cheap was very useful. The debate brought into focus the possible causes for pessimism in the face of overwhelming evidence to the contrary. But maybe there is yet another explanation. The way the data was presented was as a difference between historic and projected growth rates. Is this the way analysts actually think?

    Perhaps they don't project growth based on historic growth, but project earnings given historic earnings. In other words they don't look at the first derivative (change in earnings) but the  shape of the actual data.

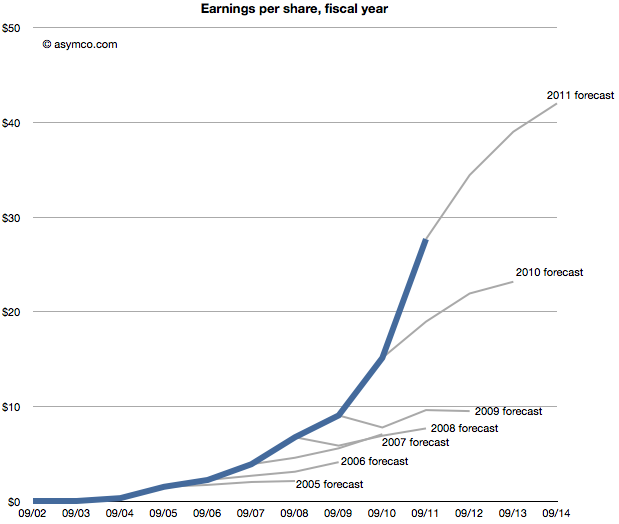
    The following chart shows that data, i.e. forecasts as an extension of a sales trajectory. The blue area are actuals and the grey branches show projections at a given end of fiscal year.

    Seen this way, we can imagine how the projections can be considered "reasonable". Some appear to be linear extrapolations while others show up as the end of "S-curves".[2]

    What none of them imply is  exponential growth. But would forecasting exponential growth be considered reasonable? Clearly not since it's never been consensus. But disruptive companies do follow non-linear growth. In fact, every company that has gone from being small to being big (which is to say all large companies) went through non-linear growth phases. The "natural" shape of growth is exponential.

    The failure is therefore not of reason but of failing to use a model that assumes acceleration of sales. I believe that institutional financial advisors are conditioned (or coerced) into assuming that nothing unreasonable ever happens. That seems like a completely flawed foundation to stand on.

    ---

    Notes:

    1. This post is inspired by the New York Times chart showing budget forecasts.
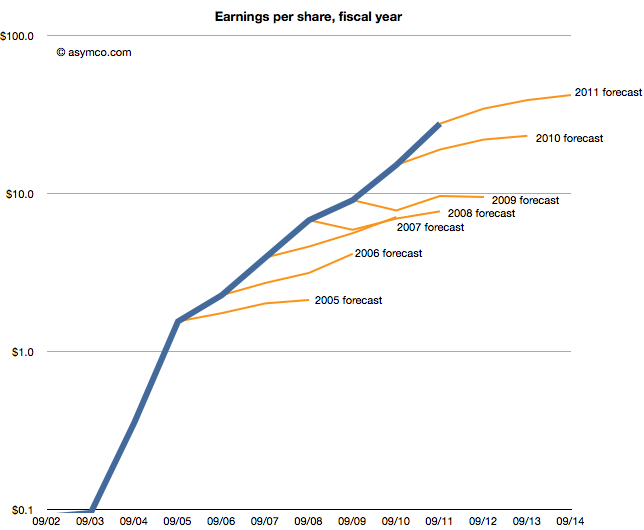
    2. The same data shown on a log scale: 
  4. Why Apple is cheap

    Research · 186 comments

    Imagine it's late 2005. Apple's fiscal year just ended and they reported their performance. You're an analyst whose job includes forecasting the company's performance for next year. This is a weighty responsibility.  Your forecast will be blended with those of your peers and used as a "consensus" average. That consensus for the next year will be used to measure the current value of the shares in a ratio called the forward PEG or Price/Earnings/annual earnings Growth. You are supplying the earnings and hence growth forecast while the market offers a price.  As a stock is meant to measure future earnings, your forecast is a crucial and frequently cited figure about whether a stock is priced fairly.

    There is some comfort in knowing that there will be many others who will offer such a forecast and your contribution is thus not the only way investors can calibrate the price. However, you should think hard about what you are predicting as it also will reflect your skill in predicting such a visible company.

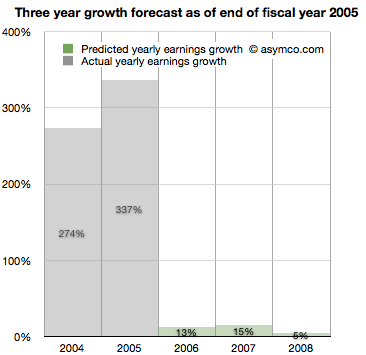
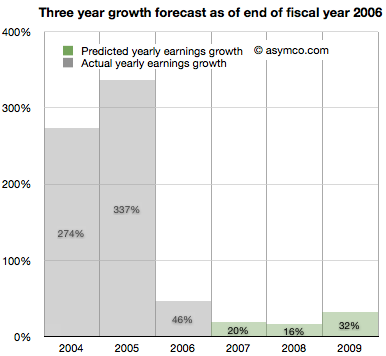
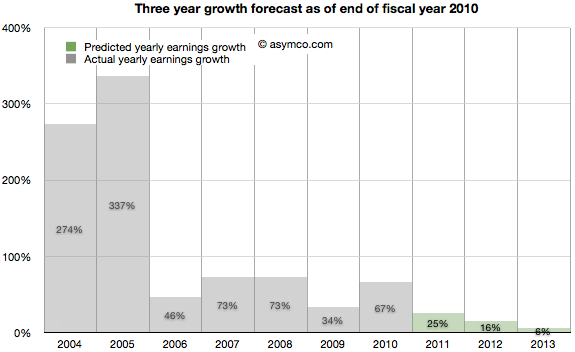
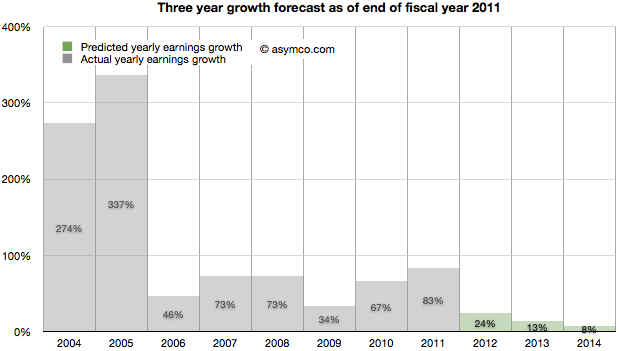
    Apple just had a tremendous two years. 2004 and 2005 saw EPS grow at 274% and 337%. This is largely due to the runaway hit iPod. Given all that is known about the company, what will you put forward? While you're at it can you also forecast two years forward, namely provide a growth forecast for 2006, 2007 and 2008?

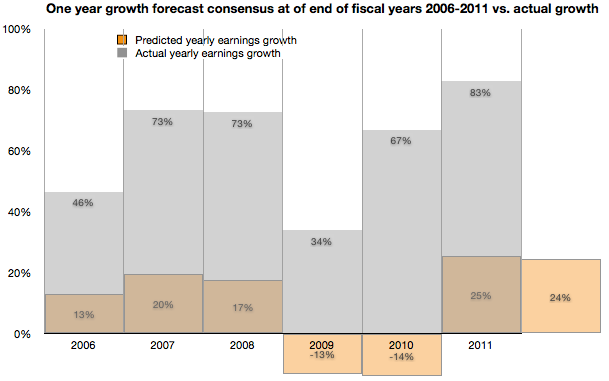
    Here is what you and your cohorts publish as a consensus:

    You go with a 13% growth for 2006,  15% for 2007 and 5% for 2008. The chances are, you reason, that the iPod will not carry the company's growth much longer. The competition is sprouting all over and Microsoft is rumored to be launching its own music player.

    It makes sense to be conservative and offer a modest growth of 13%. At the same time you can rate the stock a buy as it is still growing. The stock just doubled in the last 12 months and the law of large numbers says that growth cannot last at the same rate as we've just seen.


    It's now late 2006. Apple just closed out another big year. Contrary to your forecast last year, the company grew at a rate of 46%, more than three times faster than you expected.

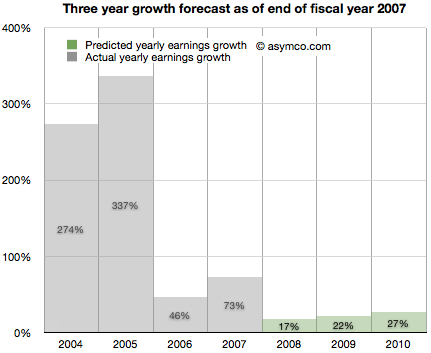
    It turns out the iPod still has some legs and the company's Mac business seems to be growing. Looking forward you take your 15% growth for 2007 and increase it to 20% and suggest 16% for 2008 and 32% for 2009.

    There are rumors of Apple getting into the phone business.


    It's now late 2007. Apple just launched the iPhone and even though it was available in limited numbers on one carrier for one full quarter, the company still turned in an amazing 73%. Again more than three times faster growth than you forecast. What do you do about 2008?

    It might make sense to increase the previous 16% estimate to 17% but since there is a real estate bubble brewing, the 32% growth for 2009 should come down to 22% and defer that growth out to 2010, dialing in 27%.

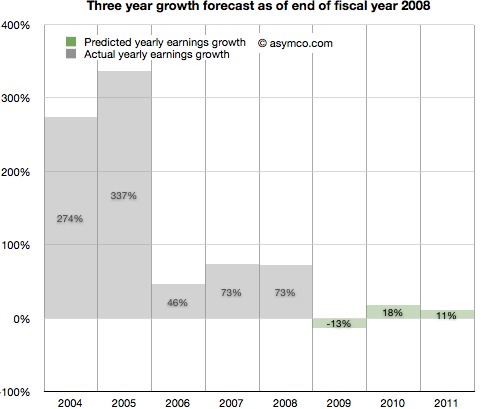
    It's now late 2008. Apple closed out another huge year. 73% growth was once again more than triple your forecast of 17% growth. It's clear that the iPhone is a huge hit.

    However, there is a credit crunch and talk of a huge recession, even depression looming. Apple is a luxury/premium brand and it is unlikely that those expensive products will sell well into these "macro headwinds". You predict a decline in the earnings of 13% in 2009, inline with many other tech stocks. You are optimistic however that 2010 will be a year of recovery and predict 18% increase from recession lows followed by a more reasonable 11% growth in 2011.

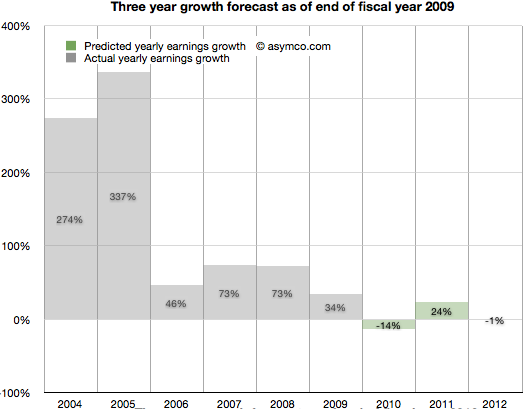
    It's now late 2009. To everyone's surprise, Apple grew through the credit crisis. It turned in 34% growth (vs. your predicted 13% decline). The success is hard to believe but the iPhone had a lot to do with that. There are new competitors coming and the recession has proven resilient. With unemployment still high you predict 2010 will still be a tough year. You go with -14% growth for 2010 and postpone recovery out to 2011 with 24% "bounce". Longer term you see 2012 as a flat year, with Apple earnings shrinking slightly by 1%.

    2010 ends with Apple achieving 67% growth. Shocking relative to a -14% growth forecast. But then again, Apple launched the iPad and who could have thought that was a hit? Apple achieved growth throughout the recession and it looks like it might keep going. Your 2011 forecast of 24% looks weak so you increase it to 25%. The 2012 decline thesis is abandoned in favor of 16% growth and, given the likely competition in smartphones, you tone down growth in 2013 to 6%.

    It's November 2011. The company turned in 83% growth. It's  more than three times faster than your forecast. Some people are suggesting that Apple may have a lot of headroom with the iPhone and iPad but the law of large numbers is what it is. The company became the largest by market cap in the world and Android is gaining huge market share. However, in deference to their strong recent performance you increase the 2012 forecast from 16% growth to 24% growth. 2013 goes from 6% to more than double: 13% and 2014 is when growth begins to slacken, though still a healthy 8%.

    As the following chart shows, look ahead one year accuracy has not been all that great, but you are at least consistent. In any case, everything you based your decisions on showed remarkable consistency with consensus. You're just reflecting common sense.

    Note:

    • Though the numbers are all real, the narrative is fictitious. I suspect however that the truth is actually stranger than this fiction.
  5. Estimates for Apple's first fiscal 2012 quarter

    Research · 60 comments

    As the chart below shows, the last quarter (third calendar, fourth fiscal 2011) was slow with only 52% earnings growth. The discussion centered on the (surprisingly) disruptive effect of the iPhone transition. Surprising since most analysts, myself included, were lulled into thinking that the portfolio of iPhones and their wider distribution would create a smoother sales pattern vis-a-vis the more cyclical pattern seen in the first three years of production.

    The second quarter was surprisingly strong and the third was surprisingly weak. So how do we estimate the fourth?

    We have the pent-up demand for the new iPhone, we have the dynamics of holiday spending and we have a question mark on pattern of growth for the iPad. I'll discuss each assumption in turn:

    The first assumption remains that iPhone growth is approximately 100% for the full year. Last calendar year there were 47.5 million iPhones sold. A 100% growth would imply about 95 million for this year. So far 56 million were sold. To reach a doubling then 39 million would need to ship in Q4.

    Another approach is to look at quarterly growth rates. Thus far, we've had 113%, 142% and 21% for the first three quarters. To reach an average of 100% for the year then the fourth quarter would need about 120% or 36 million units.

    36 to 39 million would be a good bounding range if there were no other mitigating factors. The information published so far shows no particular problems with either production or access to markets so I'm going to go with 35.7 million.

    The second major assumption relates to the iPad. The iPad has been a challenge to predict since launch. Not only is it a new category but it comes with a different launch cycle than the iPhone and has significant constraints on production. There have been only two quarters where we could measure y/y growth: 182.8% in Q2 and 165.6% in Q3. I was initially tempted to dial in 150% for Q4 but the question of transition comes up. The first iPad model grew well into the holiday quarter but dropped dramatically into the first as it went through the transition to the iPad 2.

    Are we going to see the transition effect earlier this year? I'm being cautious and suggesting only 100% iPad growth or 14.6 million units this quarter. This is still a very challenging product to forecast.

    So here are my fourth calendar quarter forecasts (with y/y growth in parentheses):

    • iPhone units: 35.7 million (120%)
    • Macs: 5.2 million (27%)
    • iPads: 14.7 million (100%)
    • iPods: 13.6 million (-30%)
    • Music (incl. app) rev. growth: 22%
    • Peripherals rev. growth: 25%
    • Software rev. growth: 25%
    • Total revenues: $44.6 billion (growth: 67%)
    • GM: 42.0%
    • EPS: $12.3 (91%)

    This earnings value would imply a trailing twelve months' EPS of about 33.5. At $390/share the P/E would be 11.6. Cash and equivalents may increase to $90 billion.

  6. Does Growth Matter?

    Research · 85 comments

    In last week's discussion of Apple's (historically low) valuation, comments arose that perhaps the company's discount is not unique. Can we look at comparable companies and determine whether the relationship between growth, size and valuation are consistent?

    The challenge is in finding "comparable" companies. Apple is characterized by being large in terms of market capitalization, highly profitable, in the technology sector and growing relatively quickly. One can find a cohort of companies with each of these characteristics but not all.

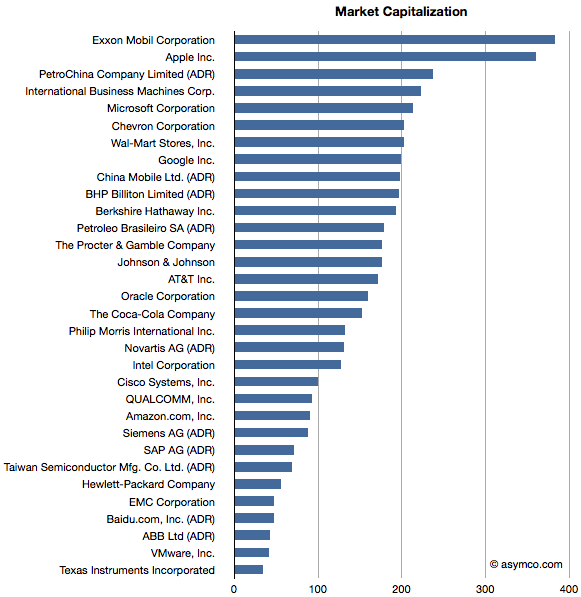
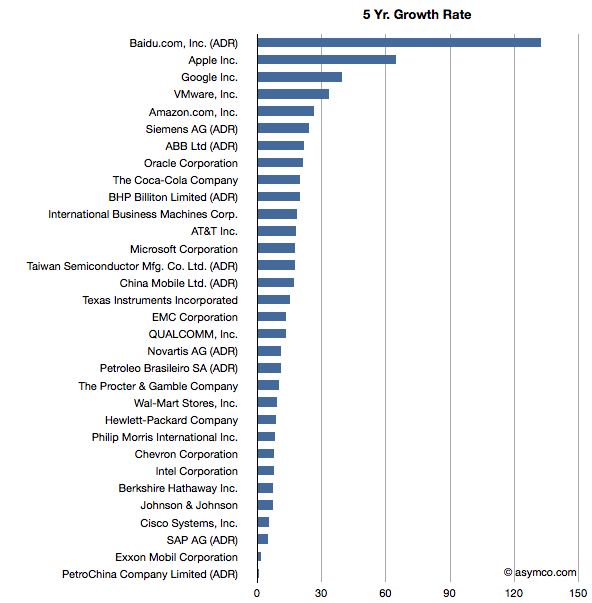
    Here is an attempt at looking at the largest companies by Market Capitalization (the so-called Mega-caps) to spot patterns of valuation. Some of the companies in the top 20 mega-caps were technology companies so I thought I'd highlight them. I then also added a few of the top 20 technology companies by capitalization to create a larger sample.

    The group I settled on is shown in the list below ranked by market cap.

    Companies below $130 Billion in market cap (i.e. below Novartis) are in the top 20 technology list but not in the top 20 overall list.

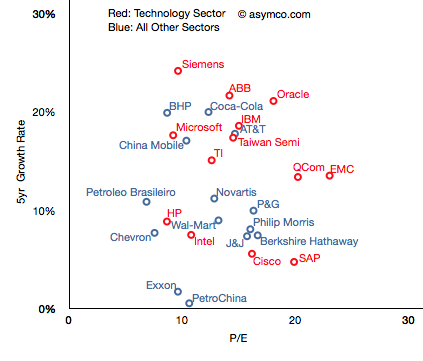
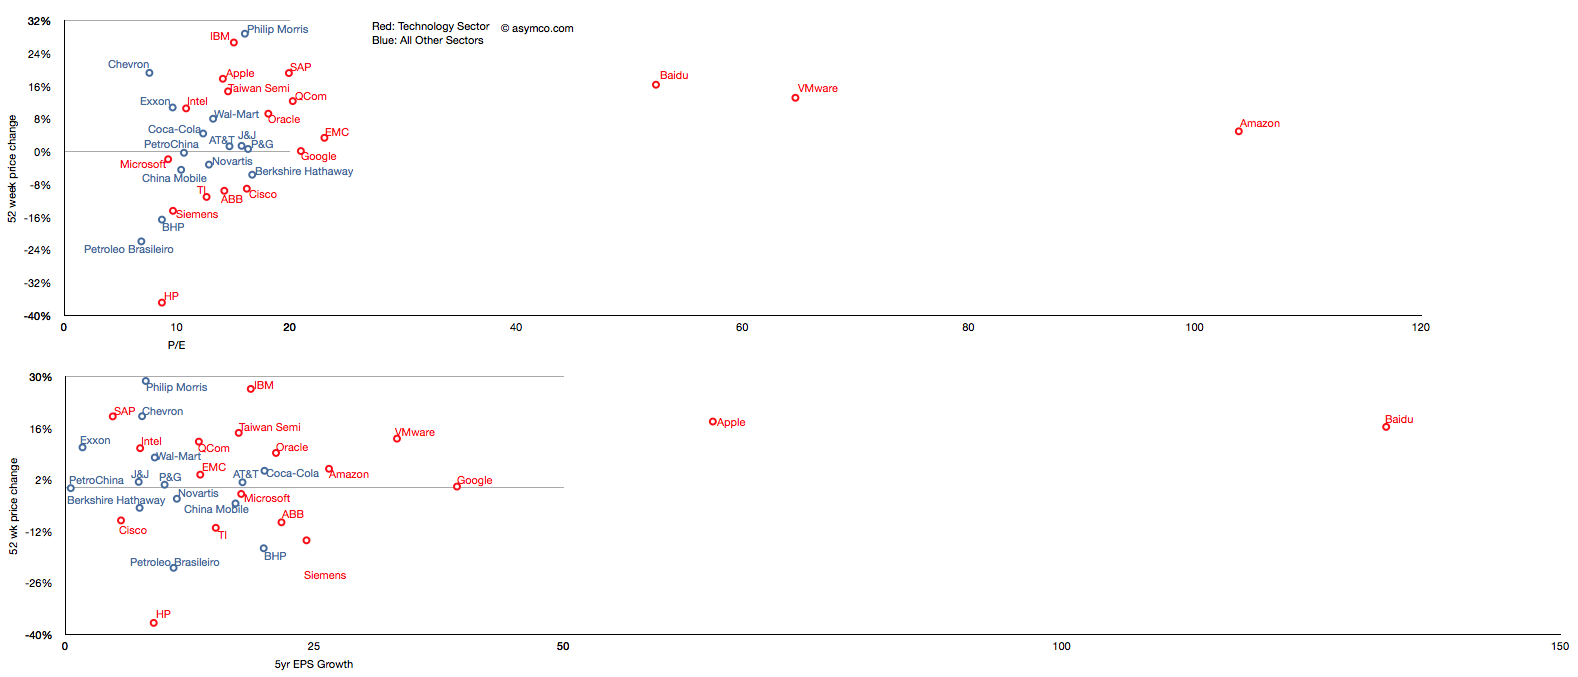
    I then plotted the P/E rate vs. 5 year Growth Rate for these companies, separating the tech sector by color (Red):

    The pattern is not encouraging. It appears that there is no correlation. Perhaps the technology companies are, as a group, further up and to the right, but overall they are equally unobservant of growth.

    For example, SAP has grown less than 5% in five years and yet enjoys a P/E of 20 whereas Microsoft has grown 18% and has a P/E of less than 10. The non-technology sector companies are similarly broken. Berkshire Hathaway, a conglomerate, is rewarded for slow growth and China Mobile is punished for relative high growth.

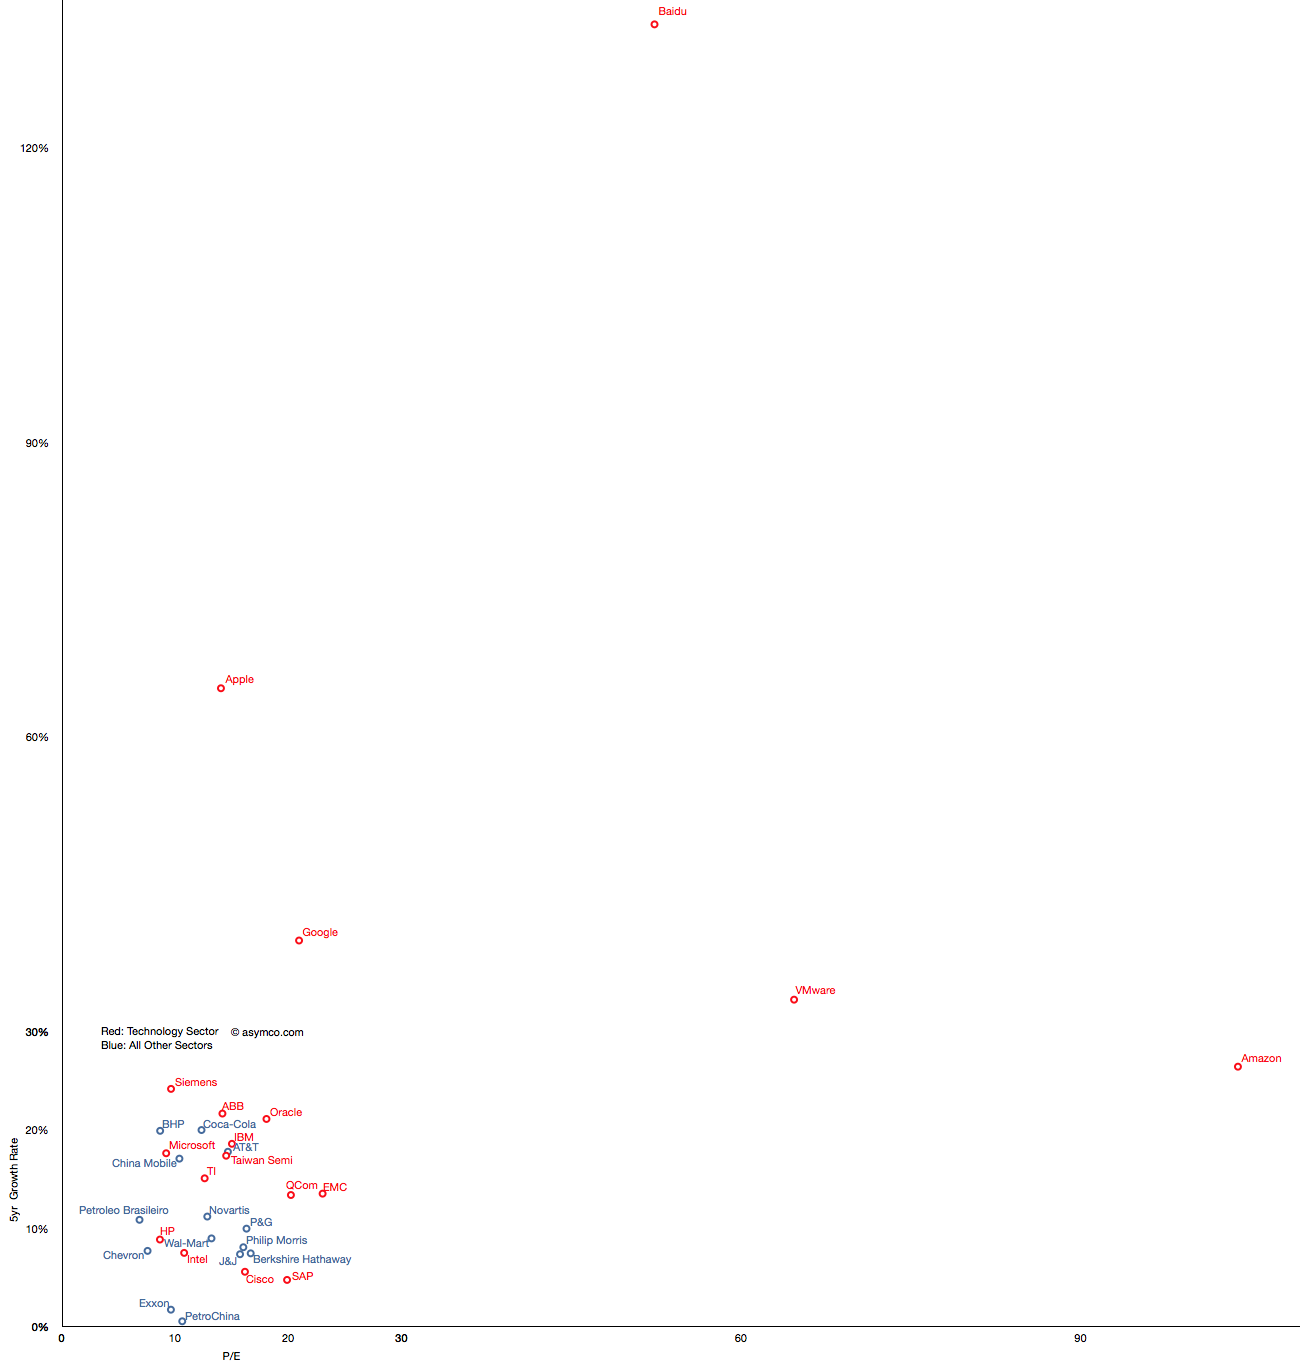
    But you'll notice that some companies are not on this chart. That's because they are outliers. Their growth or P/E are so far out of this cluster that the would make it impossible to discern individual performance. The complete "top 20" picture is shown in the following chart which will require either a large display or a lot of scrolling (1300x1364 pixels):

    With this level of detail, we can see how distinct some companies are. Not only from a correlation point of view but from a cluster of peers. The outliers are Amazon, Baidu, VMware, Google and Apple.

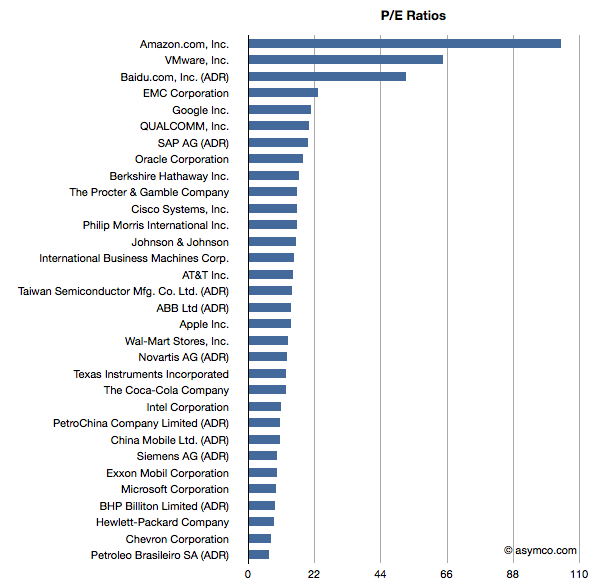
    These outliers can be seen also in ranking of P/E and Growth:

    Baidu has grown earnings by 132 percent while creating a market cap of $47 billion and has a P/E of 52. Amazon has grown by 26% while having a total value of $90 billion and a P/E of 104. VMware is "only" a $40 billion market cap company with a 5yr EPS growth of 33% and a P/E of 64. Finally, Google has returned a 39% growth rate, a market cap of about $200 billion and a P/E of 21 and Apple brings up the rear of P/E with 14 but with the second largest market cap of $360 billion and the second largest growth of 65%.

    What this analysis shows is that the market does not have any "rule" of rewarding growth with a high P/E. If anything, the outlier analysis shows that there are significant anomalous valuations that cannot be explained by growth data.

    ---

    Note: I've also tried to observe correlation between recent share price change and growth and recent price growth and long-term earnings growth.

    Similar anomalies and lack of correlation can be observed.

  7. The thermodynamics of Apple's share price

    Research · 82 comments

    Andy Zaky at Bullish Cross wrote a great post on Apple’s valuation, showing the deep discount of Apple's earnings vs. an average company. It essentially states that Apple's money is not green.

    Felix Salmon took it forward by enumerating a few explanations that might be used for the despondent valuation. None are successful arguments, but that should not be a surprise.

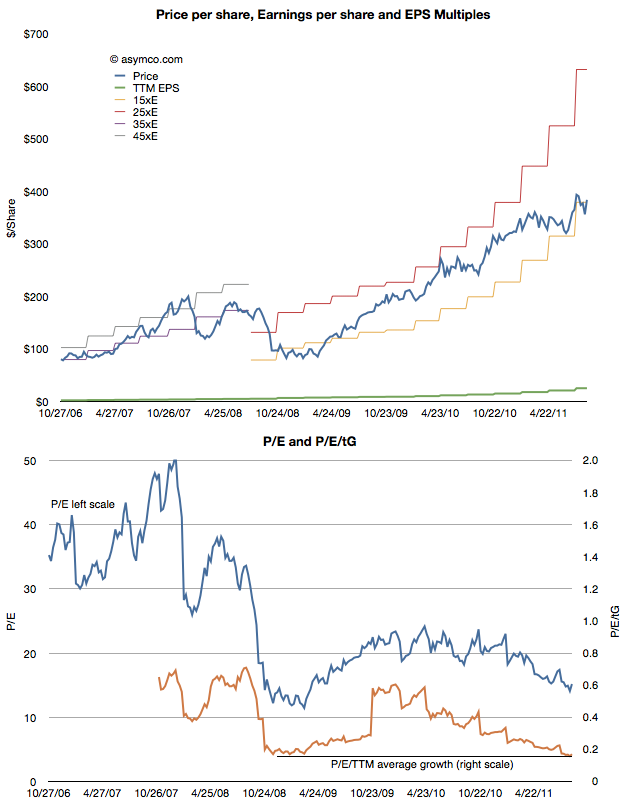
    To understand the phenomenon a bit more precisely, I maintain and think about these charts:

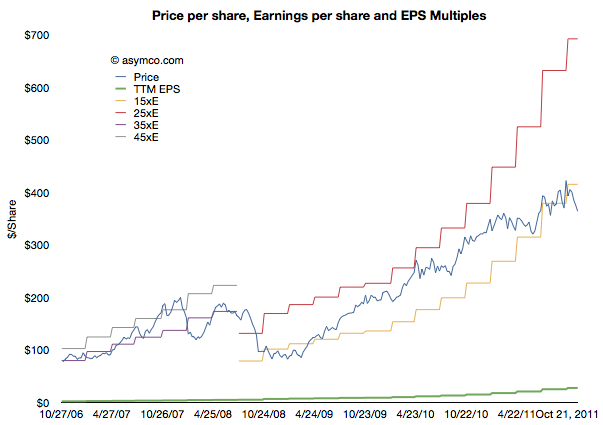
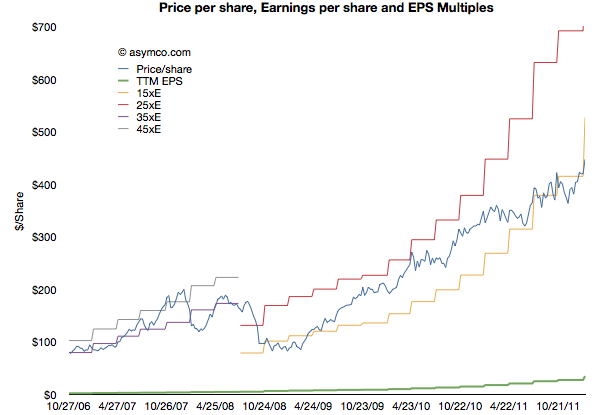
    This shows Apple's share price ("P" in blue) and its earnings per share ("E" in green). In addition there are multiples of the earnings in "bands". The first band is 35xE to 45xE which bounded the price during the period of 2006 through most of 2008. The second band is 15xE to 25xE which bounded the price since then. The data is updated weekly so it is current as of last Friday.

    Illustrating it this way shows how the stock is seen as representing different companies at different times. The 2006 era (iPod) Apple was seen as a high growth, dynamic company with loads of headroom for growth. The current (iOS) Apple is seen as a slow growth, fairly static company with most forecasts showing 20% growth potential.

    Note that the price has dropped outside the current band for the first time since the great recession. It is still below 15xE today. Perhaps a new band is forming.


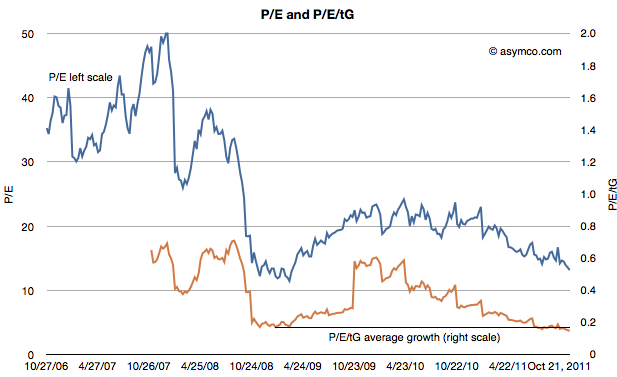
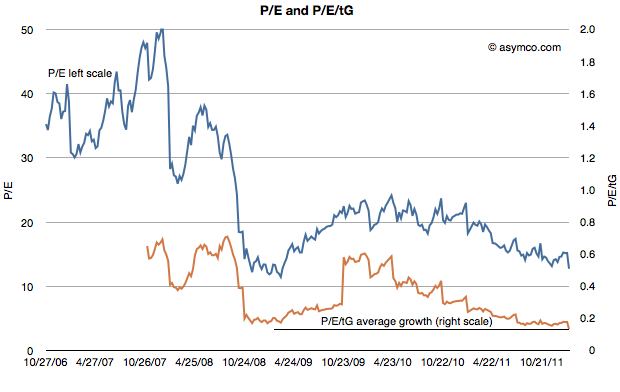
    The second chart shows the P/E on its own (in blue) but with a second measure where the P/E is divided further by the average trailing twelve months' growth (P/E/tG). This is a variation on the P/E/G (aka PEG ratio) where instead of (mostly wrongly) estimated future growth I use actual growth history--hence the t for trailing. The P/E/tG is a way to normalize P/E as a function of growth and hence a more appropriate index of value potential.

    I added a horizontal line to the chart to show the minimum value P/E/tG reached during the recession (0.17 in January 2009). As you can see, the P/E/tG is now lower than at that time (0.15). It implies a deeper discount for the company's earnings growth than during the time when the world faced economic contraction.[1]

    Note also the trend of that line as it shows a steady linear path toward zero.

    Of course, it cannot reach zero unless Apple files for bankruptcy. But until it does file, the line can only reach zero asymptotically as E/tG increases. Which is a relief, I suppose, as it means the rate at which P/E/tG drops will decrease. This implies that as earnings growth persists, the drop in price will have to moderate.

    The other threshold to keep an eye out for is when Apple's share price will reach its cash per share. That's the point when investors will consider the company to be a net value destroyer. If you performed that analysis in January 2009, and you were accurate about earnings forecasting, the answer would be well before today. See the following chart:

    In other words, in January 2009 the stock was trading at a price (<$80/share) below the current cash per share (>$85/share). It took Apple 18 months to grow its cash to reflect the price set on the company. Had the stock not risen then the company would today be trading below book value.

    The amazing thing is that today the valuation structure (P/E/tG) is even worse than in it was January 2009. An interesting exercise would be to project how long it would take for the cash to increase to the current share price.[2]

    I imagine this time interval should have a name. How about the time to boil: the time for growth pressure to become sufficiently high to exceed disbelief that growth can happen.

    ---

    Notes:

    1. Note that the low values were placed on the company after the crisis took hold, not as an anticipation of contraction. See the behavior of the index during the summer of 2008 as the credit crisis was unfolding.
    2. This analysis is consistent with the analysis that Apple is not valued on earnings or earnings growth but on its balance sheet. The ratio of Price/Cash has been fairly constant but if it breaks down (as it has been--see below) then we need to assume a new dynamic is in place. 
  8. Apple's Guidance Deficits

    Research · 94 comments

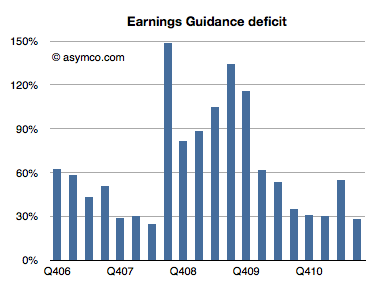
    Every quarter Apple's management issues a "guidance" or forecast of their own earnings in the following quarter. Over the years, this figure has been nearly useless because not only is it not accurate, the error itself has been wildly variable. I plotted what I call the Earnings Guidance Deficit for Apple based on the formula (Actual EPS diluted - Guidance)/Guidance.

    The higher the value in the bars above, the more the company underestimated (or under forecast) its performance. Note that during the recession the company routinely offered guidance at half the level they actually delivered. After the recession they returned to a more reasonable ~30% under-reporting.

    The problem with this analysis is that there is such a high volatility in this factor that we can't count on it to predict where earnings will fall. Even if we saw a range bounded at 30% to 60% the usefulness of this would be very low as that is far worse than the range that analysts can get through other means (Deagol's accounting of analyst error). The best thing we can say is that the range seems to be bounded by 30% and 150%.

    Rather than using this history for precision, perhaps it makes more sense to assume that the lower bound offers at least some limit to the possible value of next quarter's earnings. Maybe it can give us a "sanity check" for our own estimates.

    For the next quarter Apple guided $9.30 per share. If we assume a 27% "deficit" which is at the lower end of the range above then the earnings are likely to be about $11.8.

    That's equivalent to an 84% growth in earnings year/year. It would also imply $33 for the 2011 calendar year. At the current share price of $384 that implies a P/E of 11. That happens to also be the P/E for Apple at the trough of the recession in January 2009.

    In other words, if the stock price does not rise (or falls) from the current level by the time earnings are reported in late January, then the P/E for Apple may drop to less than 11 on growth of 83%. That's a sanity check all of its own.


  9. The growth surprise in Apple retail

    Research · 58 comments

    In Apple: For What It’s Worth Jeff Matthews asks a question "about the most disturbing pattern coming out of Apple’s earning release: the measly 1% year/year revenue increase at Apple’s retail stores".

    He notes that prior to the drop, Apple stores were growing at 36%. Such a huge drop quarter on quarter seems suspicious and he thinks something is happening.

    Something is happening.

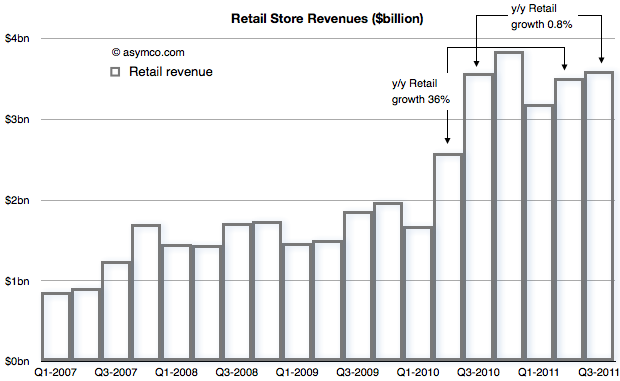
    To find out what, let's start with the revenue from Retail that Apple reports[1]


    The concern is with that low growth between calendar Q3 last year and this year. That is being contrasted with the growth in the previous quarter (Q2) of 36%.

    When seen as a chart, the explanation for a big change in growth is perhaps easier. The third quarter of last year was a boom for retail and the quarters that followed were more-or-less similar in sales level.

    With this perspective, it's clear that there was a surge in sales during the last year which did not repeat this year.

    But what's the cause for this pattern? If we know the cause can we predict if retail sales growth will increase or decrease?

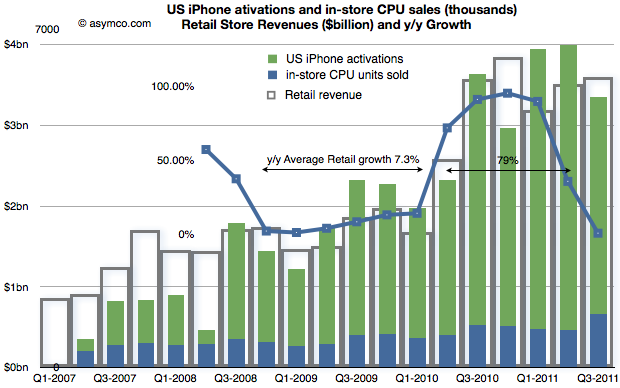
    Consider the following compound chart:

    The chart shows three different quantities.

    1. The original retail sales values in "hollow" bars
    2. The growth in those values year-on-year (in a line chart)
    3. A "proxy" candidate for retail growth explanation: the sum of US phone activations and in-store CPU units sold as a stacked bar chart.

    The choice of proxy includes the blue bars which Apple reports as in-store "CPU units" and the US phone activations[2] coming from AT&T and Verizon[3].

    We can see now that there is a strong relationship between iPhone sales growth and store sales growth. The Mac business is growing but not in the bursty way that iPhones are growing. The growth of US iPhones matches the growth in (US mostly) Apple retail. This should not be a surprise.

    The bursty nature of iPhone means that store growth varies just as dramatically. I highlighted that during the period of Q4 2008 to Q1 2010, Apple store revenue grew at an average of 7.3% but following the "big bang" of the iPhone 4 launch they grew at 79% over the subsequent five quarters (because the comps were easy).

    In the latest quarter the growth dropped as there was no launch of a new iPhone to top the big bang of a year earlier. Even so, store revenues actually increased by a slight amount.

    Knowing that the comp with the year before was so tough the surprise isn't that the growth slowed, it's that there was any growth at all.

    If iPhone as a cause for growth in retail is to be believed, then how hard can it be to forecast retail growth in the future?

    ---

    Notes:

    1. Apple does not submit this information to the SEC but reports it (exclusively I believe) during the earnings conference call. Transcripts are available on seekingalpha.com but fortunately they are recorded as well by Gary Allen at ifoapplestore.com.
    2. I used US data for the iPhone as most of Apple stores are in the US. The global pattern is similar.
    3. I had to estimate Verizon units used during the last quarter as they have not been reported yet. I used a similar ratio between AT&T and Verizon as for the last quarter.
  10. Quantifying the phobia of owning Apple shares

    Research · 51 comments

    As the market continues to exhibit signs of instability, an interesting paper[1] identified a correlation between the U.S. stock market and an index of the U.S. Financial Conditions. This index measures the assessment of the probability of a crisis.

    The conclusion is that an imminent crisis mentality pervades equities markets today and implies that pricing is largely disconnected from fundamentals. On this blog we've discussed the topic of fundamentals and marveled at how pricing seems to be largely exclusive of it.

    The case is made by the following chart:


    The first chart shows the share price (blue) and the earnings per share (EPS in green) as well as several multiples of EPS. During the period of 2006 through 2008 the stock ranged between a P/E of 35 and 45. beginning with the collapse in confidence due to the banking crisis, the share price fell to within a range of 15 and 25. Now, with Apple's growth accelerating above 100%, the stock price seems to be sliding below the 15 P/E bottom.

    In the second chart I show the P/E in blue and the P/E/trailing Growth. Adjusted for earnings growth the equity is cheaper now than at the bottom of the last recession. You can also observe the trend or slope of the decline in the P/E/tG. It might be alarming to see the decline but it also might be comforting to know that the P/E/tG cannot go to zero. Either Price has to go to zero or earnings or growth have to go to infinity. The closer P/E/tG goes to zero however (it's at 0.17) the more undervalued Apple appears to be.

    Naturally these metrics of P/E are arbitrary and the price is simply what the buyers are willing to pay for the equity. But the value of any metric is the trend. The value can be compared to a different time or to a different equity. The trend here is that Apple, at least, is being discounted at a time when it's growing more robustly than ever.

    Which is why finding an explanation is so important. This is where the paper sheds some potential clues. The author concludes that there is a pervasive crisis phobia which affects multiples. Paulsen writes:

    If cultural mentalities were less crisis-phobic today, what would the PE multiple be on the stock market coming off a 12.8 percent profit quarter with a 2.2 percent Treasury yield and only about a 1.6 percent core consumer price inflation rate? Certainly, much higher than 12 times earnings! 16 times earnings? 17 times? This simply illustrates just how much the crisis-centric mindset is depressing investment potential and it also suggest how much opportunity there is to increase stock valuations just by improving the cultural mindset. Long term, the real investment opportunity is not a dramatic improvement in economic or profit growth (although either or both could occur), but rather is just a slow but steady decay in “crisis-fears” similar to what we experienced during the last recovery.

    ----

    Reference:

    1. A Crisis Phobic Investment Culture, James W. Paulsen, Ph.D. Wells Capital Management.
  11. Estimates for Apple's fourth fiscal quarter: Entering the post-P/E era

    Research · 92 comments

    I'm late with posting my estimates for Apple's current (fourth fiscal) quarter. Normally I post my estimates a few days after the previous quarter's earnings are announced. This quarter however there was a lot to think about.

    As pointed out in my analysis of the previous quarter, the iPhone sold at a far faster rate than I thought. I had expected it would be a "lame duck" in the quarter but the expanding distribution allowed it to continue at a triple-digit growth rate (142% in fact, the highest quarterly growth rate since 2009).

    So the question for this quarter is, as always, what's the iPhone growth? The problem for me is that I have to choose between two assumptions:

    1. Due to distribution and dual product strategy (n-1 variant) production has now become more consistent.
    2. This quarter is the actual transition quarter when iPhone 4 production is throttled down in favor of the new model.

    The first assumption would put the iPhone growth at 100%+ while the second would place it in the 60% to 80% range. I decided to dial in a figure somewhere in between at 90% but I'm not very confident in this until we see more evidence that a new pattern has emerged.

    So here are my "mid" quarter forecasts:

    • iPhone units: 26.8 million (90%)
    • Macs: 4.8 million (23%)
    • iPads: 10.5 million (150%)
    • iPods: 7.0 million (-22%)
    • Music (incl. app) rev. growth: 30%
    • Peripherals rev. growth: 23%
    • Software rev. growth: 32%
    • Total revenues: $33.2 billion (growth: 63%)
    • GM: 41.8%
    • EPS: $9.05 (95%)

    Three years ago the company's share price was trading at a P/E ratio of about 35. The above estimate and today's price implies that's it's trading at the same multiple but the Earnings is measured over one quarter not one year.

    As @Patricklgoe noted on Twitter: the post-PC era for Apple means it's the post-P/E era as well.