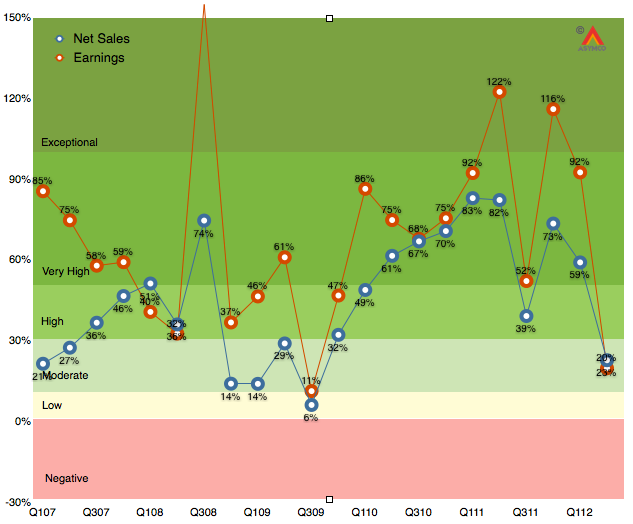
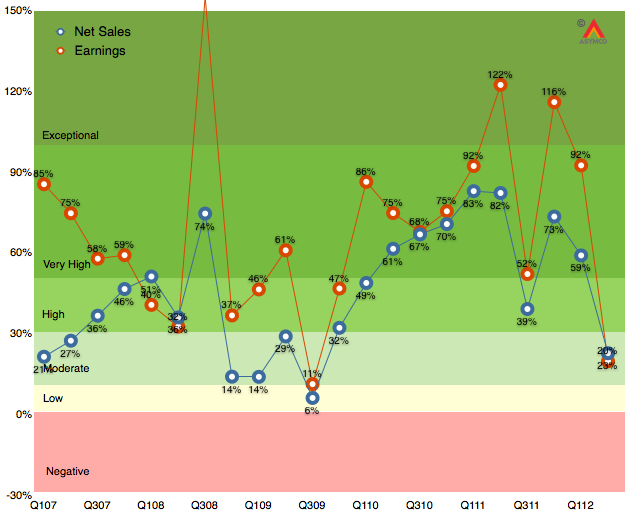
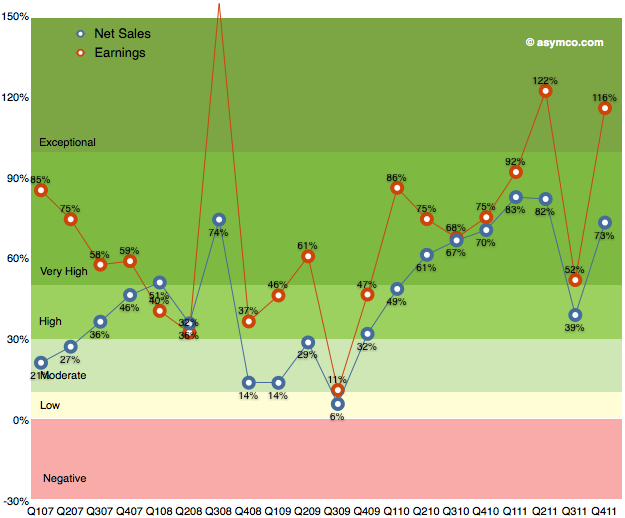
As the chart below shows, the last quarter (second calendar 2012, third fiscal 2012) was disappointingly moderate with 20% earnings growth and 23% net sales growth.
It was the first quarter since the iPhone launched that earnings growth has fallen into moderate (below 30%) territory. Much of that disappointment (to me) was the relatively low performance of the iPad following a launch quarter. The iPhone was weak as well, though that was expected. As I said last quarter, the iPhone is still the most important component but the iPad is becoming increasingly decisive in overall performance. In fact, I’m projecting that the iPad will have the same revenues as the iPhone had one year earlier.
The iPhone is going to be extremely difficult to project. On one hand we have the launch of the i5 which will account for about 10 million units in the quarter, on the other, chances are that sales were very weak prior to the launch as purchases were being deferred even more than during the last quarter.
So with these very meager clues, here are my estimates for the quarter (with y/y growth in parentheses):
iPhone units: 27.8 million (62%)
Macs: 5.6 million (15%)
iPads: 18.8 million (69%)
iPods: 5.6 million (-15%)
Music (incl. app) rev. growth: 40%
Peripherals rev. growth: 10%
Software rev. growth: 15%
Total revenues: $39.5 billion (40%)
GM: 42%
EPS: $9.75 (38%)
This earnings value would imply a trailing twelve months’ EPS of about $45.2. At the current price of $697/share the P/E would be 15.4. Cash and equivalents will probably increase to $125 billion or $131/share. Excluding cash, the P/E would be 12.5.
[Update. The EPS figure above includes a tax rate estimate of 30%. Company guidance was 25.5%. Using the company's guidance yields an EPS of 10.43. TTM EPS becomes $45.9/share and at $697 the PE is 15.2. At time of this update the share price has fallen to $665 and thus the pro-forma trailing P/E ratio is 14.5).]
As the following revenue growth table shows, the second calendar quarter of 2012 was not like the recent past.
The bottom line growth (earnings) is the slowest since Q309 which had a difficult comparison with Q308 when the iPhone 3G launched and saw 800% iPhone growth. This past quarter also had a difficult comparison with 150% iPhone growth a year earlier and 122% earnings growth.
This is shown in a different way in the following graph:
Growth is sometimes victim to difficult comparisons and sometimes the launch of products comes late or early in a particular cycle. This quarter was a mix of multiple factors that went the wrong way:
iPhone did not get expanded distribution and was stale late in its cycle. Emerging market traction outside of China still elusive.
iPad is not getting volume purchasing from institutions and spring is not an ideal launch quarter for consumers
Mac portables missed a few weeks of sales due to lack of Intel components
Some signs of macroeconomic slowing especially in Europe and countries dependent on commodities exports.
The silver lining is the return of higher growth to iTunes store and peripherals. These are "hobbies" for Apple but they might form a foundation for significant new opportunities in the years to come.
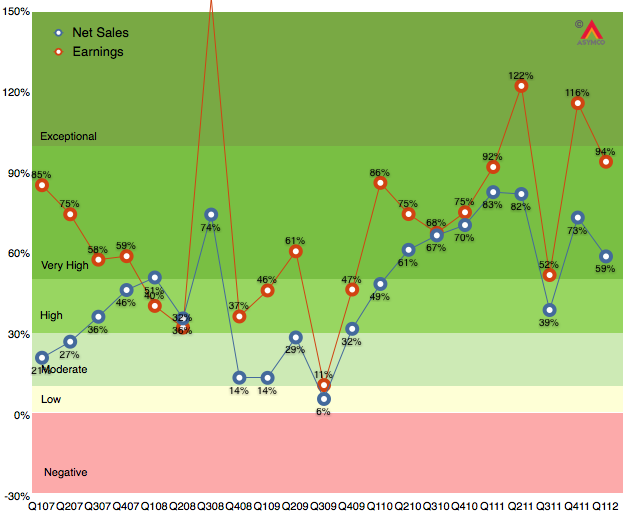
As the chart below shows, the last quarter (first calendar 2012, second fiscal 2012) was robust with 94% earnings growth and 59% net sales growth. Subject to the usual superlatives, the performance was, again, unexpected by many.
Much of that surprise was due to the underestimation of iPhone sales in China during what is a holiday quarter in that nation. Growth this quarter will be more difficult to estimate. The iPhone is still the most important component but the iPad is becoming increasingly decisive in overall performance. In fact, I'm projecting that the iPad will have the equivalent of 73% of the iPhone revenues this quarter.
In this quarter the iPhone is reaching a late stage in its launch cycle but it continues to reach more points of purchase through distribution agreements and it also has a "portfolio" in terms of multiple price points and models available.
The iPad was supply constrained last quarter and may be in balance this quarter. Management has very clearly and repeatedly signaled that the iPad will have a very strong quarter.
So with these clues, here are my estimates for the quarter (with y/y growth in parentheses):
iPhone units: 28.5 million (40%)
Macs: 4.5 million (15%)
iPads: 24 million (160%)
iPods: 6 million (-20%)
Music (incl. app) rev. growth: 35%
Peripherals rev. growth: 20%
Software rev. growth: 15%
Total revenues: $41.9 billion (46%)
GM: 44.8%
EPS: $11.54 (48%)
This earnings value would imply a trailing twelve months’ EPS of about $44.8. At the current price of $571/share the P/E would be 12.7[1]. Cash and equivalents will probably increase to $118 billion.
---
Apple's P/E also dropped to 12.7 around Christmas 2008. I did a search for some headlines to recall that time and came across one that seems appropriate: "Unrest Caused By Bad Economy May Require [domestic] Military Action, Says US Report".
Yesterday I presented the estimated Android income statement vis-à-vis Apple's income statement. In this post I'll compare Android as a part of Google's overall business.
Recall that Google has already been compared in terms of overall revenue, growth and profitability to Apple and Microsoft here. The argument can be made that mobility has not yet had a measurable impact on Google (certainly not noteworthy enough to be reported by management).
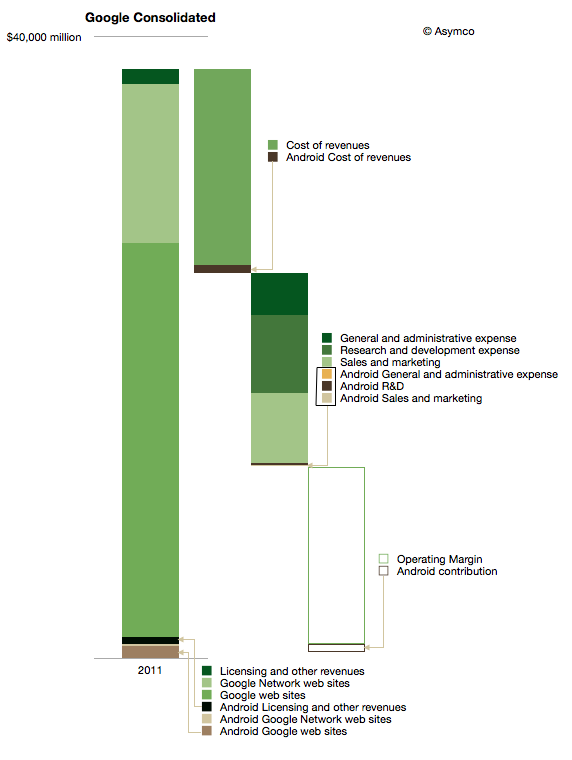
The impact on Google of Android can be shown in the following diagram:
I used color coding to identify non-Android (Green) and Android (Brown) segments of the business. Overall, Android could amount to about 3.5% of total Google revenues and about 5% of operating earnings.
It's important to note that this is not all the revenue that Google obtains from mobility. This diagram represents Android only and there are revenues also coming from alternative platforms and operator deals.
iOS contributes between 3 and 5 times more ad revenue to Google than Android.[1] The contribution to earnings is even more difficult to assess. We don't know the terms between Google and Apple for search revenue sharing and placement. One analyst suggests that the cost of sales (TAC) for mobile Safari search could be as high as 60%, far above what Android traffic costs.
The other observation is that Android cost structure is quite small (see third bar from the left above.) My estimate is that Android R&D is only about 3% of total Google R&D. I'm projecting $200 million for 2012. That implies between 700 and 900 headcount. It's interesting to compare that total to the 20,000 or more that came with the Motorola acquisition.
Having these estimates allows one to calculate many ratios and potential valuations. I'll refrain from putting a value on Android using multiples or sales or earnings, but would come out well below what was paid for Motorola's $12.5 billion.
Which again compels one to ask what is the strategy at work here.
---
Notes:
There are various reports of the ratio including congressional testimony and reports to courts. BlackBerry, Docomo and KDDI were listed as significant other sources of ad revenue by Google in 2010.
This is a continuation of the "Android Economics" series of posts. It deals with how revenues and costs are categorized for Android.
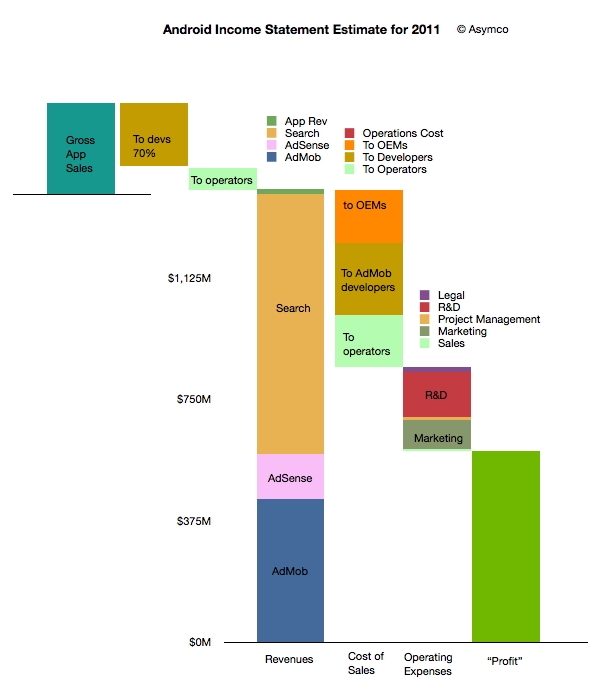
The following diagram shows an approximate representation of what Android's "Income Statement"[1] would look like.
I'll discuss the assumptions that are built into the model as I go along. I'll begin at the upper left and move toward the lower right in the discussion.
The first thing to note is that sales from Google's (formerly known as Android Marketplace) Play are not registered as revenues. This is because Google, like Apple, treats itself as an agent. Agency means that the revenues don't "belong" to the agent but get passed on through to the primary beneficiaries. In the case of Play, Google passes 70% to developers (or content owners) and then distributes on average 25% to network operators (or carriers).
I emphasize on average because there are many cases where Play transactions are not handled by or don't pass through operator billing systems. In those cases where operators are involved, it's possible that they capture more than 25%. It's not uncommon for operator billing to capture 45% of a transaction's value. The reason for this is that there is significant collection risk on billing--far more risk than on credit cards. It would also imply that on some transactions Google may be paying out more than it receives.
This means that on average about 5% of Play content sales to be booked as revenues for Android.
This 5% ends up a quite a small amount if overall app sales are small. We don't know the exact amount but anecdotal evidence from developers seems to indicate that they receive far more revenues from ad sales than from direct app income. Hence the size of the Android app sales is overall, modest. My estimate is that in 2011 there were about $330 million in gross app sales through the Android market. (Google estimated its sales to be 76 million for 2010 half way through that year.)
The bulk of revenues are therefore from other sources: Search, AdSense and AdMob. I'm modeling that overall revenues are based on a "revenue per device in use" multiplied by the number of devices in use. Google has publicly stated that they are targeting $10/device/yr. in revenues. This is probably ambitious as the amount was nearly that much in early 2010 but the number of devices bought by emerging market consumers exploded. As they are not actively targeted by Google's primary customers (especially in China), the average revenue per phone is likely to be much lower. I estimated $6.5 on average for 2011.
However, even if we use $6.5 per phone per year, the total revenues are quite strong since there were likely more than 215 million users at year end[2]. That results in a total revenue base of $1.4 billion for 2011. Removing the app revenues results in about $1.38 billion from Search and AdSense and AdMob.
How to allocate revenues to these three businesses is mostly guesswork. I used a split of about one third to AdMob, 10% to AdSense and the rest to Search. If we assume this split then the next step is to consider how to allocate costs to these sources of revenue.
As discussed in the introduction to this series, the primary costs of sales for Search and AdSense are network operators and OEMs or phone vendors. They are the primary "channel" which ensure the flow of search terms to Google. As Google also explains, the channel receives revenue share--so-called traffic acquisition costs (TAC).
I used an overall allocation of 39% for TAC. Crucially, this includes the payments to developers for AdMob traffic. The rule of thumb I used was:
Network operators get 20% of Search
Developers get 50% of AdMob
OEMs get the rest (of the TAC)
The resulting split is shown in the column above with the "Cost of Sales" at the bottom. There are also additional operations costs which are negligible.
After this 39% TAC (revenue sharing), Google needs to pay its operating expenses. This includes R&D, Marketing, Sales and Legal costs for the Android division (including AdMob). You can see the approximate values in the column labeled "Operating Expenses". This operating cost amounts to about 27% of sales, with R&D at 14% and Marketing at 9%. These rather high fixed costs make sense as there is a significant development work underway for Android.
Finally, after these costs are allocated, the remainder is the contribution of the division. This comes to about 34% of revenues which is called the operating margin. Google has to attach depreciation from data centers and other costs as well as taxes before placing this into earnings.
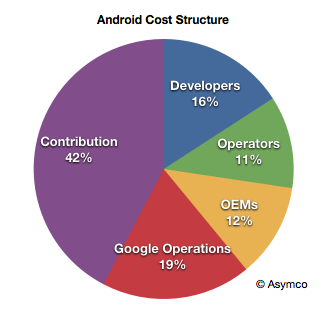
Considering the agency structure, the overall cost structure of Android looks like this:
When playing with the assumptions, it becomes clear that the model is most sensitive to the revenue per device and total devices in use. The profitability is entirely dependent on those figures as variable costs are a percent of sales and fixed costs are limited by talent constraints.
For example, if revenues per device drop to $4.5/yr then the operating margin drops to 38%.
Now we can calculate some of the more interesting figures. For example:
Android OEMs receive $0.76 on average per device per year
Android Operators receive $1.07 on average per device per year (including Play)
Android Developers, as a group, receive $1.94 per device per year (including Play and AdMob)
Google receives a contribution of $2.75 per device per year from Android
Again, these figures are very sensitive to the revenue per device (currently assumed to be $6.5).
Because of the number of devices involved, these cash flows are an important part of the value network of mobile computing. The next step will be to assess how they affect the incentives, alignments and competitive stance of various platforms vying for a seat at the table of the future of information.
--
Notes:
An income statement shows the sources of revenues and the costs associated with those revenues. It also shows the fixed costs (or costs which are independent of revenues so they don't go up or down if revenues change). Finally it shows the operating income which is called contribution if it's a division within a company. This contribution is still subject to taxes and depreciation before it's recorded as earnings.
I'm using Android installed base estimated based on daily activation rates as published by Google. I've discussed these estimates here. I'm using year-end estimates but subtracting retirements based on a two year device life.
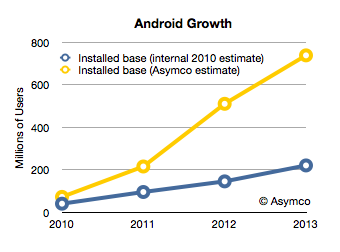
Android has had unprecedented growth. Based on activation announcements, it's possible to estimate that thus far, about 370 million Android devices have been activated. The total number of devices in use is a lower figure which depends on replacement rate and retirement rate. This total number of devices in use at year end is estimated in the following chart.
I added the blue line which represents what Google had as an internal estimate in mid-2010.[1] The difference between the two lines shows that Android's growth is far higher than what the company expected. If the company itself did not expect this growth, it's unlikely anybody else did either.
Unexpected, exponential user growth is usually accompanied by a dramatic positive improvement in the finances of a company and a higher return to shareholders. The curious aspect of Android's success is that it has not had an impact on either. The market has not "discounted" the half-billion anticipated Android users into a price for Google shares that reflects this growth. It can only imply that those users are not very valuable.
But why would there be such a disconnect between the number of users and their value?
In order to answer this question we have to come to grips with what I call "Android economics". We need to understand how Google uses Android to make money and whether it is succeeding and if it's not, why not.
In many ways, the Android business model is straight forward. It's an extension of the existing Google business model: Revenue is obtained from Search, AdSense and the applications that enable these two. In the case of Android there is also revenue from app sales (Google Play a.k.a. Android Market) and from AdMob. Of course, all these revenue sources (except for Play) are sold through other mobile channels that include alternative, competing platforms. They are present on iOS, Symbian, BlackBerry and even embedded OS phones ranged directly by carriers. For each of these alternatives, Google pays for placement of their search as the default search in the browser.
To Google, total search revenue from iOS is far higher than it is from Android. That's because iOS users engage more with their devices and there are not yet a large multiple of installed Android users vs. iOS users.
But it would make sense that having your own platform would be more economical because there would be none of these placement fees. In this sense Android is another "channel" for distribution of Search and AdSense. But one which may be a lot cheaper.
However, it turns out that it does not work that way. Android has other costs.
In fact, Android's distribution costs might be higher than other channels. What we have to understand is that all of Google's channel revenues have a "cost". The revenue from a particular distributor of search results that Google generates is offset by the cost to acquire the terms. You can think of it as Google paying for the queries through a revenue sharing agreement. Google does not get search terms directly and depends on distribution. Overall, it pays about 50% of revenues back to distributors. In the case of its own web sites the rate might be lower, perhaps 40%.
Google even has a term for it: Traffic Acquisition Costs or TAC.
This revenue sharing in exchange for search terms extends to Android. Google pays about 40% TAC to Android distributors of those searches. But since Android is owned by Google, who does Google need to pay for traffic? Who is an Android distributor? Who gets the revenue share?
Google does not make a secret of it: network carriers and device vendors (OEMs) receive revenue share. From the latest earnings conference call:
Yes. I mean, again, I'm not going to talk about specific of the TAC on mobile. But as you know, we get people using our devices both organically as well as through our distribution partnerships with carriers and OEMs. And typically, the OEMs and carriers participate in some of the economics that are on the Android marketplace or Google Play and some of them participate in the economics around Google Search just the way we would do syndication on the Web platform, which you do with many partners around the world. We have similar deals on the mobile front.
Arora made another point in the quote above. Not only is there revenue sharing with carriers and OEMs for Search and AdSearch but also for Google Play (app and content sales.)
Device vendors and carriers get a cut. Google's model has always been one of giving a cut of revenue to their upstream distribution. It just might be surprising to hear that device vendors like Samsung and carriers get a piece of Search and apps.
This basic observation leads to a series of questions:
How much is paid out and to whom?
Is that revenue sharing sustaining the ecosystem? Do vendors create Android devices and do carriers push Android to consumers because they get this revenue share or is the amount insignificant vs. device margin? What about tablets? Why haven't Android tablets they taken off as Android phones have? Are the economics to blame?
Is this a competitive advantage vs. other platforms? Does Windows Phone compete with revenue share for Bing? Is Microsoft offering a bigger carrot (as well as a stick?)
How does this economic picture show up in Google's financial and stock price performance? Or, more precisely, why doesn't it?
And, finally, what conditions create a virtuous cycle of growth and what conditions could turn it into a vicious cycle of decline? Is there a lurking factor which would cause Google to benefit greatly from this user base or is there an inherent point of failure in the model?
I'll be answering these questions in a series of posts this week.
--
Notes:
Google's internal documents were leaked as part of the Oracle trial (Exhibit 1061). They can be found by using Google search with the following search term: "OC quarterly review".
Apple's share price has increased rapidly in the last few weeks. The rise to $600 was swift and broke the pattern of slow growth the the stock was able to obtain over the past few years. The level, however, shouldn't have been a complete surprise.
I think Apple is going to $600...It's really not that complicated. Apple has a number of key drivers in its business model which have yet to be properly priced into the stock because I think it's very cheap at this level.
-Stephen Coleman, chief investment officer at Daedalus Capital
This prediction was made October 26, 2007. On that date Apple's share price closed at $184.7. It may have seemed like a bold bet, but as Coleman noted, the reason why it would reach $600 was easy to spot.
The real story on how I get to that valuation doesn't even involve the sale of (the Leopard operating system) or the growth in the Mac business. How I get there is through the iPhone itself.
What was not easy to tell was when it would reach $600. Back in October 2007 the stock had a P/E ratio of 48. It's PEG(trailing) was 0.65, and cash per share was $17. Sales were $6.6 billion for the quarter and earnings were 98c/share. If an analyst were to take those ratios and apply a forecast of sales five years hence, the $600 price would have been reached much sooner: Sales had tripled by 2010 and earnings had tripled by 2009. In contrast, the stock took until 2012 to triple.
The delay of one or two years is perhaps reflecting the risk involved in investing. Namely, you can predict outcomes but not their timing.
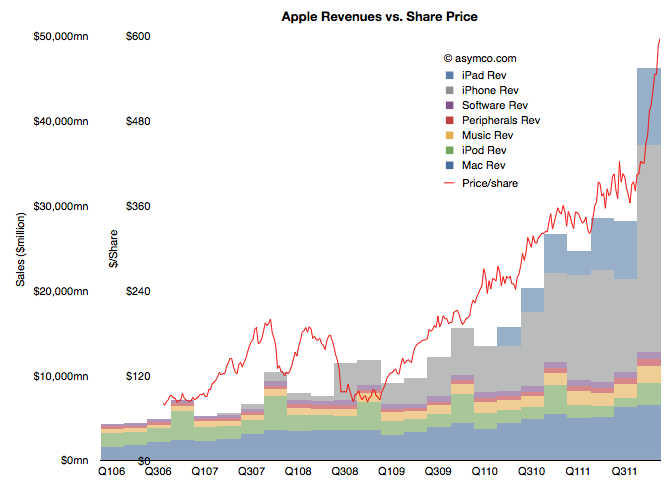
But still, we have to return to the question of why the stock has rallied in the past few weeks. There has been no new information about the company since it reported earnings and any product launches (e.g. new iPad) or increased distribution (China) are completely predictable. Curiously, the market did not react until late in the quarter. The following chart shows the phenomenon.
(Note the two scales on the left: inner is share price, outer is net sales)
It shows the share price as a line superimposed on the sales chart with stacked product revenues. The recent rise can be attributed to the rise in revenues/earnings from the fourth quarter. But why would a stock react in March to data from six months earlier (and published two months earlier).
Classical market theory suggests that markets anticipate and "discount" the future. Efficient markets supposedly react to all available information and do so instantly. If that was the case, the chart above would show the red line shifted significantly to the left.
What we are observing is market inefficiency.
Inefficiency implies that perception of reality is not the same as reality. It happens when people are reluctant to believe the truth. It's also implies that with $15 billion being "bet" on the share price every day, each one of those bets is misinformed!
The cause of this divergence between reality and perception is that disruptions are divergent from perceptions. A disruptive company always "leads" its valuation. There is cognitive delay for the vast bulk of observers. You can then argue that for those, like Mr. Coleman, that don't suffer this delay, there will be profit.
As the chart below shows, the last quarter (fourth calendar 2011, first fiscal 2012) was robust with 116% earnings growth and 73% net sales growth. I've heard many superlatives used to describe it. It is certainly exceptional but it was not as good as the second calendar quarter of 2011.
Sales grew faster both in CQ1 and CQ2 of 2011 and earnings grew faster in CQ2. It was in many ways a return to normality due to the iPhone returning to 133% revenue growth after the lull of the transitional third quarter.
Now it's time to consider the current quarter. It's already quite late in the quarter to make predictions, but I waited to hear some data about the iPad. The iPad remains a difficult product to forecast. Mainly because it is a new category and the pattern of growth takes a long time to establish. We've only had three quarters where y/y growth could be measured. Sales growth has been 180%, 146% and 99%. Unit growth has been 183%, 166% and 110%.
These rates have been higher than the average iPhone growth rates (average of which was 100% in units and 108% in revenues over the calendar 2011). Indeed, the average iPad growth rate so far seems to be 150%.
Is it sustainable?
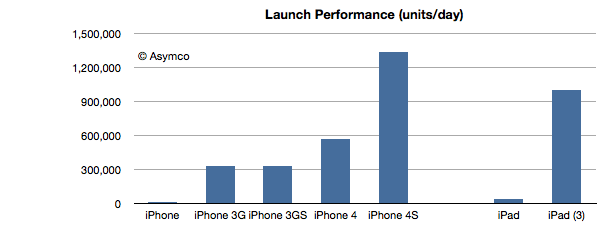
The answer from this latest launch seems to be yes. The following chart shows the launch performance of the various iOS devices whose launch performance has been announced.
The growth in launch performance between iPad 1 and iPad 3 is a factor of 28. iPad third generation had broader distribution but the volume boost from first generation is enormous. This implies a vastly improved production ramp. As the product remains supply constrained, the most important indicator of performance is production throughput.
So given this data on the iPad and the ongoing broadening of the iPhone distribution network, here are my first quarter estimates (with y/y growth in parentheses):
iPhone units: 37.3 million (100%)
Macs: 4.7 million (25%)
iPads: 12.2 million (160%)
iPods: 7 million (-22%)
Music (incl. app) rev. growth: 40%
Peripherals rev. growth: 25%
Software rev. growth: 10%
Total revenues: $42.7 billion (growth: 73%)
GM: 44.7%
EPS: $12.0 (88%)
This earnings value would imply a trailing twelve months’ EPS of about $40.7. At $600/share the P/E would be 14.7. Cash and equivalents will probably increase to $108 billion.
Today Apple announced both a dividend and a share re-purchase plan which, when combined, will consume 45% of Apple's current US cash reserves.
The dividend will be $2.65/share/quarter and the buyback will cost $10 billion over three years. The dividend will therefore cost about $2.5 billion per quarter (starting next quarter) and the re-purchase will cost about $833 million per quarter (starting next fiscal year).
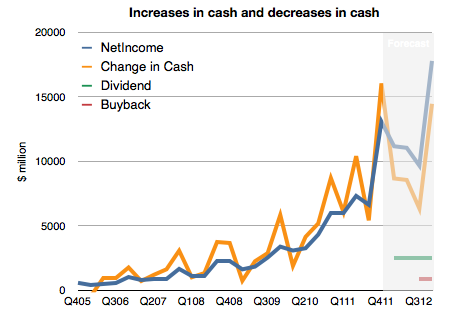
However, note that Apple's cash has been growing far more quickly. It increased by $16 billion last quarter or $37 billion over the last year. This rate of increase is itself increasing.
To illustrate, I prepared the following chart. It shows historic net income, change in cash and a forecast of the costs of the new uses of cash and future net income (based on my estimates).
I made an assumption that future cash growth will equal net earnings minus costs for the new dividend and share re-purchase. What we should see is that the previously tight coupling between increase in cash and earnings will remain but that there will be a negative offset by $3.333 billion each quarter. In other words, cash will increase but at a slower rate.
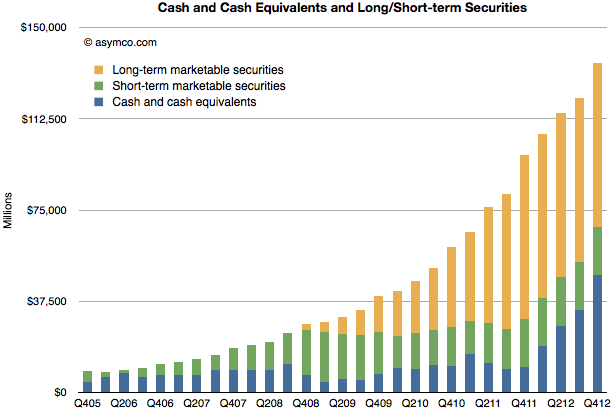
This means Apple's total cash should still grow by more than $35 billion this year.
That would result in the following, more subdued, total cash trajectory (for simplicity, I assumed all added cash would be in cash and cash equivalent accounts)
An iPhone generates approximately $650 in revenue for Apple. This figure has remained fairly steady over time. Using deduction from overall margins, it's possible to estimate the gross margin on the product to be around 55%.
That means that the cost of goods sold (COGS) for the iPhone is about $293. Is that a lot? Where does that money go? What else does it tell us about how the company operates?
To find out we need to understand the cost structure of phone building.
Typically there are four main categories of costs for a phone:
Bill of materials (BOM). This represents the cost of the components that go into the device. These are paid to suppliers.
Transportation/warehousing. This is the cost to transport and store the product before sale. This is paid to shipping companies and warehousing.
Manufacturing cost (including labor). This is paid to contract manufacturers.
Warranty expense. This is paid back to customers for returned product that can no longer be sold.
We can estimate a device's BOM through a teardown analysis and there are firms that do this. Usually this offers enough competitive insight into the cost structure and hence gross margin because the other items are predictable in that they do not vary greatly from product to product.
In the case of the iPhone the BOM has been fairly steady around $200 for a new model. That leaves quite a big gap to the overall COGS of $293.
Could transportation, manufacturing and warranty costs really add up to $90 for an iPhone?
The manufacturing costs are not usually discussed in detail openly because the processes used are secret. However, thanks to and ABC Nightline report, some clues have emerged about how iPhones are built and, although incomplete, they offer some interesting bounds.
One data point recently published is that the iPhone takes 24 hours to be built. Of that 6 to 8 hours is spent in "burn-in" to install and test the software and components automatically. This leaves about 17 hours unaccounted for in the throughput time. Could this time be spent in labor intensive operations? In the ABC report the wage of workers on the line is given as $1.78/hr[4]. 17 hours of labor input would imply $30 labor cost per iPhone. That seems a lot higher than the industry (i.e. iSupply's estimate is $8 for manufacturing cost.) This is an upper bound. Obviously, those 17 hours could be spent in automated operations which were not shown or simply sitting idle, waiting for a process to begin.
Is there another way we can check this?
There is. The ABC report also mentioned that there were 141 (presumably labor) work steps in the production for an iPhone. If we knew the time each step took we could obtain another estimate. For example, if each step in the human assembly process took 3 minutes[2] then human hands will touch the iPhone for 423 minutes or about 7 hours. This would imply a labor cost for an iPhone of about $12.5. If each step was longer or shorter, the cost would vary accordingly.
Unfortunately we can't be sure of the exact cost. However, these recent clues offer some interesting bounds and observations[3]:
Manufacturing costs for the iPhone are likely to be much higher than comparable devices. This is partly because of the design of the product and partly because of the quality testing needed.
Those costs are likely to range between $12.5 and $30 per unit.
The iPhone manufacturing costs are likely to be twice or three times the average.
Labor costs are still a small part of the overall cost structure at between 2% and 5% of sales price.
The high level (141 steps) of human interaction in the process could be automated however, the fact that it isn't implies that the cost of automation would be higher and the flexibility of the automated process would be lower. It's much more likely that the process is a mixture of labor and robot intensive sub-processes.
Even if we assume a $30 manufacturing cost, there is still $60 that needs to be allocated to transportation and warranty expense. These require sanity checks as well.
---
Notes:
Note that R&D (engineering and development) and Sales, General and Administrative (e.g. Marketing) costs are not part of this cost structure. They are considered fixed costs and are not allocated to individual units of production.
Note that during the ABC video there was mention of automated instructions being broadcast to the line. This implies that each worker is working on a "clock cycle" and each work stage is timed to take an equal amount of time. This clock cycle time is crucial in understanding the cost structure. One further clue to this cycle time comes from the iPad output rate per worker. This was mentioned in the slide show to be up to 6,000 units per day. Assuming 10 hours of working time per day means 600 units per hour or 10 per minute. This seems extremely high as the worker would have to handle the product for only six seconds. [UPDATE: Apple clarified this point: "In manufacturing parlance this is called deburring. Her line processes 3,000 units per shift, with two shifts per day for a total of 6,000. A single operator at Ms. Zhou’s station would deburr 3,000 iPads in a shift"]
As this post shows the amount of information that can be obtained from observing operations can be significant and lead to competitor advantage. It should be clear why this is not something done willingly.
UPDATE: In a statement Foxconn clarified wages as "We have over 75 percent of the employees in the category of earning at least 2,200 RMB ($349/month) basic compensation standard. That means they are earning 13.75 RMB ($2.18) per hour".
It's perhaps fitting that an industry that produces illusions is in itself an illusion. The absence of public scrutiny of its finances and business model leads to a lot of myths or misconceptions. Some of these are discussed anecdotally in books and other works[1], but the absence of data makes the anecdotal evidence unsatisfying to an analyst.
What if we could find patterns in data about the industry to confirm or deny these oral histories? Fortunately some data actually exists. There are collections of data about movies released and some of the attributes of these releases such as box office receipts, theaters opening, budgets (sparsely), and distributors. This data is typically used for marketing purposes to celebrate the "hits" and thus entice more people to see the movies.
However, other information can also be obtained through analysis of the data. In fact, a rather compelling story can be told. That's the purpose of this post. Our story will be expanded over time but this first draft should be enough to allow a discussion to begin. The story is built in four sub-stories:
Drama / Comedy vs. Adventure / Fantasy: Why the Ancient Greeks had it all wrong.
The magic of summertime: Market access and school schedules
The perpetual incumbency: What happens to Hollywood startups
The Popcorn economy: The peculiar power of theaters in an age of television
These stories were the result of observations in data alone. We have no first-hand knowledge of the industry and have only used basic software tools to seek out patterns in public data[1].
The data set includes approximately 12,000 titles released between 1975 and present with various degree of completeness. Some of these years are not completely populated and some data is undoubtedly in error. However the large sample should offer enough substance for patterns to emerge in spite of this.
Drama / Comedy vs. Adventure / Fantasy: Why the Ancient Greeks had it all wrong
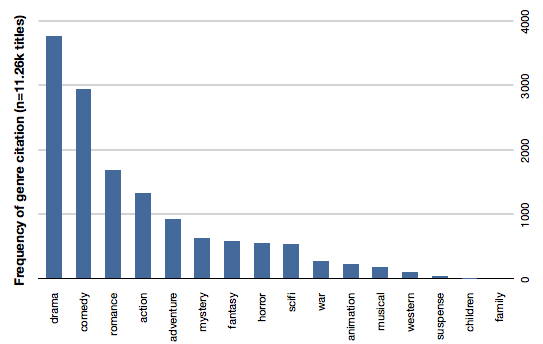
Storytelling has not changed throughout history. The same types of stories affect audiences the same way since stories were first told. The earliest known "genres" were tragedy and comedy and they are still seen as the bedrock of theater today. The same is true for movies. The following bar chart shows the distribution of genres as cited by movies over our data set.
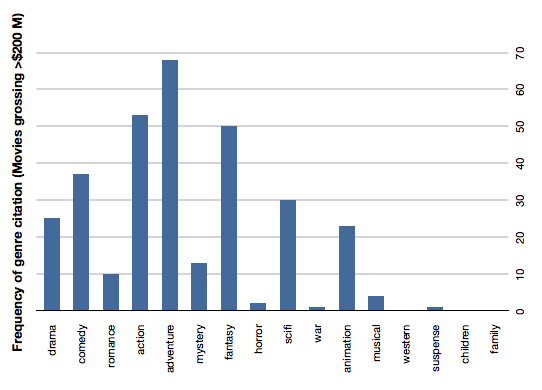
Drama and comedy are about 50% of all movies made. If we add romance they are 60% of cited genres. This is understandable given the history of theater. However the profitability (or revenue potential) of those genres is not as strong as Action, Adventure and Fantasy. The following chart shows the same count of genre citation but only for movies grossing over $200 million (which we chose to call "blockbusters").
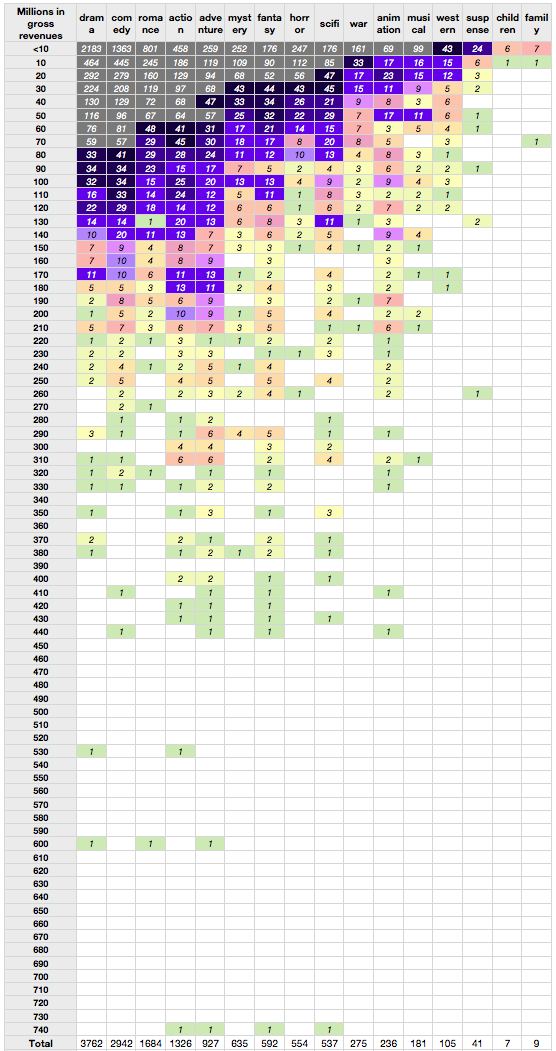
Action, adventure and fantasy handily beat Comedy and even SciFi beats drama. Romance, musicals and and mystery genres typically associated with female audiences are very rarely successful as blockbusters. The overall data is shown in the following table. The rows represent gross revenues and the columns genres cited ranked in order of frequency. One can easily observe the density of low earning drama and comedy (grey colored) vs. the more lucrative instances of fantasy and adventure. These male-dominated genres have consistent success into middle, high and very high revenue tiers.
The reason for this blockbuster attention to action and adventure is probably the prevailing theater-going audience demographic: adolescent males. The industry still produces the classic genres but less profitably than what the current targeted markets.
Indeed, these genres were very uncommon in eras predating the late 1970s. More "adult-oriented" movies like romance (Gone with the Wind), musicals (The Sound of Music) and epic movies (Ben Hur, The Ten Comandments) were common in the "golden age" of Hollywood. As we'll see in the next section, the age of the audience is a now driving more than just genre selection.
The magic of summertime: Market access and school schedules
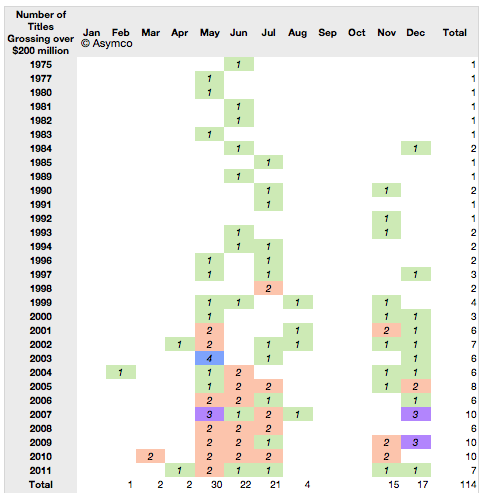
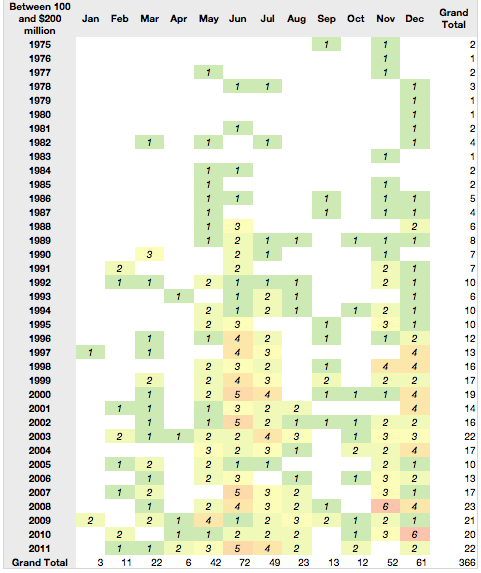
Using the word "Summer" before "Blockbuster" has become almost redundant. What is less understood is that watching movies in the summer is rather a new idea. It started effectively with Jaws in 1975 and ever since major film studios have planned their annual marketing around a summer schedule. There is clear evidence for this in the data. Here is a table showing the blockbuster release months since 1975. (The number of titles grossing over $200 million and the months in which they were released).
The same pattern repeats for the next tier of highly successful movies--those grossing between $100 and $200 million.
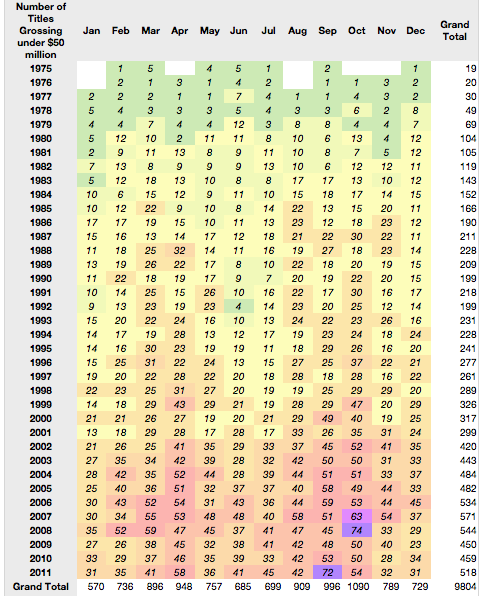
But what about the less successful movies? Those earning less than $50 million actually show a counter-success pattern.
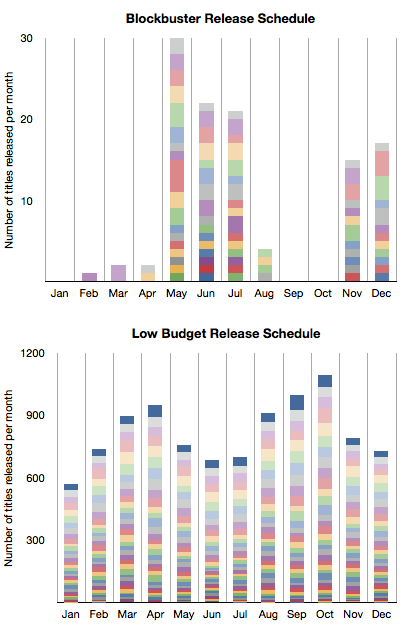
To contrast this further, here is a stacked bar chart comparison between frequency of release by month for the most successful tier vs. the least successful tier (colors represent years with oldest at the bottom).
It would seem that summer and success are in a causal relationship. There is a clear pattern with the only non-summer months having blockbuster releases being November and December.
But there is more to this pattern.
The blockbuster schedule happens to coincide with the school holiday schedule in the US. This again points to the "profitable" audience being school-age children, and mostly male.
The perpetual incumbency: Where are the Hollywood startups?
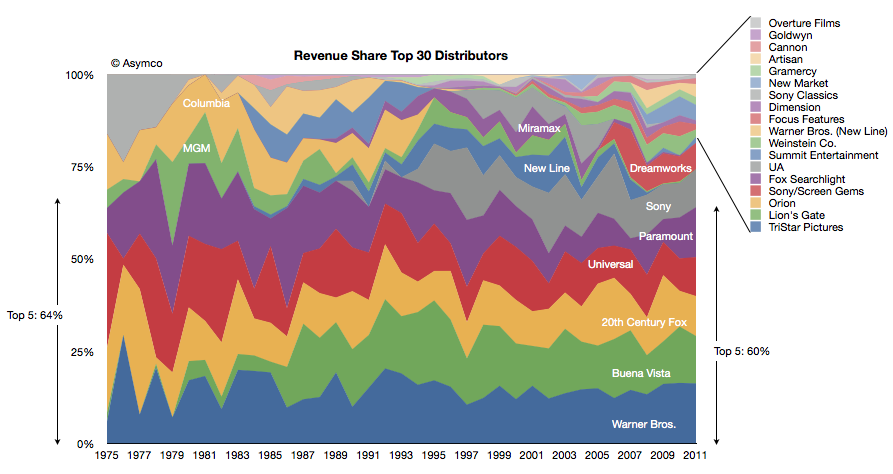
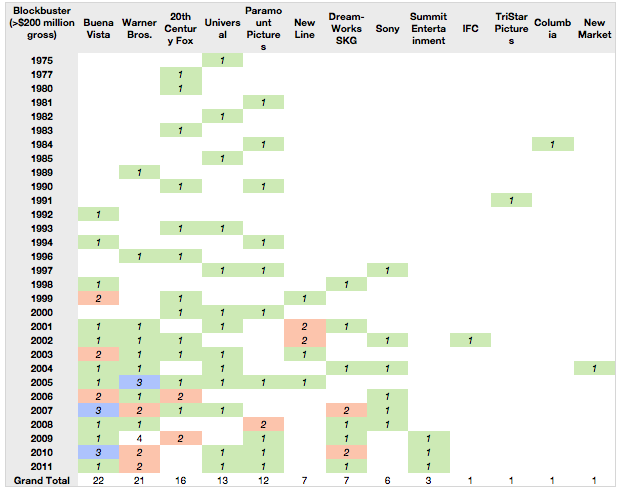
The third observation has to do with the major film studios. We took the box office revenues and allocated them to the studios over time. The following chart shows the share of those revenues for the top 30 studios.
The top five were earning 64% of revenues in 1975 and the top five were earning 60% in 2011. One of the top five from 1975 is no longer in the running this year (MGM) and one new major was added (Buena Vista, owned by Disney).
There has been one other notable change: Columbia was acquired by Sony but stayed out of the top 5. Beside Disney there is one new significant entrant in Dreamworks gaining share in the last decade.
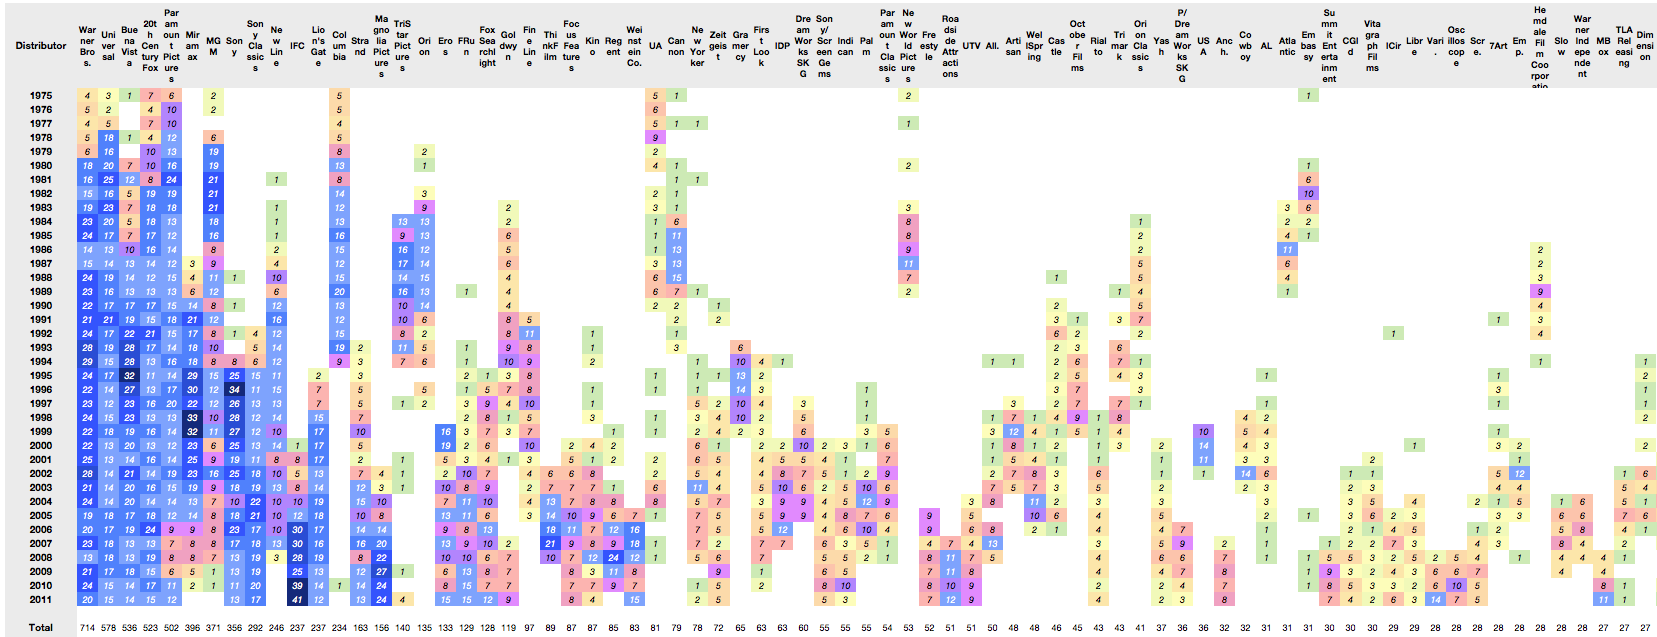
But the prevailing impression from the data is that the incumbents remained as such during the last four decades. There are many small studios but they have not "disrupted" the market by shifting significant revenues out of the hands of the majors. Indeed the typical strategy seems to be to start a studio with the hope of it being acquired by a major.
Even the entrants are industry insiders: Disney and Dreamworks are not asymmetric in their business models in any way. In fact, when viewing the data by blockbuster creation, the majors feature prominently. There are only a handful of blockbusters from the smaller companies.
When looking at overall production rates, again the majors (and their subsidiaries) dominate. Here are the top 75 distributors of movies showing nearly 9000 movies (click image for full-size):
The conclusion from this data might be that Hollywood does not change all that much in terms of who makes the money. But that itself is a symptom of a deeper reality: that there is little that changes at all.
We can even perhaps hypothesize that there is no business model innovation taking place. Any such innovation is usually manifested in a reversal of fortunes for incumbents.
But technological change is happening. The following section describes how this appears in the data.
The Popcorn economy: The peculiar power of theaters in an age of television
The data we are sampling (box office gross revenues) is actually a small and shrinking subset of what movies generate. In addition, there are international revenues, media sales (DVD, video tape), TV rights, and merchandise to name a few. But theaters are still an important part of the picture.
Although they make up less than 20% of gross, their importance is disproportionate due to the signal they send other markets about the popularity of a movie. In other words, a movie must first be proven in a US theater before its value is priced by the other channels.
However, this essential theatrical release has changed in one fundamental way. Releases are now geared for larger initial scopes with shorter runs and less dependency on "word of mouth" to increase sales.
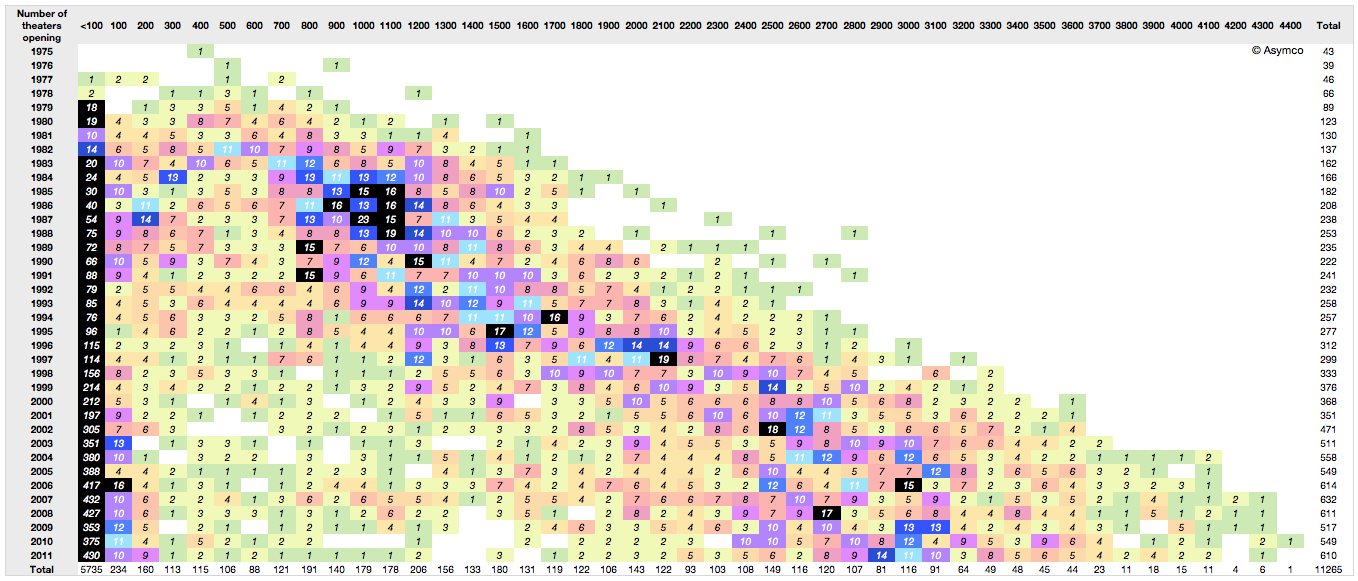
Consider the following view of release breadth (how many theaters are in an opening) by openings over time. The columns represent the number of theaters used in the opening of a movie in increments of 100. The rows are years. The cells contain the number of movies opening with that size footprint.
The pattern shows the number of theaters used in openings increasing steadily. the mean number of releases is shifting to the right. Part of the reason is that theaters shrank in size over time, but there is also the factor of needing to create a large audience at the outset of a release. The increase in "footprint" at launch (a factor of 10) is in excess of the slicing of theater sizes (a factor of two)
This broadening of launch is coincident with a decrease in viewers. As a result the notion of how movies are marketed has changed. The idea that a movie could start small and gain a following gradually through word of mouth is obsolete. That low cost approach to marketing (called "earned media exposure" in marketing) is unreliable and completely discounted.
Instead, studios manufacture an audience through paid advertising and promotion. This initial burst of viewers is essential not just for generating revenues. It's essential to driving long-term revenues.
The reason is that technology now allows the movie to be "monetized" through multiple channels. Recorded media, broadcast rights and even in-flight entertainment are all there to milk a franchise. But there is a need to get that initial vote of confidence from one crucial audience. That happens to come only from theatrical release.
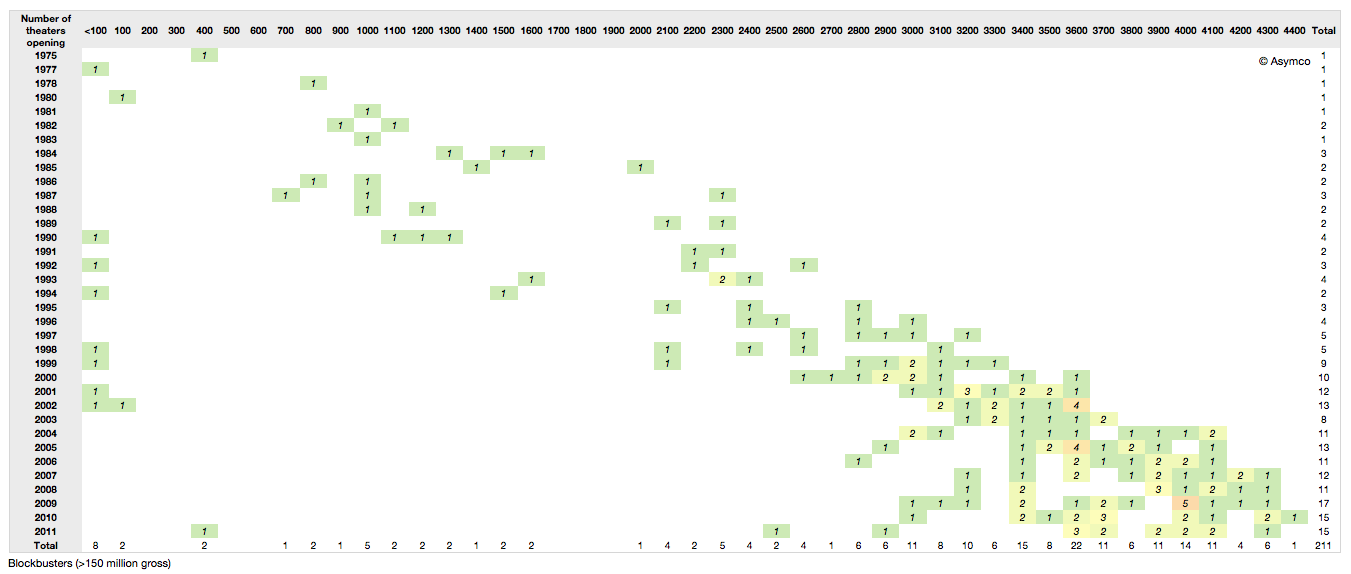
So with the scheduling pressures, the narrow window of purchased release buzz, the onus is on a broad release as quickly as possible. This holds especially true if we filter out only the blockbusters. Note how the release has increased steadily as well and that since 2000 all blockbusters released to over 3000 theaters. Compare that to Star Wars in 1977 releasing to only 30 theaters.
Data sources: Coolector, Imdb, BoxOfficeMojo, The-numbers.com
Many thanks to David McCandless and the Information is Beautiful folks (http://www.informationisbeautiful.net) for setting up the Hollywood Budgets Award that provided us with much motivation for researching this topic.