Asymco

Asymmetric Intelligence

EPS

  1. Predictions for 2012

    Research · 54 comments

    I have none to offer.

    It may sound strange to hear me say that I don't make predictions even though I often talk about how things will change and even provide some forecasts. The difference is one of degrees. A prediction to me is a very specific, time-sensitive and materially valuable recommendation. An observation about the future is an imprecise, intuitive hunch based on pattern recognition. It's mushy. It's theoretical. It's the difference between saying a company is great and recommending to buy its stock with a price target in a time frame.

    But it gets even weirder.

    One of the recurring themes in Apple analysis has been that independent analysts, as a group, have been, on average, more accurate in quarterly forecasting than highly paid Wall Street Analysts. Many have asked why.  I believe that the answer is because independent analysts are theorists who make observations while professionals are data gatherers who make predictions.

    First, we should understand the reasons why each group does what it does.  Wall Street sell side analysts are rewarded for making Buy/Sell recommendations that cause clients to retain the services of the firm they work for. They are not paid to be accurate with specific forecasts in fundamentals. They are paid to predict how stocks move. The objective is not to be accurate in the quarterly but to support the "call" or prediction. The disconnect from accuracy comes in trying to sustain the call with a "conservative" forecast.

    For example,  an analyst with a "Buy" recommendation (and a prediction in the form of a price target) thinks Apple could ship 30 million iPhones this quarter and generate EPS of $10. But he also thinks the stock looks cheap even if they only ship 28 million iPhones and report EPS of $8.50. In this scenario he's incentivized to publish the lower (less accurate) number. That way he supports his prediction. By dampening expectations, the stock rises on the "surprise".

    Because an analyst sells predictions, he self-censors what he believes.

    Contrast that with the motivation of an independent analyst (aka blogger). His motivation is to (presumably) gain a reputation of accuracy and insight. He sells his reputation as a keen observer. Precise predictions or recommendations can turn out wrong quite often. Getting caught with these errors exposes the independent to instant negative feedback. The risk is far greater than the  opportunity.

    So here is the difference: Analysts have an incentive to put forth a version of the future that supports their call on the stock. Bloggers have an incentive to put forth the most accurate version of the future. By taking the prediction out of the picture, accuracy in describing the future improves.

    So I don't have any predictions or recommendations. I just hope to help you see patterns that lead you to making your own predictions.
  2. Estimates for Apple's first fiscal 2012 quarter

    Research · 60 comments

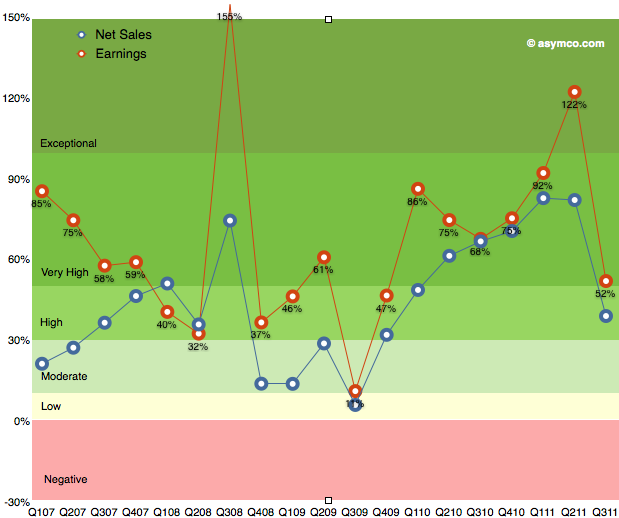
    As the chart below shows, the last quarter (third calendar, fourth fiscal 2011) was slow with only 52% earnings growth. The discussion centered on the (surprisingly) disruptive effect of the iPhone transition. Surprising since most analysts, myself included, were lulled into thinking that the portfolio of iPhones and their wider distribution would create a smoother sales pattern vis-a-vis the more cyclical pattern seen in the first three years of production.

    The second quarter was surprisingly strong and the third was surprisingly weak. So how do we estimate the fourth?

    We have the pent-up demand for the new iPhone, we have the dynamics of holiday spending and we have a question mark on pattern of growth for the iPad. I'll discuss each assumption in turn:

    The first assumption remains that iPhone growth is approximately 100% for the full year. Last calendar year there were 47.5 million iPhones sold. A 100% growth would imply about 95 million for this year. So far 56 million were sold. To reach a doubling then 39 million would need to ship in Q4.

    Another approach is to look at quarterly growth rates. Thus far, we've had 113%, 142% and 21% for the first three quarters. To reach an average of 100% for the year then the fourth quarter would need about 120% or 36 million units.

    36 to 39 million would be a good bounding range if there were no other mitigating factors. The information published so far shows no particular problems with either production or access to markets so I'm going to go with 35.7 million.

    The second major assumption relates to the iPad. The iPad has been a challenge to predict since launch. Not only is it a new category but it comes with a different launch cycle than the iPhone and has significant constraints on production. There have been only two quarters where we could measure y/y growth: 182.8% in Q2 and 165.6% in Q3. I was initially tempted to dial in 150% for Q4 but the question of transition comes up. The first iPad model grew well into the holiday quarter but dropped dramatically into the first as it went through the transition to the iPad 2.

    Are we going to see the transition effect earlier this year? I'm being cautious and suggesting only 100% iPad growth or 14.6 million units this quarter. This is still a very challenging product to forecast.

    So here are my fourth calendar quarter forecasts (with y/y growth in parentheses):

    • iPhone units: 35.7 million (120%)
    • Macs: 5.2 million (27%)
    • iPads: 14.7 million (100%)
    • iPods: 13.6 million (-30%)
    • Music (incl. app) rev. growth: 22%
    • Peripherals rev. growth: 25%
    • Software rev. growth: 25%
    • Total revenues: $44.6 billion (growth: 67%)
    • GM: 42.0%
    • EPS: $12.3 (91%)

    This earnings value would imply a trailing twelve months' EPS of about 33.5. At $390/share the P/E would be 11.6. Cash and equivalents may increase to $90 billion.

  3. Quantifying the phobia of owning Apple shares

    Research · 51 comments

    As the market continues to exhibit signs of instability, an interesting paper[1] identified a correlation between the U.S. stock market and an index of the U.S. Financial Conditions. This index measures the assessment of the probability of a crisis.

    The conclusion is that an imminent crisis mentality pervades equities markets today and implies that pricing is largely disconnected from fundamentals. On this blog we've discussed the topic of fundamentals and marveled at how pricing seems to be largely exclusive of it.

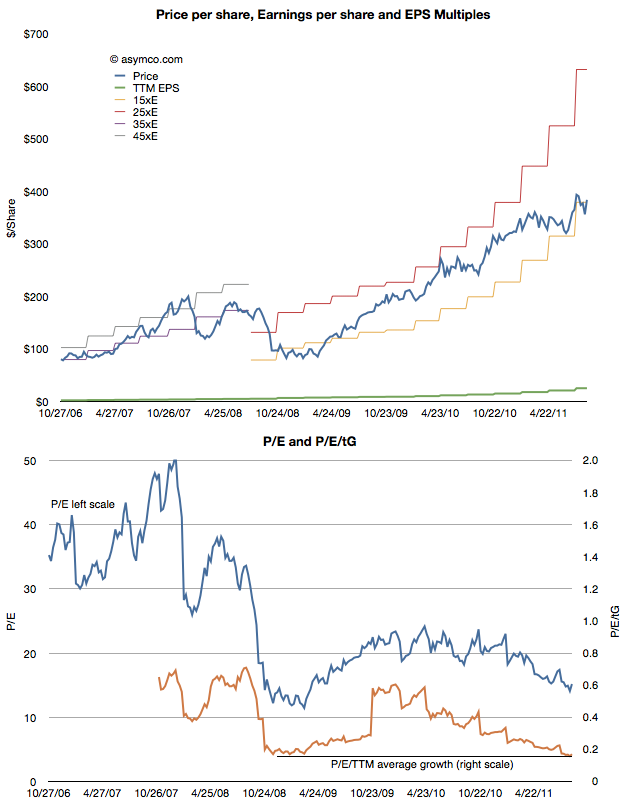
    The case is made by the following chart:


    The first chart shows the share price (blue) and the earnings per share (EPS in green) as well as several multiples of EPS. During the period of 2006 through 2008 the stock ranged between a P/E of 35 and 45. beginning with the collapse in confidence due to the banking crisis, the share price fell to within a range of 15 and 25. Now, with Apple's growth accelerating above 100%, the stock price seems to be sliding below the 15 P/E bottom.

    In the second chart I show the P/E in blue and the P/E/trailing Growth. Adjusted for earnings growth the equity is cheaper now than at the bottom of the last recession. You can also observe the trend or slope of the decline in the P/E/tG. It might be alarming to see the decline but it also might be comforting to know that the P/E/tG cannot go to zero. Either Price has to go to zero or earnings or growth have to go to infinity. The closer P/E/tG goes to zero however (it's at 0.17) the more undervalued Apple appears to be.

    Naturally these metrics of P/E are arbitrary and the price is simply what the buyers are willing to pay for the equity. But the value of any metric is the trend. The value can be compared to a different time or to a different equity. The trend here is that Apple, at least, is being discounted at a time when it's growing more robustly than ever.

    Which is why finding an explanation is so important. This is where the paper sheds some potential clues. The author concludes that there is a pervasive crisis phobia which affects multiples. Paulsen writes:

    If cultural mentalities were less crisis-phobic today, what would the PE multiple be on the stock market coming off a 12.8 percent profit quarter with a 2.2 percent Treasury yield and only about a 1.6 percent core consumer price inflation rate? Certainly, much higher than 12 times earnings! 16 times earnings? 17 times? This simply illustrates just how much the crisis-centric mindset is depressing investment potential and it also suggest how much opportunity there is to increase stock valuations just by improving the cultural mindset. Long term, the real investment opportunity is not a dramatic improvement in economic or profit growth (although either or both could occur), but rather is just a slow but steady decay in “crisis-fears” similar to what we experienced during the last recovery.

    ----

    Reference:

    1. A Crisis Phobic Investment Culture, James W. Paulsen, Ph.D. Wells Capital Management.
  4. The market values Apple's balance sheet, not its income statement

    Research · 79 comments

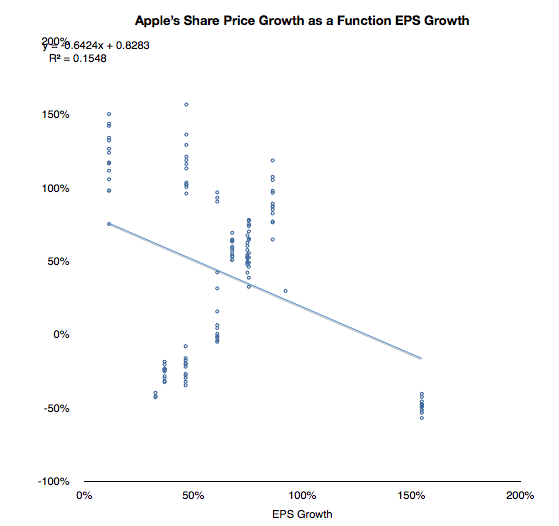
    As I have tediously repeated in this blog, Apple's share price has been de-coupled from its earnings for many years. Consistent earnings growth above 70% is not seen as valuable. As the chart below shows, there is no correlation between EPS growth and value growth.

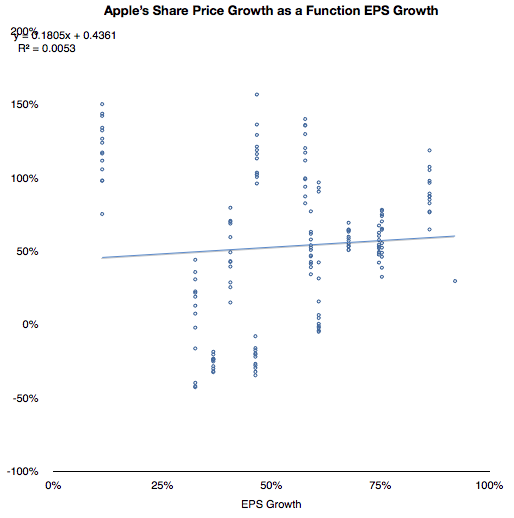
    With the outlying quarter when 154% growth was matched by a negative 50% price change, the correlation does not look much better:

    If we cannot correlate share price with growth then what is being valued? This has been a vexing problem because growth is the traditional, and logical, metric of valuation. Share prices, by definition (net present value of future cash flows) reflect future potential. That potential is more sensitive to growth than to anything else.

    But I've been leaving one factor out of the share price definition. Share price is NPV of future cash flows plus current assets.

    Since future cash flows are being thrown out of the equation, the company must be valued as a multiple of its cash. Does this relationship hold true?

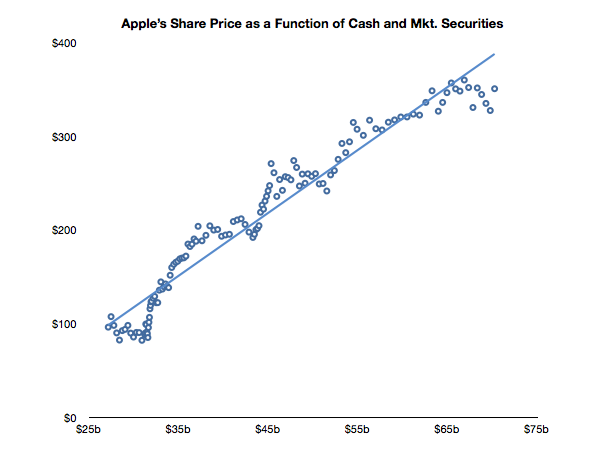
    In the chart below I show the weekly closing price of the shares and the corresponding value of the interpolated cash (and marketable securities) per share over the last two and a half years.

    A strong correlation can be observed. The R squared value is a healthy 0.94. Of course this is not to imply causation. Correlation is not causation, but it is a hint.

    Can predicting the cash per share be a strong indicator of future stock price? Perhaps. As long as this relationship holds, then having a reliable earnings model would still give us a solid predictor for the share price. Not because we can use EPS forward estimates multiplied by P/E but because we can estimate cash flows and the increase in retained earnings.

    Of course, the market "is being irrational" because it values on the basis of the present only (not its future.) But who are we to argue? This valuation has held since October 2008.

    As far as the market is concerned Apple's future is irrelevant. Its value is defined as a constant multiple of cash.

  5. Estimates for Apple's third fiscal quarter (ending June)

    Research · 42 comments

    Apple's CFO guidance statement:

    We expect revenue to be about $23 billion compared to $15.7 billion in the June quarter last year. We expect gross margin to be about 38%, reflecting approximately $55 million related to stock-based compensation expense. We expect OpEx to be about $2.5 billion, including about $255 million related to stock-based compensation expense. We expect OI&E to be about $70 million and we expect the tax rate to be about 25%. We are targeting EPS of about $5.03.

    Apple Management Discusses Q2 2011 Results - Earnings Call Transcript - Seeking Alpha

    Last quarter Apple guided revenue growth at an aggressive 63% with an EPS growth of 47%. They delivered 83% and 93% respectively.

    They are now guiding about 47% revenue growth and 43% EPS growth and my current estimates are 65% and 72% respectively based on the following:

    • iPhone units: 14.7 million (75%)
    • Macs: 4.3 million (25%)
    • iPads: 9.8 million (200%)
    • iPods: 8.0 million (-15%)
    • Music (incl. app) rev. growth: 25%
    • Peripherals rev. growth: 25%
    • Software rev. growth: 25%
    • Total sales: $25.8 billion (65%)
    • GM: 38.5%
    • EPS: $6.02 (72%)

    The biggest uncertainty remains iPad growth. This will be the first quarter where we can dial in a y/y growth rate. I'm being bullish with 200% because I believe the ramp for the iPad 2 may get sorted out. There are also more countries being opened up this quarter (13 this week).

    Apple's stock price to earnings ratio has dropped to 16.72. Ex-cash it's 13.5. On a forward basis (my estimates) it's 8.3. Apple's valuation is now a case for business historians to discuss because I don't think there are modern precedents.


  6. Revisiting Estimates for Apple’s second quarter earnings (ended March)

    Research · 29 comments

    Estimates for Apple’s second quarter earnings ending March | asymco.

    Since making the original estimates In January,

    • Revenue: $24.5 billion
    • EPS: 5.89
    • iPhone unit sales: 18.4m
    • iPod unit sales: 10m
    • Mac unit sales: 3.6m
    • iPad unit sales: 7.3m
    • Gross margin percentage: 38.8%

    I revised them at the end of March to the following:

    • Revenue: $25 billion
    • EPS: 6.21
    • iPhone unit sales: 17.5m
    • iPod unit sales: 10m
    • Mac unit sales: 3.6m
    • iPad unit sales: 7.3m
    • Gross margin percentage: 39.6%

    In the past I was comfortable keeping untouched estimates made three months in advance. This quarter however there have been several developments during the quarter which were unforeseen and cause me to revisit my estimates.

    1. The Verizon iPhone launch. Observations of the event focused on line lengths and buying activity. However, Apple reports shipments not sell-through. I believe the deal structure was such that Apple obtained a very large order as condition to the relationship. The January and March update analysis did not consider this order size. We have also more data on sales from HTC and RIM and there is no letup in the market's growth. As a result I am revising the growth for the iPhone back up to 110% y/y and 18.4 million units.
    2. Crucially, I'm increasing iPhone ASP to $625 on the basis of this new demand and the likely delay of iPhone 5 launch.
    3. The iPad 2 launch. This product is still too young to see production and sales patterns. However, demand for the second version seems higher than for the first. Distribution is broader too. The unknown is production. I am keeping the unit number at 7.3 million which is the same as the level of CQ4.
    4. China is booming. The Chinese New Year occurred in the quarter and since last year that has meant a sequential increase in device sales for Apple. But it's a double edged-sword. Almost all production activity is shut down during the holiday period. Apple depends on China exclusively for manufacturing so they will certainly be affected. So whereas it's likely that we'll see increased demand from China this year due to even better distribution, macroeconomics and brand value I'm unsure if supply rose to match. Overall, I'm not changing unit growth due to his increased demand but I'm cautioning that there could be downside bias in my estimates.
    5. The tsunami disaster in Japan will affect some demand in Japan and some of the supply chain will be disrupted. However, the effect will be felt more by weaker competitors. It's possible that the event will amplify the shortages that Apple's pre-purchase agreements already created. The consequences are bad news for Apple's competitors but I rate it as neutral for Apple.

    Given these new facts coming to light, I would update my estimates as follows:

    • Revenue: $25.5 billion
    • EPS: 6.43
    • iPhone unit sales: 18.4m
    • iPod unit sales: 10m
    • Mac unit sales: 3.6m
    • iPad unit sales: 7.3m
    • Gross margin percentage: 39.9%

    Resulting EPS growth would thus be 93%.

    For the record, I value my January estimates since they are based on long-term pattern recognition rather than transient events and thus are more useful in forming a market theory.

    However, these transient events cannot be ignored and analysis needs to be informed by both theory and events. I will be watching to see which set of predictions (early, mid or late) will be more accurate.

  7. Estimates for Apple’s second quarter earnings (ending March)

    Research · 39 comments

    Apple's CFO guidance statement:

    We expect revenue to be about $22 billion, compared to $13.5 billion in the March quarter last year. We expect gross margins to be about 38.5%, reflecting approximately $50 million related to stock-based compensation expense. We expect OpEx to be about $2.35 billion, including about $250 million related to stock-based compensation. We expect OI&E to be about $50 million, and we expect the tax rate to be about 25.5%. We are targeting EPS of about $4.90.

    via Apple Management Discusses F1Q11 Results - Earnings Call Transcript - Seeking Alpha.

    This is a particularly aggressive revenue growth forecast of 63% (note again that Apple's P/E has dropped to 18 and 14 ex cash and 10 on a forward basis) . Since Apple always guides very conservatively, the likely figures for the top and bottom lines are likely to be higher.

    How much higher? Here are my estimates (growth in parentheses is year over year).

    • iPhone units: 18.4 million (110%)
    • Macs: 3.62 million (23%)
    • iPads: 6 million
    • iPods: 10.1 million (-7%)
    • Music (incl. app) rev. growth: 25%
    • Peripherals rev. growth: 23%
    • Software rev. growth: 23%
    • Total sales: $24.5 billion (82%)
    • GM: 38.8%
    • EPS: $5.89 (77%)

    Looking a bit further ahead, earnings suggest the company is now trading at a forward P/E of about 9.5.

  8. Estimates for Apple's first quarter earnings (January)

    Research · 38 comments

    Oppenheimer on the concall:

    We expect revenue to be about $23 billion compared to $15.7 billion in the December quarter last year. We expect gross margins to be about 36%. We expect OpEx to be about $2.325 billion.

    We expect OI&E to be about $65 million. And we expect the tax rate to be about 25.5%. We're targeting EPS of about $4.80.

    Here are my expectations:

    • iPhone units:  16.2 million (85% growth)
    • Macs: 4.3 million (27% growth)
    • iPads: 6 million
    • iPods: 18.9 million (-10% growth)
    • Music growth: 20%
    • Peripherals growth: 28%
    • Software growth: 11%
    • Total sales: $25.5 billion (63%y/y growth)
    • GM: 37.5%
    • EPS: $5.86 (60% y/y growth)
  9. Updated estimates for Apple's fourth quarter earnings

    Research · 12 comments

    We expect revenue to be about $18 billion compared to $12.2 billion in the September quarter last year. We expect gross margins to be about 35%...

    We are targeting EPS of about $3.44.

    via Apple Inc. AAPL Q3 2010 Earnings Call Transcript.

    I've updated my estimates from the July forecast as follows:

    • iPhone units: 12.2 13 million (65% 77% growth)
    • Macs: 4 million (30% growth)
    • iPads: 3.3 5 million
    • iPods: 9.4 9.7 million (-5% growth)
    • Music growth: 26.7% 25%
    • Peripherals growth: 21% 15%
    • Software growth: 8%
    • Total sales: $19.0 $20.5 billion (56% 69%y/y growth)
    • GM: 42.3% 40.4%
    • EPS: $4.78 $5.00 (73% 81% y/y growth)

    The main news items that affected the changes in estimates were:

    1. iPhone continues to be supply constrained.
    2. iPad supply nearly matching demand though not yet rolled out in all markets
    3. new iPods look compelling though offset by back to school promos

    Follow other estimates at Deagol's site:
    Deagol's AAPL Model: Fiscal 4Q 2010 Final Estimates

  10. Apple's growth vs. top 10 largest market caps

    Research · 33 comments

    Apple's stock price has been rising. Although it's still priced at a P/E of 22 while facing near term EPS growth well above 50%, this is belated recognition of the potential of the iPad and the iPhone.

    However, as it has grown, Apple's valuation is now not only higher than any other technology company but it's nearly the most valuable company on the planet. There is a theory that ultra-large market caps are reserved for companies that are past their prime. Sometimes this is attributed to the law of large numbers: that conclusion that big numbers cannot grow much bigger because compounding growth is exponential whereas markets are limited and become quickly saturated.

    The trouble with this theory is that "large" is relative; large is often simply "the largest". Large market caps are not what they used to be. During past booms, large caps touched a trillion dollars. Today, the largest market cap is merely $314 billion.

    So I don't put much faith in large number "laws". The real question of under/over-valuation rests on whether the company is growing or not. Valuation is simply the net present value of future free cash flows (plus assets). So the most important determinant of current value is growth in cash flows.

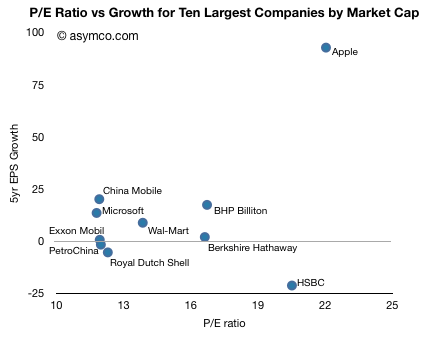
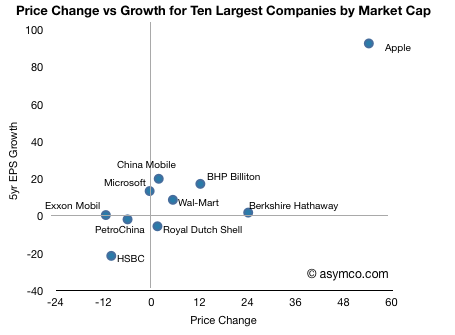
    It's fairly easy to assess this: compare P/E which is a proxy for valuation with EPS growth. The following chart does this for the top ten largest market caps traded on US exchanges (as listed by finance.google.com).

    One should see some correlation between the two variables, but given the 5 year time frame, many of these companies showed large volatility. There are outliers like HSBC which has a rapidly rising value even though it was badly affected by the credit crunch.

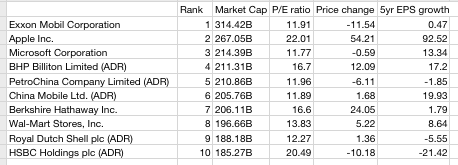
    The other outlier is Apple. The company showed 93 percent EPS growth over a five year period and has a P/E of 22. The company with the next highest total value (Exxon Mobil) had 0.5% growth with a P/E of 12. The company with the next lowest total value (Microsoft) had 13.3 percent growth with a P/E of 12.

    For an ultra-large cap, Apple's growth is unprecedented and extraordinary. It's in fact off the scale. The average growth of the other 9 top caps is 3.6 percent!

    Apple's growth is a factor of 25x higher. The P/E is only 1.6x higher.

    The result has been a much higher appreciation in the stock price as shown in the following chart.

    So it's clear that Apple, in this peer group, is far from ordinary.

    Data follows:

  11. Estimating Fourth Quarter Earnings for Apple

    Research · 4 comments

    We expect revenue to be about $18 billion compared to $12.2 billion in the September quarter last year. We expect gross margins to be about 35%...

    We are targeting EPS of about $3.44.

    via Apple Inc. AAPL Q3 2010 Earnings Call Transcript.

    That $18 billion figure is extraordinary.  Consider that last year during the same quarter, the company received $12.2 billion, then the sales growth forecast is about 50%.  Granted that even though Apple just achieved 61% sales growth last quarter, Apple management is unusually aggressive in underestimating.

    Given this, I am looking at the following forecast:

    • iPhone units: 12.2 million (65% growth)
    • Macs: 4 million (30% growth)
    • iPads: 3.3 million (flat sequentially, production constrained)
    • iPods: 9.4 million (-8% growth)
    • Music growth: 26.7%
    • Peripherals growth: 21%
    • Software growth: 8%
    • Total sales: $19.0 billion (56% y/y growth)
    • GM: 42.3%
    • EPS: $4.78 (73% y/y growth)

    If this estimate proves correct, then at the end of the quarter (Oct 1) the trailing twelve months' earnings per share will be $15.29.  That is equivalent to P/E of 16.82 on the back of four quarters of earnings growth (47%, 86%, 75% and 73% respectively).  The price/earnings excluding cash would be 13.4.