Asymco

Asymmetric Intelligence

EPS

  1. Morgan Stanley has a stark message for investors in Apple

    Nota Bene · 1 comment

    Run for the hills

    Morgan Stanley just published survey data that makes a strong case for owning Apple stock. The firm's AlphaWise Global Smartphone Survey was released March 22. It shows iPhone upgrade intentions hitting an all-time survey high.

    The data support the bank's above-consensus iPhone forecast. Morgan Stanley keeps its overweight rating and $315 price target unchanged. The stock closed at $247.99 on March 20. That target implies roughly 27% upside from that level.

    The headline number is a blended global iPhone upgrade rate of 37%, up 2 percentage points year over year. That is the highest reading in the survey's history. The driver is China, where upgrade intentions surged 9 points year over year to reach their own all-time high in the survey.

    On the switching side, Apple's net switching rate improved to 11%. That is a five-year high. Apple was the only major smartphone brand in the survey with a positive and improving net switching rate.

    Samsung, Xiaomi, Huawei, and others were all negative. That positions Apple to gain market share in 2026 even as the overall smartphone market faces pressure.

    Together, these data points support Morgan Stanley's FY26 iPhone shipment forecast of approximately 260 million units, which sits 3% above Street consensus.

    The most surprising result in the survey may be the level of interest in a foldable iPhone. Morgan Stanley found that 27% of global iPhone owners are “extremely interested” in paying for one. In China, that figure rises to nearly 40%.

    Morgan Stanley expects Apple to more than double the global foldable smartphone market within 18 months of launch. The base case puts foldable iPhone revenue at approximately $40 billion. The bull case reaches $60 billion.

    The foldable iPhone is expected to launch in fall 2026 alongside the iPhone 18 Pro lineup. If the survey data translates to actual purchases, the FY27 revenue impact would be significant. Morgan Stanley's FY27 iPhone revenue estimate is already 14% above Street consensus. The foldable is a big reason why.

    Apple Intelligence ranked seventh globally as a reason to upgrade to an iPhone.

    Willingness to pay for Apple Intelligence fell. Respondents said they would pay approximately $8 per month for an unlimited subscription, down from roughly $9 per month in the prior year's survey.

    Morgan Stanley flagged this as a risk worth watching. AI features remain important to smartphone buyers broadly. But Apple appears to be lagging Android competitors in consumer perception of its AI capabilities.

    Morgan Stanley laid out the key variables investors should watch this year:

    iPhone upgrade cycle. Record upgrade intentions suggest the aged iPhone installed base is beginning to refresh. Replacement cycles are expected to contract by 0.2 years in 2026, which supports shipment volumes.

    Foldable launch execution. The survey demand signal is encouraging, but first-generation foldable adoption is inherently uncertain. The revenue upside is large if execution is strong.

    Memory cost impact. Unprecedented memory price inflation is expected to push global smartphone prices higher. Morgan Stanley sees this as a bigger headwind for Android competitors than for Apple, given Apple's pricing power. But the June quarter gross margin guidance will be the first real read on how Apple is managing the cost pressure.

    Apple Intelligence revamp. The 2026 Siri upgrade needs to meaningfully improve consumer perception. The current trajectory is moving in the wrong direction.

    Morgan Stanley's $315 price target is based on 8.5x EV/Sales on FY27 estimates. That implies approximately 32x FY27 EPS of $9.74. Its revenue forecast sits well above the Street even as its EPS estimate is broadly in line with consensus.

    The survey does not guarantee an upgrade supercycle. But the data points in that direction. An aged installed base, record upgrade intentions, strong switching dynamics, and a new form factor in the back half of the year make for a compelling setup.

    Morgan Stanley thinks the market is not fully pricing that in yet.

    Source: TheStreet

    NB: the byline: Morgan Stanley just changed the Apple conversation …
  2. Morgan Stanley resets Apple stock forecast ahead of earnings - thestreet.com

    Nota Bene

    Consensus estimates Apple to post about $138.4 billion in revenue and both GAAP and non-GAAP earnings per share (EPS) of around $2.67 for the December quarter. The numbers highlight at least an 11% year-over-year growth in EPS and revenue, but analysts are now tightening their margin forecasts despite favourable iPhone sales and AI roadmap.

    In a note, Morgan Stanley analyst Erik Woodring reiterated an Overweight rating and an unchanged price target of $315, but cautioned investors that Apple stock could “trade sideways to modestly lower after earnings.”

    The firm expects Apple to beat expectations, driven by stronger, more persistent iPhone demand. Woodring expects December-quarter revenue of about $80 billion, around 4% above consensus, and March-quarter revenue of $55.4 billion, about 8% above consensus, citing supply-chain checks and shipment data.

    He said iPhone 17’s “strength remains underappreciated by the Street.”

    Morgan Stanley sees cost assumptions as overly optimistic. The firm forecasts March-quarter operating expenses about 7% above consensus and a gross margin forecast 30 basis points below consensus, driven by rising memory costs.

    As a result, Woodring sees limited scope for positive EPS revisions for Apple, even with a revenue beat.

    Morgan Stanley also flagged potential downside risk to June quarter earnings, estimating EPS of $1.62 versus the consensus of $1.71, citing intensifying memory-related cost pressures. The firm also notes that Apple has historically underperformed the S&P 500 more in Q1 than in any other period.

    Looking ahead to 2026

    All things considered, Morgan Stanley believes Apple is positioned to outperform in 2026 as a wave of new products and AI-driven catalysts is set to shape the company’s growth trajectory. The firm particularly highlighted the relaunch of Siri in February and Apple Intelligence in June at Apple’s Worldwide Developers’ Conference (WWDC).
    Some notable introductions expected include its most “innovative iPhone in 10+ years (Foldable)“, plus the first smartphone powered by 2-nanometer chips, part of the iPhone 18 family.

    The firm sees greater benefits from share gains and higher average selling prices, with Morgan Stanley underscoring an EPS of $9.77 for FY2027, roughly 7% above Wall Street consensus.

    Read the original article →

    Our Take

    Earnings will be above consensus. All eyes will be on how margin guidance due to pressure from memory pricing. Every year it's another thing that is cause for drama. It never matters.

  3. Predicting Apple's Biggest Quarter Ever

    Research

    Apple's Money Mountain

    As we approach the earnings release for the first fiscal/fourth calendar quarter for Apple, it's time to look back three months at what the company delivered and guided in the previous quarter.

    The summary for results for fourth (fiscal) quarter of FY2025:

    • Revenue up 8% year-over-year, a new September quarter record.
    • EPS was up 13% year-over-year.
    • Product revenue was up 5% year-over-year driven by growth across iPhone and Mac.
    • iPhone revenue was up 6% year-over-year, and set a September quarter record despite supply constraints faced on several iPhone 16 and iPhone 17 models.

    The iPhone active installed base grew to a new all-time high and had a quarterly record for upgraders. Also, Apple reached a new all-time high for installed base of active devices.

    • Mac revenue was up 13% year-over-year, driven by MacBook Air.
      Apple grew in every geographic segment, with strong double-digit growth in emerging markets.
      Mac installed base reached another all-time high, with nearly half of customers who purchased a Mac being new-to the product.
    • iPad was down 3% revenue and but over half of the customers who purchased iPad this quarter were new-to the product. iPad also had a September quarter record for upgraders.
    • Wearables, Home & Accessories Revenue for the category was flat y/y.
      Apple saw a September quarter record for upgraders to Apple Watch, and over half of Apple Watch buyers were new-to the product.Both the Apple Watch and AirPods installed bases reached new all-time highs.
    • Services again set a new all-time revenue record up 15% year-over-year.
      Apple saw double-digit growth in both developed and emerging markets.
      Apple saw a sequential acceleration across the majority of the categories and set new all-time records across Advertising, App Store, Cloud Services, Music, Payment Services, and Video. Apple saw a double digit growth in Apple Pay.

    Guidance was provided as follows:

    We expect iPhone revenue to grow double digits year-over-year, which would be our best iPhone quarter ever. On Mac, keep in mind, we expect to face a very difficult compare against the M4 MacBook Pro, Mac Mini and iMac launches in the year ago quarter. We expect Services revenue to grow at a year-over-year rate similar to what we reported in the fiscal year 2025.

    We expect gross margin to be between 47% and 48%, which includes an estimated impact of $1.4 billion of tariff-related costs. And so for the December quarter, we expect operating expenses to be between $18.1 billion and $18.5 billion. We expect OI&E to be around $150 million, excluding any potential impact from the mark to market of minority investments and our tax rate to be around 17%.

    Based on these forecasts my estimates for the top, bottom and middle lines are as follows:

    • Revenues: $140 Billion (+12%)
    • EPS: $2.70 (+12.5%)
    • iPhone: $78.9 Billion (+12%)
    • Mac: $9.4 Billion (+4%)
    • iPad: $8.5 Billion (+5%)
    • Wearables: $12.9 Billion (+10%)
    • Services: $30 Billion (+14%)

    If there is an error in the above I would guess it's in iPhone being too low and the iPad/Mac and Wearables being too high. Nevertheless, I think this will be Apple's biggest quarter ever with significant growth acceleration on the top and bottom lines. [Notable will also be a rapid acceleration in R&D spending (+25%) as suggested by guidance.]

    As we head into this blockbuster quarter, Apple shares are trading at a P/E ratio of 32 to 33, a significant drop from above 35 during previous few quarters. During the last three months, the share price has declined about 15% as Mr. Market looked at the money mountain above and decided he wanted none of it.

  4. Forecast for Apple's Earnings for Fiscal Fourth Quarter 2023

    Research

    As we move ahead into the September quarter, I'd like to review our outlook, which includes the types of forward-looking information that Saori referred to at the beginning of the call. We expect our September quarter year-over-year revenue performance to be similar to the June quarter, assuming that the macroeconomic outlook doesn't worsen from what we are projecting today for the current quarter. Foreign exchange will continue to be a headwind, and we expect a negative year-over-year revenue impact of over 2 percentage points.

    We expect iPhone and Services year-over-year performance to accelerate from the June quarter. Also, we expect the revenue for both Mac and iPad to decline by double digits year-over-year due to difficult compares, particularly on the Mac. For both products, we experienced supply disruptions from factory shutdowns in the June quarter a year ago and were able to fulfill significant pent-up demand in the year ago September quarter.

    We expect gross margin to be between 44% and 45%. We expect OpEx to be between $13.5 billion and $13.7 billion. We expect OI&E to be around negative $250 million, excluding any potential impact from the mark-to-market of minority investments, and our tax rate to be around 16%.

    Luca Maestri, CFO Apple Inc., Aug. 03, 2023

    In August Apple reported Net sales growth of -1% and EPS growth of 5.4%. My expectation is a 1% sales growth with EPS growth of 11.4%. This might be slightly optimistic but it's based on the following assumptions:

    • iPhone unit growth of -1.4% (y/y) but revenue growth of 2% (as per guidance, up from -2% previous quarter's growth).
    • Mac unit and revenue growth of -12% (this might be optimistic, low confidence)
    • iPad unit growth of -2% but revenue growth of -12%.
    • Services revenue growth of 12% (acceleration from 8% q/q)
    • Wearables 2% revenue growth (consistent q/q, down from 10% y/y)

    I estimate the gross margin to remain at 44.5%, open to be $13.5 billion (low-end of guidance), OI&E at -$250 million (per guidance) and tax rate at 16%.

    The number of shares I estimated at 15.666 billion (down 109 million, below 126 million average drop for last 8 quarters.)

    To summarize, for the fiscal fourth quarter 2023:

    • Total revenue: $91.1 billion
    • EPS: $1.43

    Revenue by segment:

    • iPhone: $43.5 billion
    • iPad: $6.2 billion
    • Mac: $10.0 billion
    • Services: $21.5 billion
    • Wearables/Home/Accessories: $9.8 billion
    • Gross margin on total revenue: 44.5%

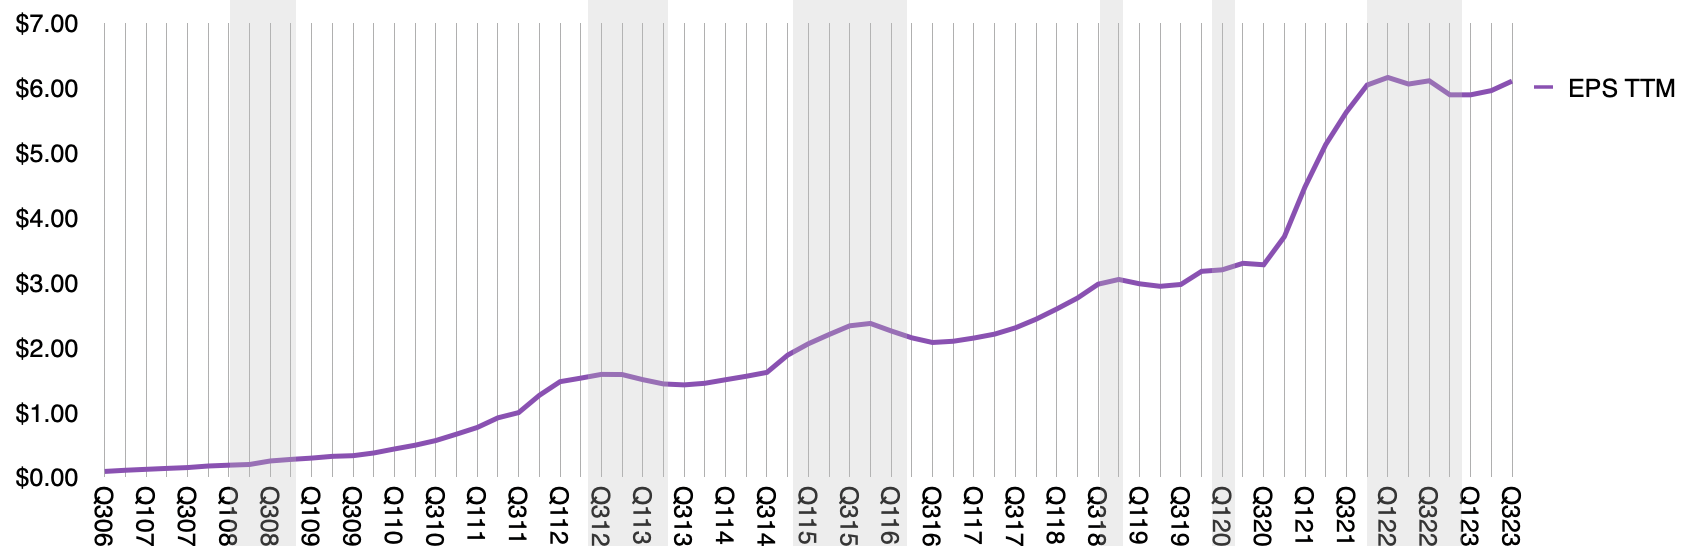
    As can be seen in the following graph, my expectation is that the company will return to a pre-Covid growth trajectory (on a TTM EPS basis) after a transient surge and recovery due to the phenomenon of work-from-home and reduced travel. The uncertainty related to Covid is subsiding but macro and geopolitical uncertainties remain and the company continues to provide limited guidance.

  5. Earnings Per Share

    Research · 32 comments

    Three months ago Apple provided the following guidance:

    As we move ahead into the June quarter,[…] We expect revenue to be between $51.5 billion and $53.5 billion. We expect gross margin to be between 38% and 38.5%. We expect OpEx to be between $7.7 billion and $7.8 billion. We expect OI&E to be about $400 million. And we expect our tax rate to be about 14.5%.

    If we aim for a revenue figure close to the upper end of the range ($53.2 billion) and insert all the other figures (split the difference for OpEx) then then the company's fiscal third quarter looks as follows:

    Revenues: $53.2b
    iPhone (units): 43.2 million
    iPad (units): 11.6 million
    Mac (units): 4.3 million
    Services ($): 9.5 billion
    Other products ($): 3.5 billion
    Gross margin (%): 38.6%

    EPS ($): $2.26

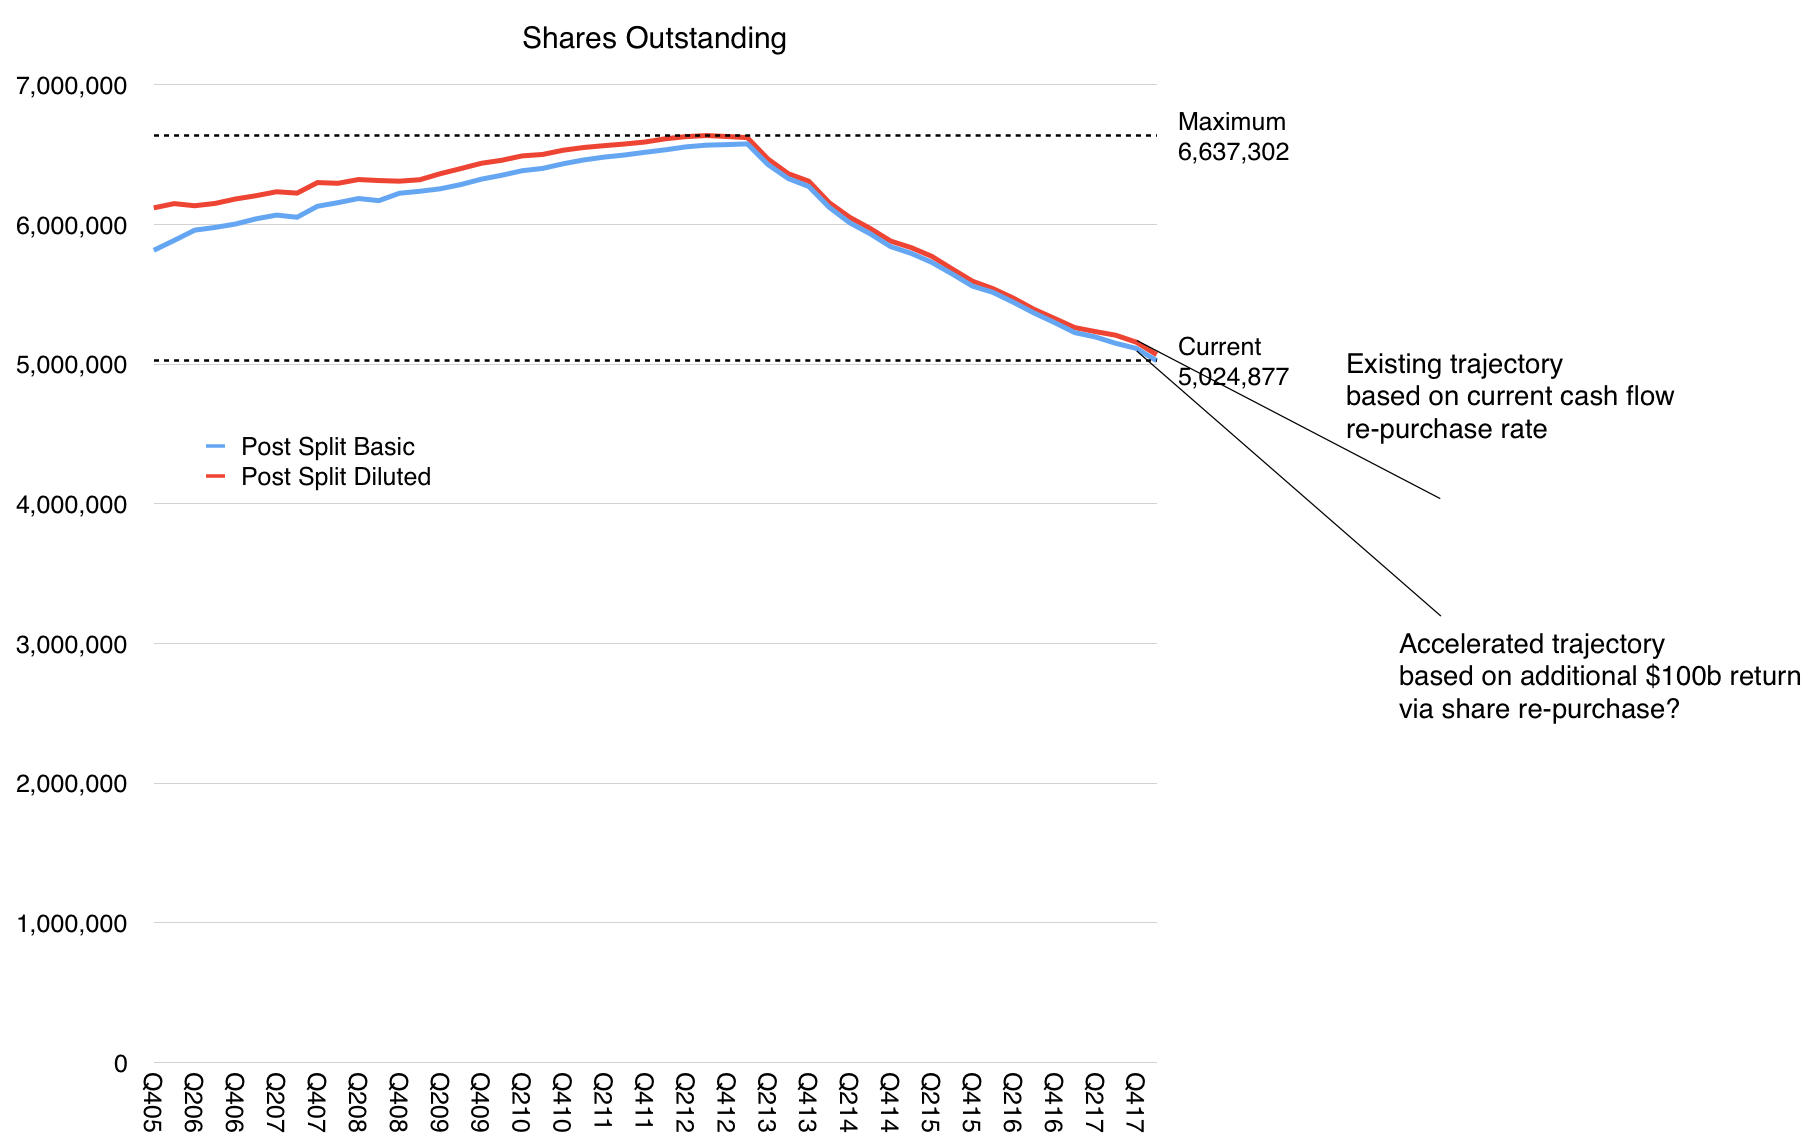
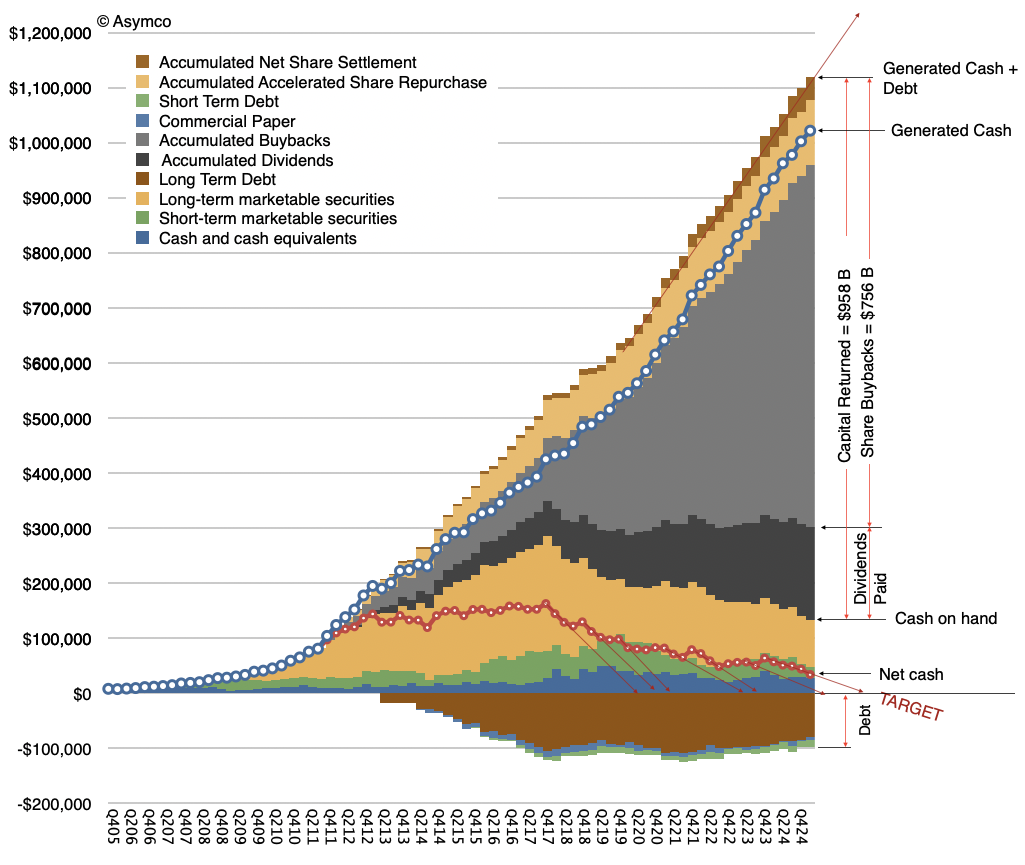
    This last figure, the earnings per share, is the most speculative because it depends on another guidance that Apple gave: a new $100 billion share repurchase authorization and the fact that it has no time frame. For context, as of end of March the company had completed over $275 billion of its previous $300 billion capital return program and $10 billion remained for share re-purchases in the June quarter. It's unclear how much of the new authorization will be spent in the quarter.

    That spending could indicate the share count but there are issues with this calculation as well. The $2.26 EPS I forecast is based on the assumption that the the same number of shares will be retired as in the previous quarter (about 89 million shares.) However the company spent $23.5 billion on repurchases of 137 million Apple shares through open market transactions (for an average price or $171.53, in-line with the quarter's trading average).

    So why is the number of shares purchased (137 million) so different from the change in shares used to compute earnings per share (89 million)? I actually don't know.

    The question of how many shares are available to calculating EPS is perhaps the last mystery in what is otherwise a very predictable business. The revenue growth and implied iPhone growth are pretty transparent. Incidentally, the EPS I'm forecasting is equivalent to growth of 35.8% y/y. The share price is trading at multiples about half of this growth rate so it's no wonder the company is spending most of the cash on re-purchases.

    How quickly the $100 billion re-purchasing authorization will be used is another question. The effect in concentration of value per share could be profound as shown in the graph above which will have further implications on the "cash zero" direction for the company.


  6. Estimating Apple's Second Calendar Quarter

    Research · 8 comments

    Apple reports second calendar quarter results in about a week. I propose the following estimates:

    Fiscal Q3 2017:
    Rev ($B) 45.321
    EPS ($) 1.62
    iPhone (units) 41 million
    iPad (units) 9.8 million
    Mac (units) 4.35 million
    Watch (units) 2.5 million
    Services ($) 7.2 billion
    Other products ($) 2.6 billion
    Gross margin (%) 38.4

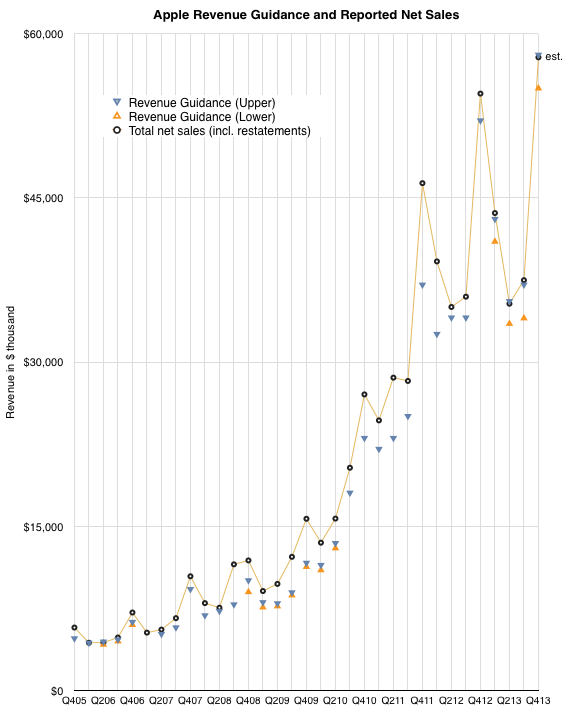
    The revenue estimate is visualized in relation to guidance (revenue between $43.5 billion and $45.5 billion) and shown in the context of previous actual revenues below:p

    The estimates are also consistent with additional guidance provided:

    • Gross margin between 37.5% and 38.5%
    • Operating expenses between $6.6 billion and $6.7 billion
    • Other income/(expense) of $450 million
    • Tax rate of 25.5%

    The estimates (and guidance) suggest modest growth of 7% in revenues and 13.7% EPS. The predictability of the quarter suggests that attention will mostly be focused on guidance for the next quarter.

    Expectations can vary quite a bit because of the effects of a new launch. The product mix, pricing and timing are all unknown at this time.

    What is known however is that the customer base for Apple is increasing and loyalty is higher than ever. What I sense, coming from very few data points, is that there are more iPhones in use than ever before. A few years ago when the market was less saturated it was easy to assume that commodity Android phones and tablets would surge and swamp iPhone/iOS usage.

    This has not happened, indeed the data suggests that iOS usage is stronger than ever and that there are many more "switchers" moving from Android to iOS than vice-versa.

    This may surprise some but if we look at the PC market, a similar phenomenon has been taking place for years. Mac usage grows and Macs are more visible and valuable than PCs.

    It's important to note that in the latter, post saturation stages, the markets for both phones and computers are increasingly driven by brand value. This resistance to commoditization is due to buyers' perceptions of quality moving beyond utility and of the prioritization by buyers of new measures of performance. These new measures defy measurement.

    Much of what is therefore required of market analysts is intuition.

  7. Apple Fourth Quarter Estimates

    Research · 56 comments

    As Philip Elmer-DeWitt is still interested in my estimates I provided the following:

    Revenues ($B) 57.8
    EPS ($) 14 (908m shares)
    iPhone (units) 56.4 million
    iPod (units) 7.6 million
    Mac (units) 4.14 million
    iPad (units) 26.5 million
    iTunes/Software/Services ($) 4.2B
    Accessories ($) 2.2B
    GM% (percentage) 37.1%

    I arrived at these estimates without looking at anyone else's (except for Apple's own published guidance). Soon after sending them I noticed that Daniel Tello published his own.

    In the same format as above, I quote them for comparison. Please visit his post for additional detail.

    Revenues ($B) 59.0
    EPS ($) 14.92 (895m shares)
    iPhone (units) 56 million
    iPod (units) 9 million
    Mac (units) 4.65 million
    iPad (units) 25.5 million
    iTunes/Software/Services ($) 4.3B
    Accessories ($) 1.8B
    GM% (percentage) 37.8%

    The graph below shows the history of revenue guidance vs. revenue reported. The last quarter shows my estimate for net sales.

    Screen Shot 2014-01-15 at 1-15-4.06.58 PM

    Note that the company achieved at or slightly above its upper guidance ever since they started offering a range for guidance (i.e. since Q1 2013). My estimate for sales is therefore very near the top of guidance. The figures for units earnings and margins all result from this assumption.

  8. Estimates for Apple’s first fiscal 2013 quarter

    Research · 130 comments

    I've postponed my estimates for the fourth calendar for a long time. The reason is that there have been conflicting data to deal with and I've been hoping for some clues to give clarity. Unfortunately, even though I waited, I have not received many clues. Here are the challenges we have to deal with in this quarter:

    1. Management gave very low guidance for the quarter's earnings and sales. Normally this should not be a concern since the long-term pattern has been for them to "sandbag" significantly. For example last year's fourth quarter was guided at $9.3 EPS while the company delivered $13.87, a 49% "beat" to their guidance. However Q2 and Q3 beats were only 7% and 13% respectively and if we assume a similar number (10%) for Q4 we get about $13/share which would be a year-on-year decline in earnings (down from $13.9). This has not happened for many, many years. Management explained this through a lengthy set of reasons including a shorter quarter (13 weeks vs. 14 weeks), new product launches, currency fluctuations, deferrals and unfavorable component pricing. Then again, similar explanations were used in the past with no reflection in what actually happened.
    2. Management also launched a large number of new products. This normally leads to a surge in sales. In fact, 80% of revenues would come from a new portfolio of products. Having such a broad launch quarter into a holiday, would normally imply huge growth. Not only is this a critical launch quarter for many products but they also rolled out the iPhone to more markets more quickly than ever: 100 countries in three months. The broad roll-out implies a steeper ramp in production and thus more volumes. This would also contradict the lowered expectations from the CFO. However...
    3. Production was constrained. It was quite a long time before waiting times decreased for the iPhone--longer than what we saw last year. In the earnings call Tim Cook said "It's difficult to predict when supply and demand will balance, but I'm feeling very confident on our ability to supply quite a few iPhones". This again implies significant acceleration but did they achieve the targets? He did also announce that they met their target of 100 countries during the quarter but it's not clear if this was as quickly met as they would have liked.
    4. Margins are complicated. Launch quarters have lower margins typically and this is well understood. However, we have new products in the form of a new iPad at a new price point as well as the new iPhone which may have had some difficult manufacturing issues (i.e. yield). So how much faith do we put in the perennial pessimism in guidance?
    5. There was a vast increase in CapEx in the prior quarter. Normally CapEx spending "leads" production and is in proportion to it. However, the surge in Q2 and Q3 seemed to be unmatched by vast new production, at least that's what we are led to believe by both consensus and by management guidance. Did this CapEx differ in character from previous CapEx? Was it more "strategic" and less "tactical"? Will the disconnect continue?

    There are also the deeper questions:

    • Why there are no new operators being signed? The addressable market has not increased in the last 6 months. Why?
    • Is there a faster product cycle in the works? Is there a shifting of gears to a new product development process?
    • What's the nature of the relationship with Samsung as a supplier? Is their replacement characterizing the new type of CapEx spending?

    All these currents make this quarter doubly difficult to forecast. And it does not help that it comes on the back of two weak quarters which were argued away as exhibiting transition effects.

    So I'm very uncomfortable with my forecast and find it hard to defend this quarter. I considered not publishing one at all because it gives too much confidence when none is warranted. However, I received so many requests to publish that I relent and offer the following:

    • iPhone units: 55.5 million (50%/62%)
    • Macs: 5.0 million (-4%/+3%)
    • iPads: 24.4 million (58%/70%)
    • iPods: 11.2 million (-27%/-22%)
    • Music (incl. app) rev. growth: 25%/38%
    • Peripherals rev. growth: 10%/19%
    • Software rev. growth: 5.5%/14%
    • Total revenues: $60.0 billion (30%)
    • GM: 39.8%
    • EPS: $15.74 (13%)

    I included two growth figures (in parentheses). The first is a straight y/y value and the second is adjusted by assuming there were 13 weeks last year (and that sales were evenly distributed over those weeks).

    [We'll get a chance to go over this forecast and what is actually reported at Asymconf. Don't forget to sign up.]

  9. Estimates for Apple's fourth fiscal 2012 quarter [Updated]

    Research · 74 comments

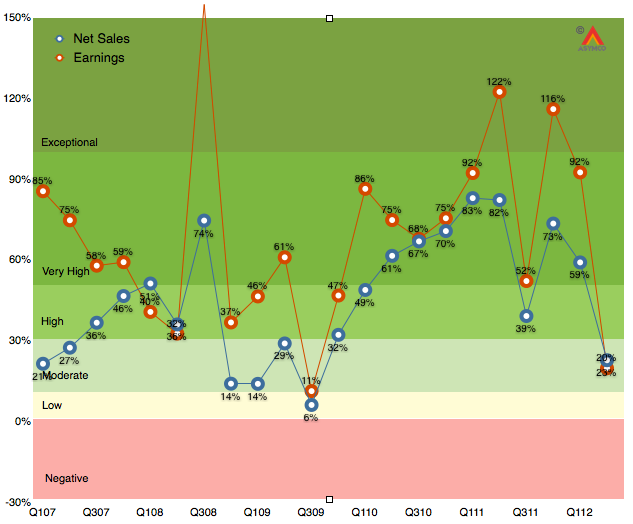
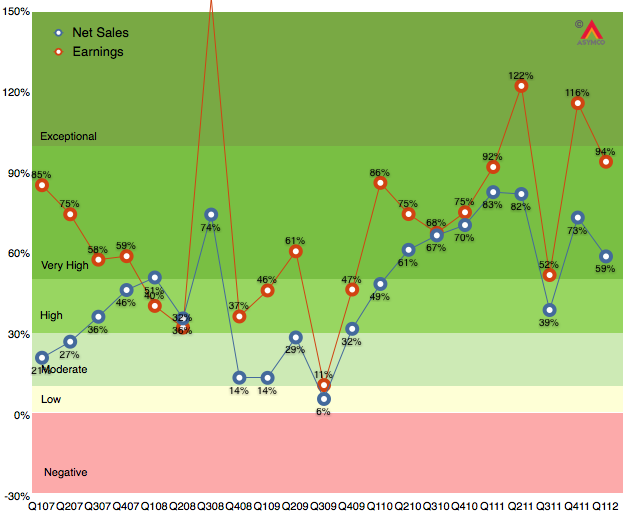
    As the chart below shows, the last quarter (second calendar 2012, third fiscal 2012) was disappointingly moderate with 20% earnings growth and 23% net sales growth.

    It was the first quarter since the iPhone launched that earnings growth has fallen into moderate (below 30%) territory. Much of that disappointment (to me) was the relatively low performance of the iPad following a launch quarter. The iPhone was weak as well, though that was expected.  As I said last quarter, the iPhone is still the most important component but the iPad is becoming increasingly decisive in overall performance. In fact, I’m projecting that the iPad will have the same revenues as the iPhone had one year earlier.

    The iPhone is going to be extremely difficult to project. On one hand we have the launch of the i5 which will account for about 10 million units in the quarter, on the other, chances are that sales were very weak prior to the launch as purchases were being deferred even more than during the last quarter.

    So with these very meager clues, here are my estimates for the quarter (with y/y growth in parentheses):

    • iPhone units: 27.8 million (62%)
    • Macs: 5.6 million (15%)
    • iPads: 18.8 million (69%)
    • iPods: 5.6 million (-15%)
    • Music (incl. app) rev. growth: 40%
    • Peripherals rev. growth: 10%
    • Software rev. growth: 15%
    • Total revenues: $39.5 billion (40%)
    • GM: 42%
    • EPS: $9.75 (38%)

    This earnings value would imply a trailing twelve months’ EPS of about $45.2. At the current price of $697/share the P/E would be 15.4. Cash and equivalents will probably increase to $125 billion or $131/share. Excluding cash, the P/E would be 12.5.

    [Update. The EPS figure above includes a tax rate estimate of 30%. Company guidance was 25.5%. Using the company's guidance yields an EPS of 10.43. TTM EPS becomes $45.9/share and at $697 the PE is 15.2. At time of this update the share price has fallen to $665 and thus the pro-forma trailing P/E ratio is 14.5).]

  10. Estimates for Apple's third fiscal 2012 quarter

    Research · 77 comments

    As the chart below shows, the last quarter (first calendar 2012, second fiscal 2012) was robust with 94% earnings growth and 59% net sales growth. Subject to the usual superlatives, the performance was, again, unexpected by many.

    Much of that surprise was due to the underestimation of iPhone sales in China during what is a holiday quarter in that nation. Growth this quarter will be more difficult to estimate. The iPhone is still the most important component but the iPad is becoming increasingly decisive in overall performance. In fact, I'm projecting that the iPad will have the equivalent of 73% of the iPhone revenues this quarter.

    In this quarter the iPhone is reaching a late stage in its launch cycle but it continues to reach more points of purchase through distribution agreements and it also has a "portfolio" in terms of multiple price points and models available.

    The iPad was supply constrained last quarter and may be in balance this quarter. Management has very clearly and repeatedly signaled that the iPad will have a very strong quarter.

    So with these clues, here are my estimates for the quarter (with y/y growth in parentheses):

    • iPhone units: 28.5 million (40%)
    • Macs: 4.5 million (15%)
    • iPads: 24 million (160%)
    • iPods: 6 million (-20%)
    • Music (incl. app) rev. growth: 35%
    • Peripherals rev. growth: 20%
    • Software rev. growth: 15%
    • Total revenues: $41.9 billion (46%)
    • GM: 44.8%
    • EPS: $11.54 (48%)

    This earnings value would imply a trailing twelve months’ EPS of about $44.8. At the current price of $571/share the P/E would be 12.7[1]. Cash and equivalents will probably increase to $118 billion.

    ---

    1. Apple's P/E also dropped to 12.7 around Christmas 2008. I did a search for some headlines to recall that time and came across one that seems appropriate: "Unrest Caused By Bad Economy May Require [domestic] Military Action, Says US Report".
  11. Estimates for Apple's second fiscal 2012 quarter

    Research · 74 comments

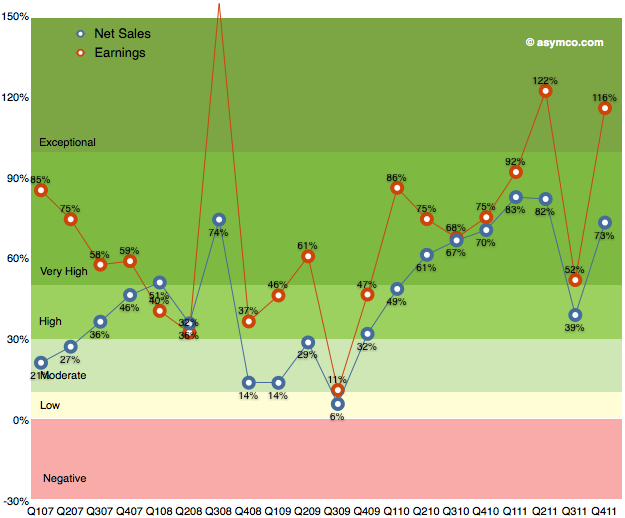
    As the chart below shows, the last quarter (fourth calendar 2011, first fiscal 2012) was robust with 116% earnings growth and 73% net sales growth. I've heard many superlatives used to describe it. It is certainly exceptional but it was not as good as the second calendar quarter of 2011.

    Sales grew faster both in CQ1 and CQ2 of 2011 and earnings grew faster in CQ2. It was in many ways a return to normality due to the iPhone returning to 133% revenue growth after the lull of the transitional third quarter.

    Now it's time to consider the current quarter. It's already quite late in the quarter to make predictions, but I waited to hear some data about the iPad. The iPad remains a difficult product to forecast. Mainly because it is a new category and the pattern of growth takes a long time to establish. We've only had three quarters where y/y growth could be measured. Sales growth has been 180%, 146% and 99%. Unit growth has been 183%, 166% and 110%.

    These rates have been higher than the average iPhone growth rates (average of which was 100% in units and 108% in revenues over the calendar 2011). Indeed, the average iPad growth rate so far seems to be 150%.

    Is it sustainable?

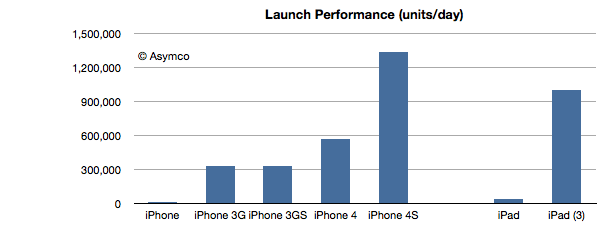
    The answer from this latest launch seems to be yes. The following chart shows the launch performance of the various iOS devices whose launch performance has been announced.

    The growth in launch performance between iPad 1 and iPad 3 is a factor of 28. iPad third generation had broader distribution but the volume boost from first generation is enormous. This implies a vastly improved production ramp. As the product remains supply constrained, the most important indicator of performance is production throughput.

    So given this data on the iPad and the ongoing broadening of the iPhone distribution network, here are my first quarter estimates (with y/y growth in parentheses):

    • iPhone units: 37.3 million (100%)
    • Macs: 4.7 million (25%)
    • iPads: 12.2 million (160%)
    • iPods: 7 million (-22%)
    • Music (incl. app) rev. growth: 40%
    • Peripherals rev. growth: 25%
    • Software rev. growth: 10%
    • Total revenues: $42.7 billion (growth: 73%)
    • GM: 44.7%
    • EPS: $12.0 (88%)

    This earnings value would imply a trailing twelve months’ EPS of about $40.7. At $600/share the P/E would be 14.7. Cash and equivalents will probably increase to $108 billion.