Asymco

Asymmetric Intelligence

forecast

  1. Morgan Stanley has a stark message for investors in Apple

    Nota Bene · 1 comment

    Run for the hills

    Morgan Stanley just published survey data that makes a strong case for owning Apple stock. The firm's AlphaWise Global Smartphone Survey was released March 22. It shows iPhone upgrade intentions hitting an all-time survey high.

    The data support the bank's above-consensus iPhone forecast. Morgan Stanley keeps its overweight rating and $315 price target unchanged. The stock closed at $247.99 on March 20. That target implies roughly 27% upside from that level.

    The headline number is a blended global iPhone upgrade rate of 37%, up 2 percentage points year over year. That is the highest reading in the survey's history. The driver is China, where upgrade intentions surged 9 points year over year to reach their own all-time high in the survey.

    On the switching side, Apple's net switching rate improved to 11%. That is a five-year high. Apple was the only major smartphone brand in the survey with a positive and improving net switching rate.

    Samsung, Xiaomi, Huawei, and others were all negative. That positions Apple to gain market share in 2026 even as the overall smartphone market faces pressure.

    Together, these data points support Morgan Stanley's FY26 iPhone shipment forecast of approximately 260 million units, which sits 3% above Street consensus.

    The most surprising result in the survey may be the level of interest in a foldable iPhone. Morgan Stanley found that 27% of global iPhone owners are “extremely interested” in paying for one. In China, that figure rises to nearly 40%.

    Morgan Stanley expects Apple to more than double the global foldable smartphone market within 18 months of launch. The base case puts foldable iPhone revenue at approximately $40 billion. The bull case reaches $60 billion.

    The foldable iPhone is expected to launch in fall 2026 alongside the iPhone 18 Pro lineup. If the survey data translates to actual purchases, the FY27 revenue impact would be significant. Morgan Stanley's FY27 iPhone revenue estimate is already 14% above Street consensus. The foldable is a big reason why.

    Apple Intelligence ranked seventh globally as a reason to upgrade to an iPhone.

    Willingness to pay for Apple Intelligence fell. Respondents said they would pay approximately $8 per month for an unlimited subscription, down from roughly $9 per month in the prior year's survey.

    Morgan Stanley flagged this as a risk worth watching. AI features remain important to smartphone buyers broadly. But Apple appears to be lagging Android competitors in consumer perception of its AI capabilities.

    Morgan Stanley laid out the key variables investors should watch this year:

    iPhone upgrade cycle. Record upgrade intentions suggest the aged iPhone installed base is beginning to refresh. Replacement cycles are expected to contract by 0.2 years in 2026, which supports shipment volumes.

    Foldable launch execution. The survey demand signal is encouraging, but first-generation foldable adoption is inherently uncertain. The revenue upside is large if execution is strong.

    Memory cost impact. Unprecedented memory price inflation is expected to push global smartphone prices higher. Morgan Stanley sees this as a bigger headwind for Android competitors than for Apple, given Apple's pricing power. But the June quarter gross margin guidance will be the first real read on how Apple is managing the cost pressure.

    Apple Intelligence revamp. The 2026 Siri upgrade needs to meaningfully improve consumer perception. The current trajectory is moving in the wrong direction.

    Morgan Stanley's $315 price target is based on 8.5x EV/Sales on FY27 estimates. That implies approximately 32x FY27 EPS of $9.74. Its revenue forecast sits well above the Street even as its EPS estimate is broadly in line with consensus.

    The survey does not guarantee an upgrade supercycle. But the data points in that direction. An aged installed base, record upgrade intentions, strong switching dynamics, and a new form factor in the back half of the year make for a compelling setup.

    Morgan Stanley thinks the market is not fully pricing that in yet.

    Source: TheStreet

    NB: the byline: Morgan Stanley just changed the Apple conversation …
  2. Analysis: Mac grew 16% and iPad grow 15% in China in the fourth quarter of 2025

    Nota Bene · 2 comments

    Not just the iPhone.

    Both the Mac and iPad marketshare in China grew year-over-year in 2025, according to new data from the Omdia research group.

    Apple sold 700,000 Macs in the fourth quarter of 2025 for 6% market share. That compares to sales of 600,000 Macs and 5% market share in the fourth quarter of 2024. That’s 14% annual growth.

    Apple sold 2.3 million iPads in the fourth quarter of 2025 for 25% market share. That compares to sales of 2 million iPads and 24% market share in the fourth quarter of 2024. That’s 16% annual growth.

    Looking ahead, China’s PC and tablet markets face significant headwinds. Omdia forecasts PC shipments in China will decline to 37.9 million units in 2026. This decline will be more pronounced in the consumer segment, which is expected to contract 12% compared to 2025. Tablet shipments are also projected to fall 11% to 32 million units in 2026, following elevated performance in 2025.

    Source: Apple World Today

    NB: I make it out to be 16% Mac growth not 14% and 15% iPad growth not 16%.

  3. Asymco Bulletin 005 - Mar 22, 2026

    Bulletin

    Asymco Bulletin is a digest of all the work we have published for the week ending Mar 22, 2026.

    Research

    How to calibrate executive departures

    Executive exodus explicated.

    In December, the company lost AI chief John Giannandrea, its top lawyer and a key design executive in a single week. Other recent headlines: “Apple faces unprecedented executive exodus”, “Apple rocked by executive departures, with chip chief at risk of leaving next.” “Apple home devices executive leaves for Finland’s Oura” “Lisa Jackson is set to retire late January 2026, while Kate Adams will retire in late 2026”. That’s just the names we hear about. They represent senior executives. But the harsh truth is that Apple lost tens of thousands of talented developers, marketers and mangers last year.

    What's wrong with this analysis? →

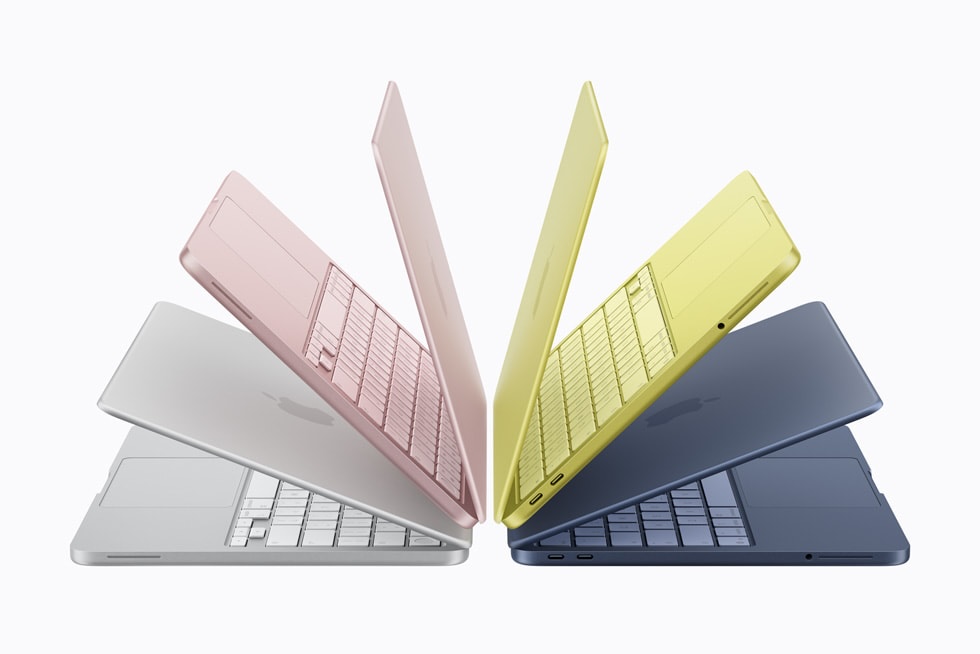
    The biggest surprise of the MacBook Neo

    The biggest surprise of the MacBook Neo

    Remembering the PC market.

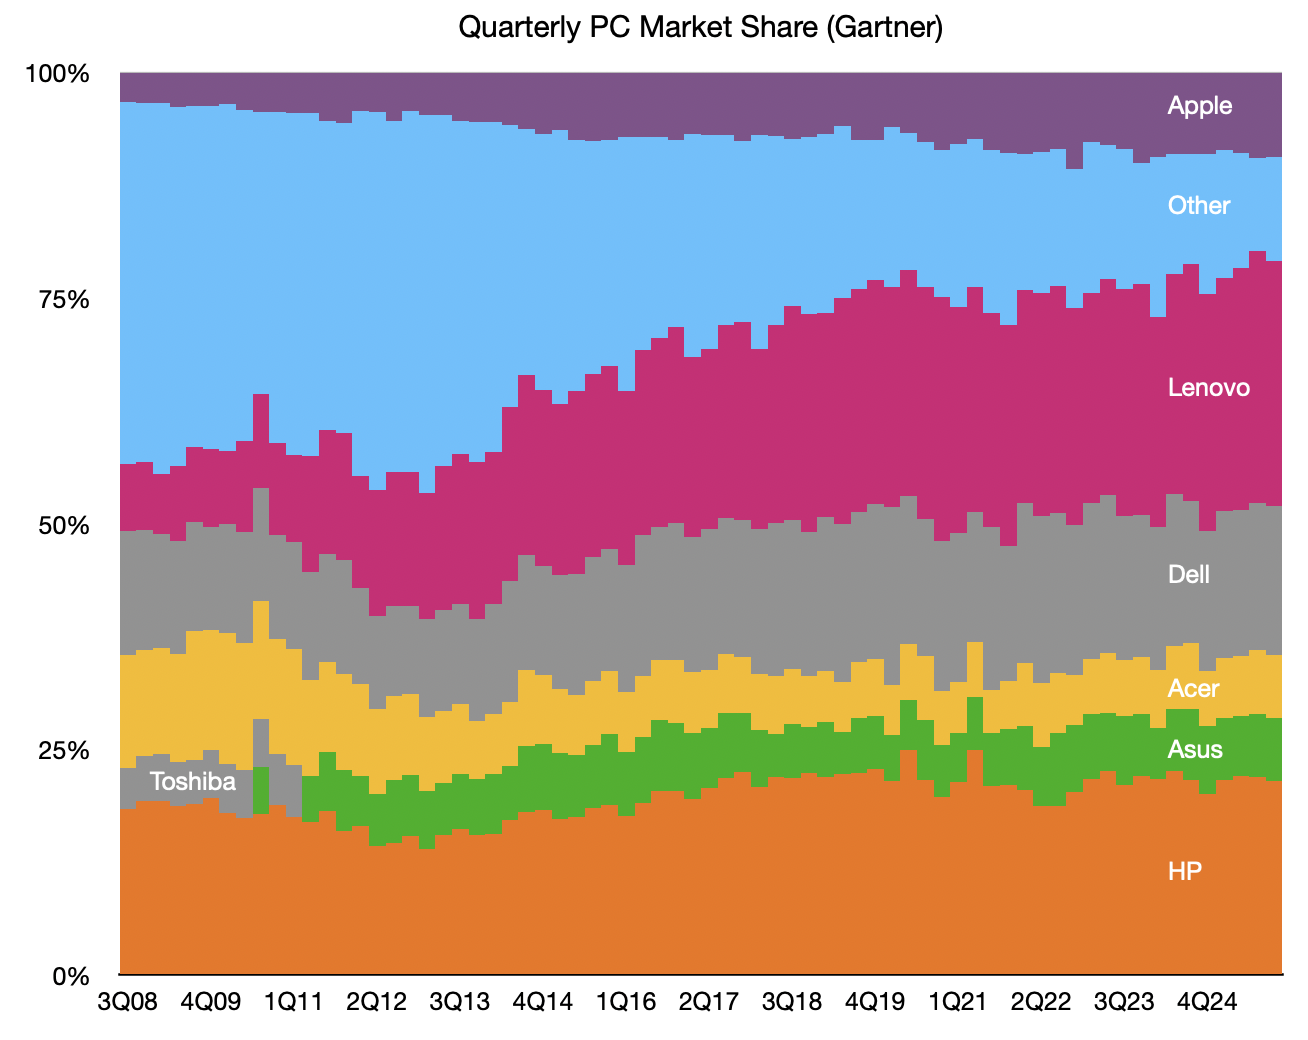
    Almost 10 years ago I said “Managing the Mac product line must be one of the most challenging problems at Apple. That may not be obvious given the product’s success.” I pointed out that although the company grew the Mac into a redeemed and prosperous platform, “The big change in computing has not been a growing Mac vs. declining PC. It has been a huge surge in mobile device use vs. a decline in PC use overall.” It’s time to revisit this observation. First, a status update: The Mac is in its 42nd year...

    How to read the history of the Mac and how to look at market share gains potential. Also: why the Mac has always been a cheaper alternative for buyers. →


    Nota Bene

    Apple’s China smartphone sales jump 23% as overall market fell 4% to start 2026 → Apple defied market trends with a striking 23% iPhone sales surge in China, outpacing competitors despite broader smartphone shipment declines. →

    Running a data-center AI model on a MacBook

    Running a data-center AI model on a MacBook → The article discusses how Apple's MacBook Pro, with its unique Apple silicon architecture, could revolutionize personal AI by enabling powerful AI models to run locally without relying on cloud data centers, potentially shifting the competitive landscape in Apple's favor despite current perceptions of lagging behind in AI advancements. →

    Tim Cook: Apple just had best launch week ever for first-time Mac customers

    Tim Cook: Apple just had best launch week ever for first-time Mac customers → Apple's MacBook Neo reportedly had its strongest launch week for attracting first-time Mac buyers, hinting at successful customer transitions from Windows. →

    Apple, Samsung Dominate 2025 List of Highest-shipping Models Across Regions → In 2025, Apple dominated premium smartphone markets across North America, Europe, and Asia-Pacific, while Samsung excelled in entry- to mid-tier segments in Latin America and the Middle East and Africa. →

    Apple Is Way Behind in AI—and Still Making a Fortune From It: WSJ → "Apple's billion-dollar AI distribution play highlights its retail prowess but pales against its trillion-dollar ambitions." →

    Lobster Boil

    Lobster Boil → "OpenClaw, a revolutionary open-source AI agent by Peter Steinberger, transforms personal computing by autonomously managing tasks across platforms, sparking a Mac Mini craze and hinting at a future where AI agents are integral to daily life." →

    ‘No Near-Term Catalyst,’ KeyBanc on Apple Stock

    ‘No Near-Term Catalyst,’ KeyBanc on Apple Stock → Near-term catalysts may not sway long-term investors, but if Apple's valuation seems steep, critique the pricing, not its promising 14% revenue growth forecast. →

    Tim Cook squashes retirement rumors, says he ‘can’t imagine life without Apple’ → Tim Cook dismisses rumors of stepping down, emphasizing his enduring passion for Apple and suggesting stability through potential political changes. →

    NVIDIA’s Language Processing Units Shipments Swell 10x+ vs Previous Yr (but how do they compare to Apple Silicon volumes?) → NVIDIA's Groq investment boosts LPU forecasts to 4-5 million, yet Apple's 500 million AI chips dwarf this, hinting at centralized intelligence reminiscent of '1984.' →

    Harmful chemicals found in popular headphones → Apple's AirPods Pro 2 and JBL's Tune 720BT topped the safety charts, while budget brands like Temu raised red flags for hazardous chemical exposure. →

    When does Apple split its stock? → Apple's stock split history shows a pattern of adjusting high share prices to maintain accessibility, with splits occurring around $100-$650 thresholds, potentially hinting at a $300 minimum for future splits. →


    Asymco One gives you full access to our research, analysis, and commentary. Subscribe with code BULLETIN for a discount.

    Feedback: Have questions or comments? Reach out to us at contact@asymco.com. We’d love to hear from you.

  4. How many Apple users are in China?

    Research · 2 comments

    Greater China.

    As previously reported, China represented 18% of net sales for Apple in the fourth quarter of 2025. This was up from 15% the year before and the third largest reporting segment. The segment grew by 37.9% year-on-year.

    It's time to understand precisely how big this market is in terms of users, iPhone install base and device install base, with an eye toward understanding the history and potential for growth.

    First, it's important to note that Apple refers to "Greater China" (GC) not just China. That means within this reporting segment are Mainland China, Taiwan, Hong Kong and Macao. The populations are approximately, 1.4 billion, 23.2 million, 7.5 million and 700k respectively.

    Second, the population of smartphone users has been growing dramatically. In 2016 there were about 690 million (GC) and in 2025 the number is about 997 million. The forecast for 2029 is 1.08 billion.

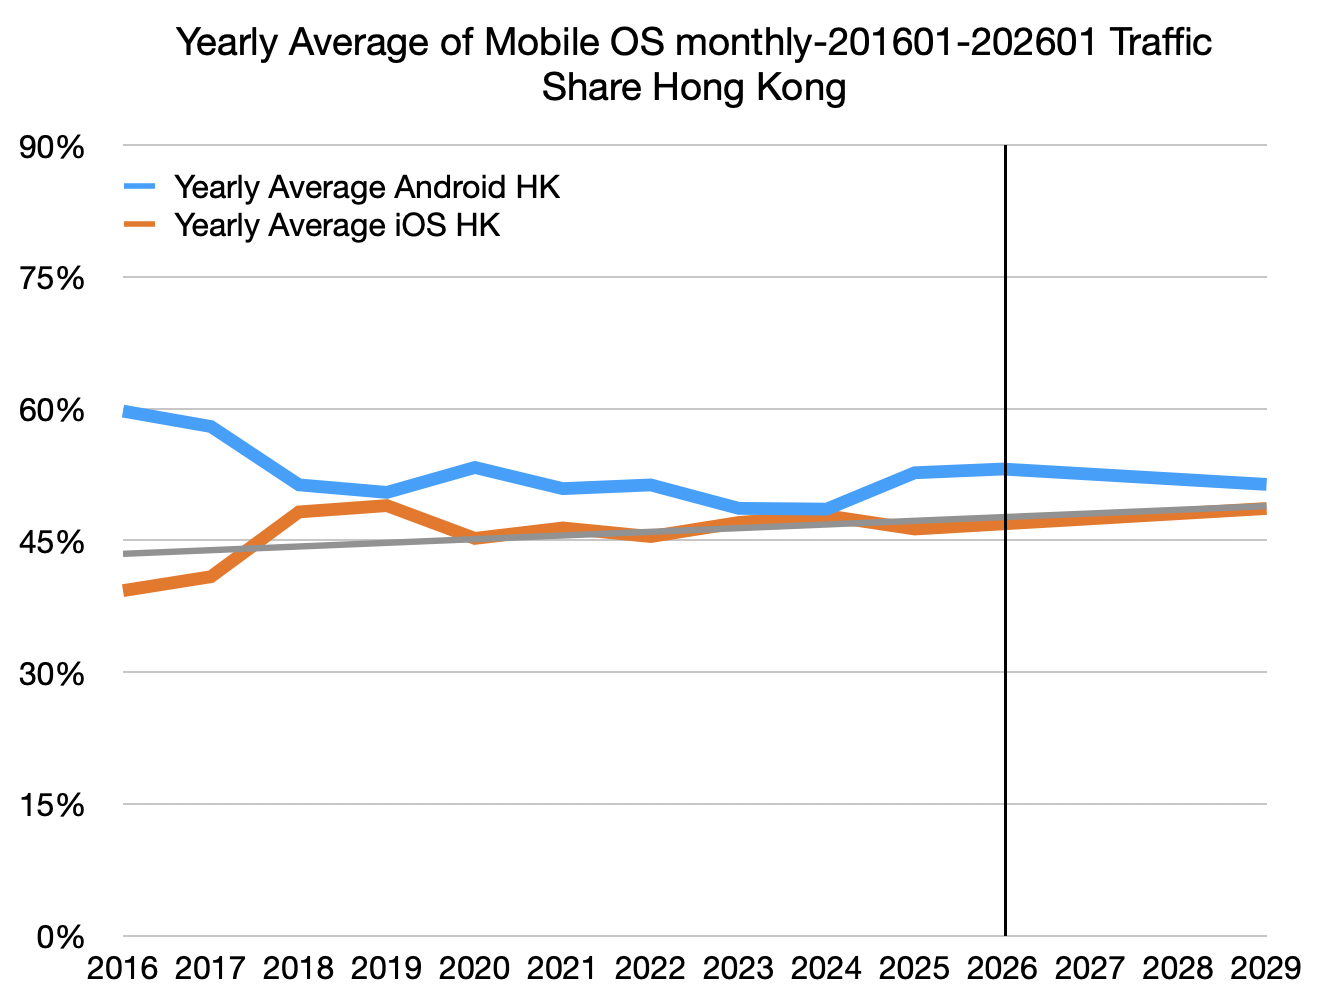
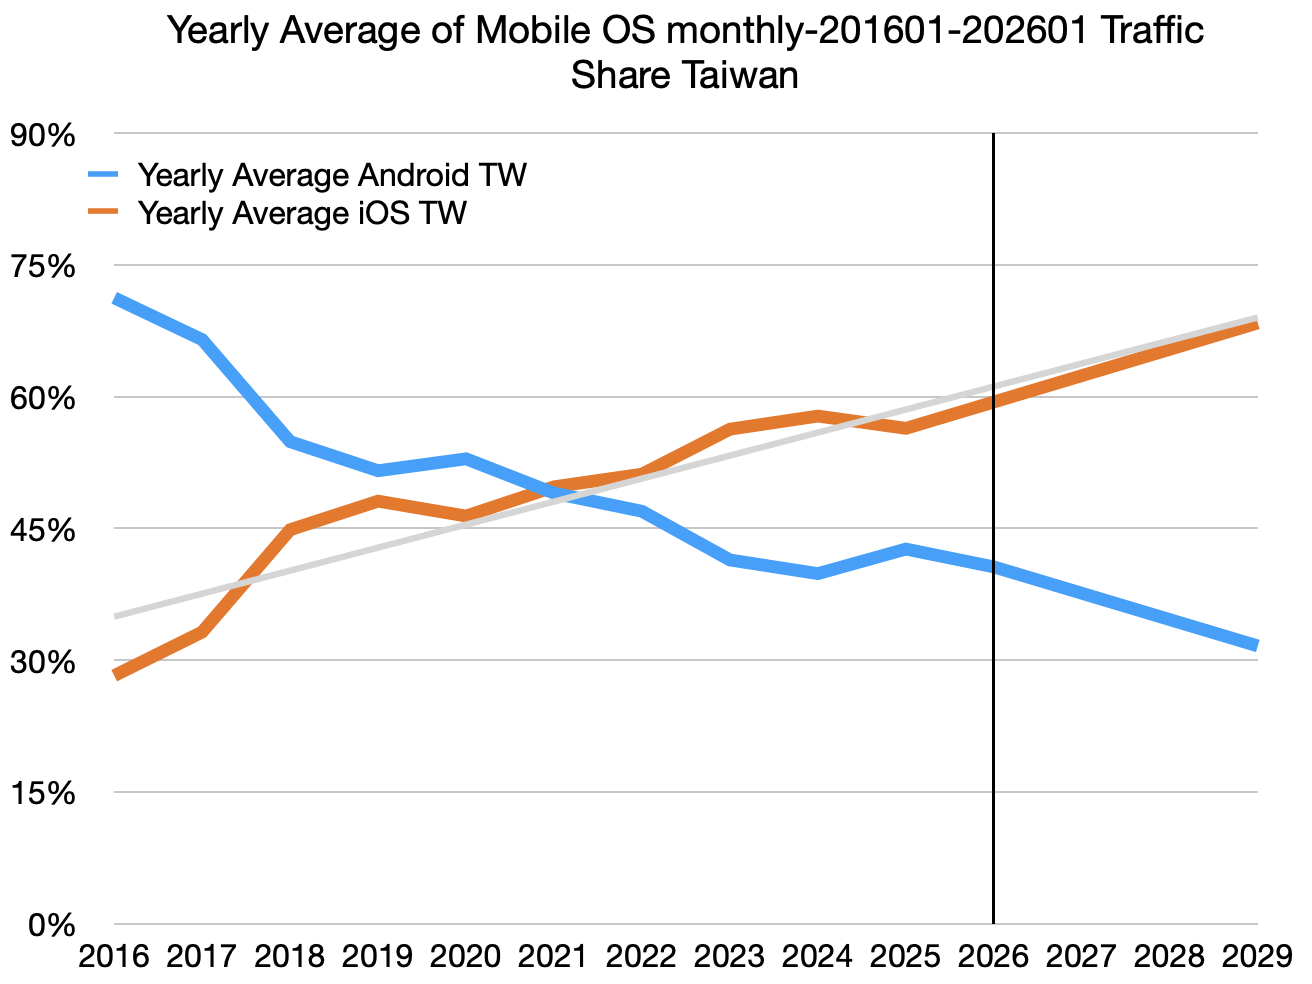
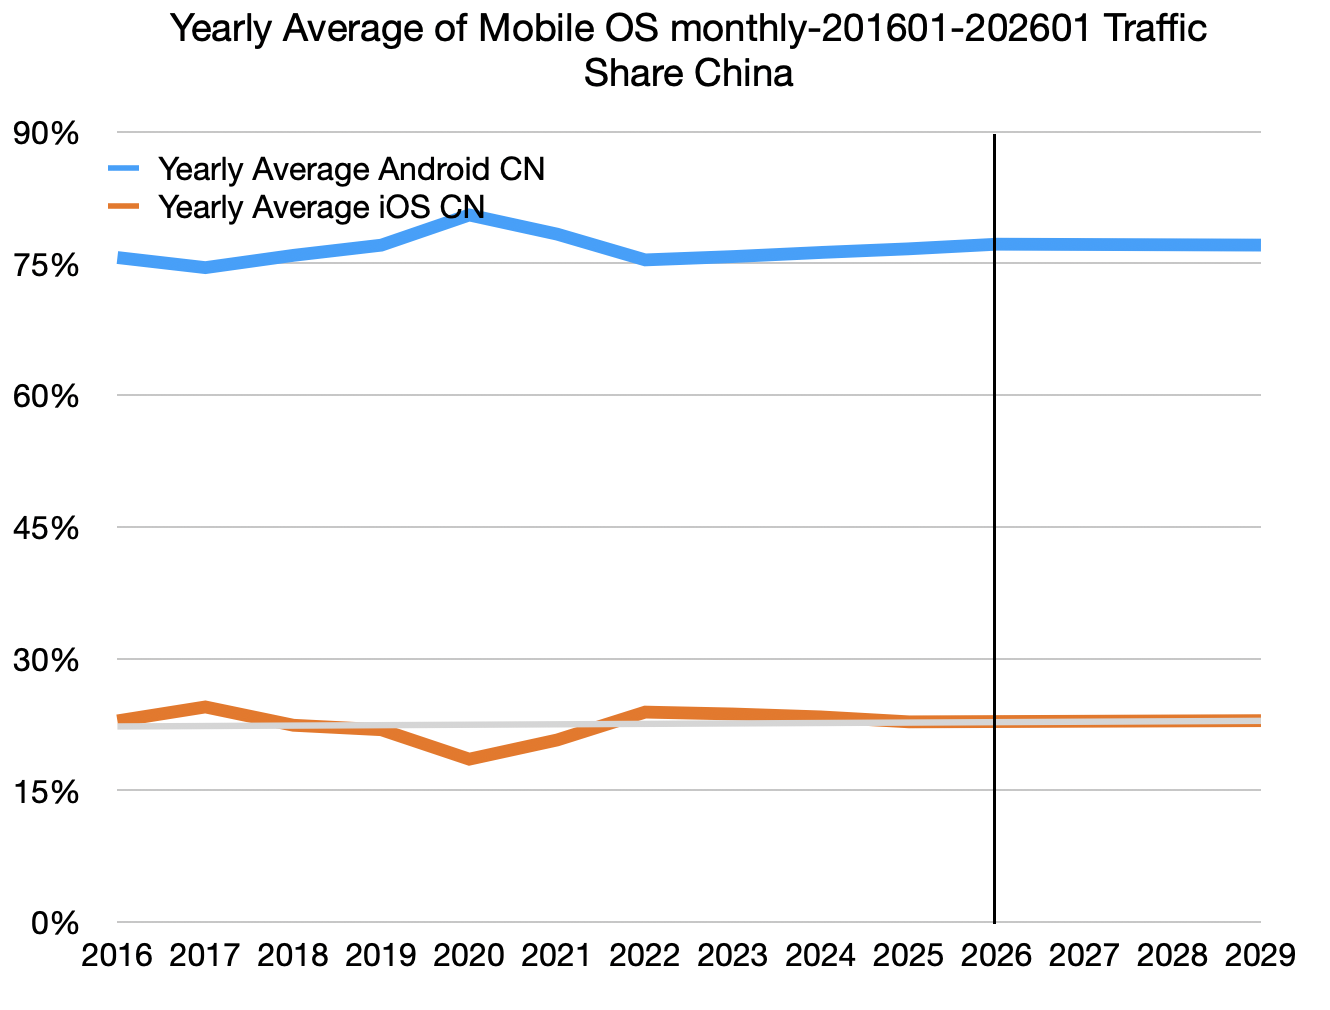
    Third, the share of iOS has been rising but at different rates in the three regions (Macao is excluded because of small relative size, but Apple is holding iOS share steady at about 60%.)

    These graphs represent the trends in Mobile OS share as collected by Statcounter and trendlines for iOS are shown with projections to 2029.

    Multiplying the share numbers by the user numbers, including projections gives the following iOS users summary.

  5. Apple’s App Store growth is reaccelerating

    Nota Bene

    Services is much more than App Store

    Apple’s App Store revenue growth is strengthening in February, with Morgan Stanley saying the latest data points to a faster pace of expansion heading into the March quarter.

    The firm’s analyst, Erik Woodring, said in a note Monday that App Store net revenue is growing 9 percent year-over-year month-to-date, which represents “a 230bps acceleration from January off a 700bps easier Y/Y compare.”

    Woodring added that quarter-to-date revenue is now rising 7.5 percent, putting it “50bps behind our +8.0% Y/Y March quarter App Store forecast.”

    The bank kept its March-quarter App Store growth and Services growth forecasts unchanged at 8 percent and 13.5 percent, respectively.

    Morgan Stanley said the acceleration is broad-based across major markets. China’s App Store is growing 4 percent year-over-year after a decline in January, while the U.S. is rising 3 percent, a 40-basis-point improvement. Japan is down 1 percent, while the rest of the world is seeing 22 percent growth.

    The analysts also cited rising Mac lead times, noting they have “quickly inflected to multi-year highs” due to demand for the on-device AI tool OpenClaw.

    They said stronger Taiwan component supplier revenue in January is another positive indicator, pointing to “very robust strength in server demand coming from the largest global cloud service providers.”

    Source: Yahoo Finance

    NB:     With new products due in a few days...

  6. Estimating 2035 iPhone Users

    Research

    Surveying multiple sources

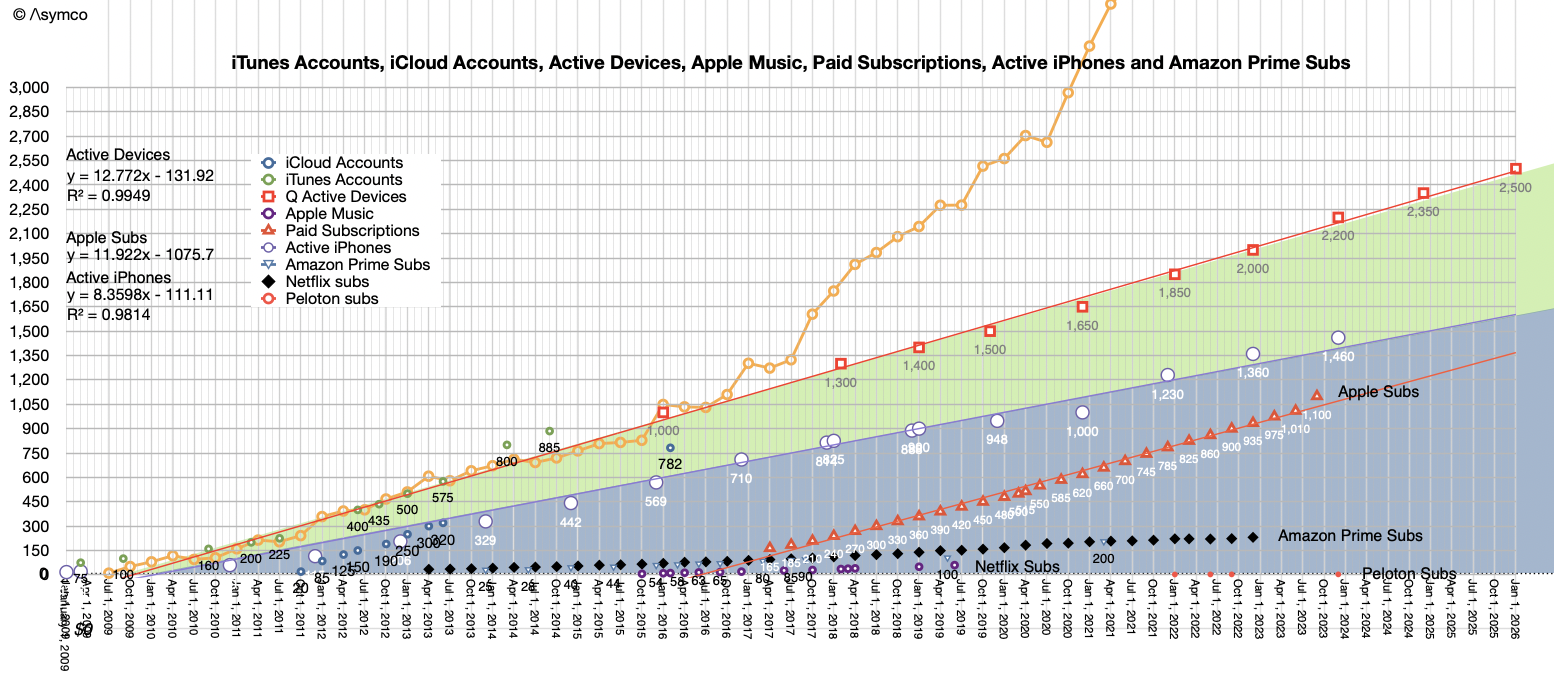
    We have a firm hold on the number of active devices as well as the number of iPhones in use. This is due to Apple reporting the data. The latest active device count was 2.5 billion and the estimate for active iPhones is 1.6 billion.

    This patters also allows us to forecast the active base pretty accurately as the growth is predicted by the tight fitting linear approximation.

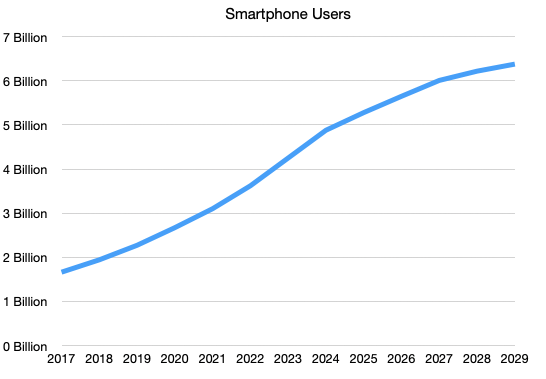
    For more confidence it would be useful to confirm these predictions with different estimates. For this I turned to two additional sources: the Statcounter GlobalStats measure of Mobile Operating System Market Shares Worldwide coupled with Number of Smartphone Users Worldwide (forecast by Ericsson) and the Number of of iPhone Users from Bankmycell.

    The total Smartphone Users history and forecast is shown below:

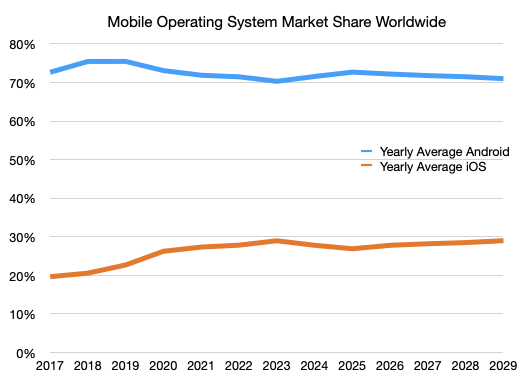
    The Mobile Operating System Market Share Worldwide is shown below:

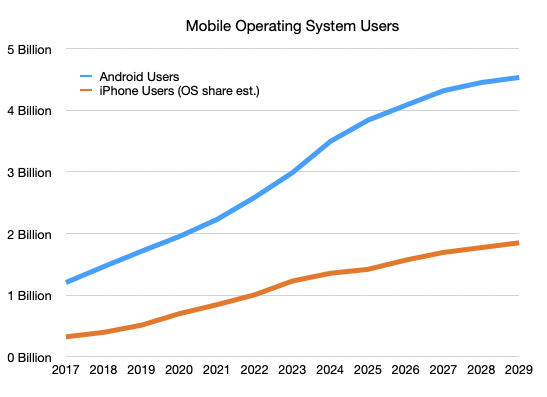
    Multiplying these two yields the Mobile Operating System Users

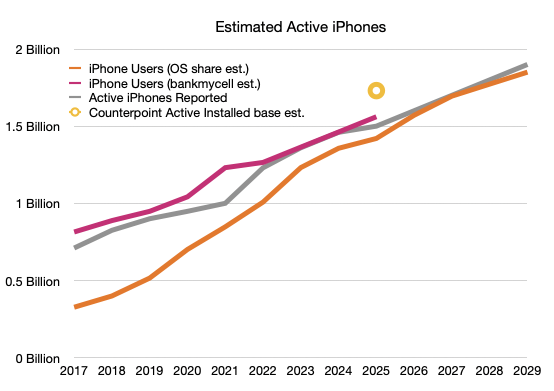
    The iOS users (orange line) can now be compared to Apple's own reported active device total (grey line) and the Bankmycell estimate as well as a derived estimate from Counterpoint (24% share of install base)

    The graph includes forecasts from 2025 to 2029.

    Discussion:

    That, coupled with value captured per customer will determine the value of the firm.

  7. Morgan Stanley resets Apple stock forecast ahead of earnings - thestreet.com

    Nota Bene

    Consensus estimates Apple to post about $138.4 billion in revenue and both GAAP and non-GAAP earnings per share (EPS) of around $2.67 for the December quarter. The numbers highlight at least an 11% year-over-year growth in EPS and revenue, but analysts are now tightening their margin forecasts despite favourable iPhone sales and AI roadmap.

    In a note, Morgan Stanley analyst Erik Woodring reiterated an Overweight rating and an unchanged price target of $315, but cautioned investors that Apple stock could “trade sideways to modestly lower after earnings.”

    The firm expects Apple to beat expectations, driven by stronger, more persistent iPhone demand. Woodring expects December-quarter revenue of about $80 billion, around 4% above consensus, and March-quarter revenue of $55.4 billion, about 8% above consensus, citing supply-chain checks and shipment data.

    He said iPhone 17’s “strength remains underappreciated by the Street.”

    Morgan Stanley sees cost assumptions as overly optimistic. The firm forecasts March-quarter operating expenses about 7% above consensus and a gross margin forecast 30 basis points below consensus, driven by rising memory costs.

    As a result, Woodring sees limited scope for positive EPS revisions for Apple, even with a revenue beat.

    Morgan Stanley also flagged potential downside risk to June quarter earnings, estimating EPS of $1.62 versus the consensus of $1.71, citing intensifying memory-related cost pressures. The firm also notes that Apple has historically underperformed the S&P 500 more in Q1 than in any other period.

    Looking ahead to 2026

    All things considered, Morgan Stanley believes Apple is positioned to outperform in 2026 as a wave of new products and AI-driven catalysts is set to shape the company’s growth trajectory. The firm particularly highlighted the relaunch of Siri in February and Apple Intelligence in June at Apple’s Worldwide Developers’ Conference (WWDC).
    Some notable introductions expected include its most “innovative iPhone in 10+ years (Foldable)“, plus the first smartphone powered by 2-nanometer chips, part of the iPhone 18 family.

    The firm sees greater benefits from share gains and higher average selling prices, with Morgan Stanley underscoring an EPS of $9.77 for FY2027, roughly 7% above Wall Street consensus.

    Read the original article →

    Our Take

    Earnings will be above consensus. All eyes will be on how margin guidance due to pressure from memory pricing. Every year it's another thing that is cause for drama. It never matters.

  8. The Joy of (new) Numbers

    Research

    In the latest, (Fiscal Q3, Calendar Q2 2025) conference call, Tim Cook made a welcome announcement: "We also recently marked a significant milestone. We shipped the 3 billionth iPhone since its launch in 2007."

    This was welcome because the company has not been providing iPhone unit shipment numbers since Q4 2018. What it has meant is that the number of iPhones sold and their average selling price had to be estimated. Active iPhones were occasionally provided but quite rarely.

    With this update, the veil has been party lifted. I, as well as you I'm sure, rushed to assess how well we have been estimating the iPhone economy over the last seven years. Prior to Tim's data dump, my own estimate for total iPhone shipments was 3.104 billion, including the last quarter. [Keep in mind that the 3 billionth iPhone may have shipped in the beginning of the quarter which amounts to more than 50 million units prior to announcement so my error of 104 million is minus perhaps 50 million.]

    In the worst case, my error amounts to about 3.4% over the entire lifespan and perhaps 5% over the estimate period. That is perhaps not criminal since, after all, what's 100 million iPhones between friends?

    I adjusted the estimated average selling price to reflect this error and shaved essentially one quarter's worth of shipments from the data set. In other words, my estimate would have been that 3 billion was reached in March rather than June. Mea culpa.

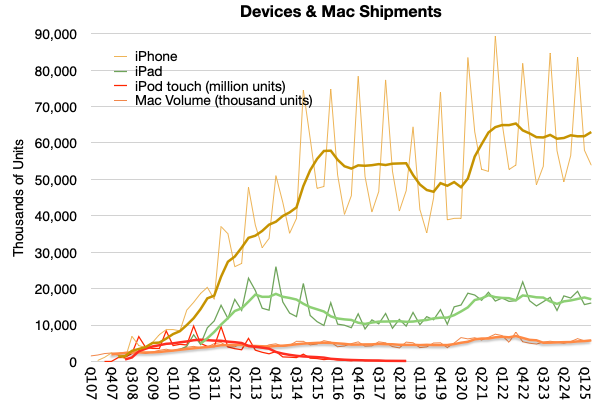
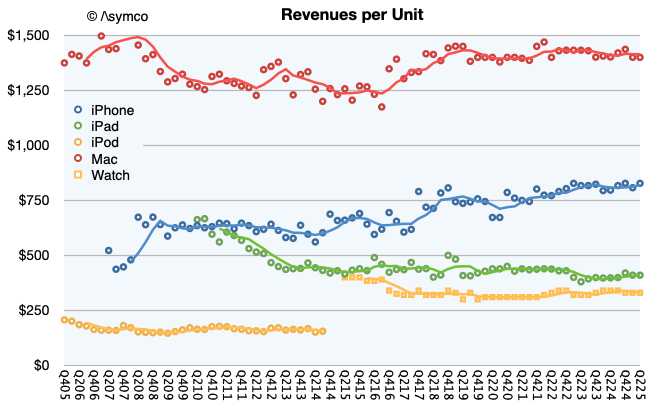
    The new view into the entire iPhone shipment history is shown below. Also below is the impact of adjustment in the revenue per unit (i.e. average selling price.)

    Note that I used trend lines to show the four-period (12 months) running average to remove the seasonality. Perhaps there is something to be read in the pattern. I would say that there are some notable surges as during the initial uptake, during the first "supercycle" in 2014, the surge during Covid and perhaps the "China recession" of 2018.

    Clearly we are not at the highest sales levels today, as the Covid surge will take some time to grow into but at the same time the volumes are not decreasing. You can see the contrast to the iPod touch when an alternative was available, namely the iPad. The demise of the iPhone has been greatly exaggerated.

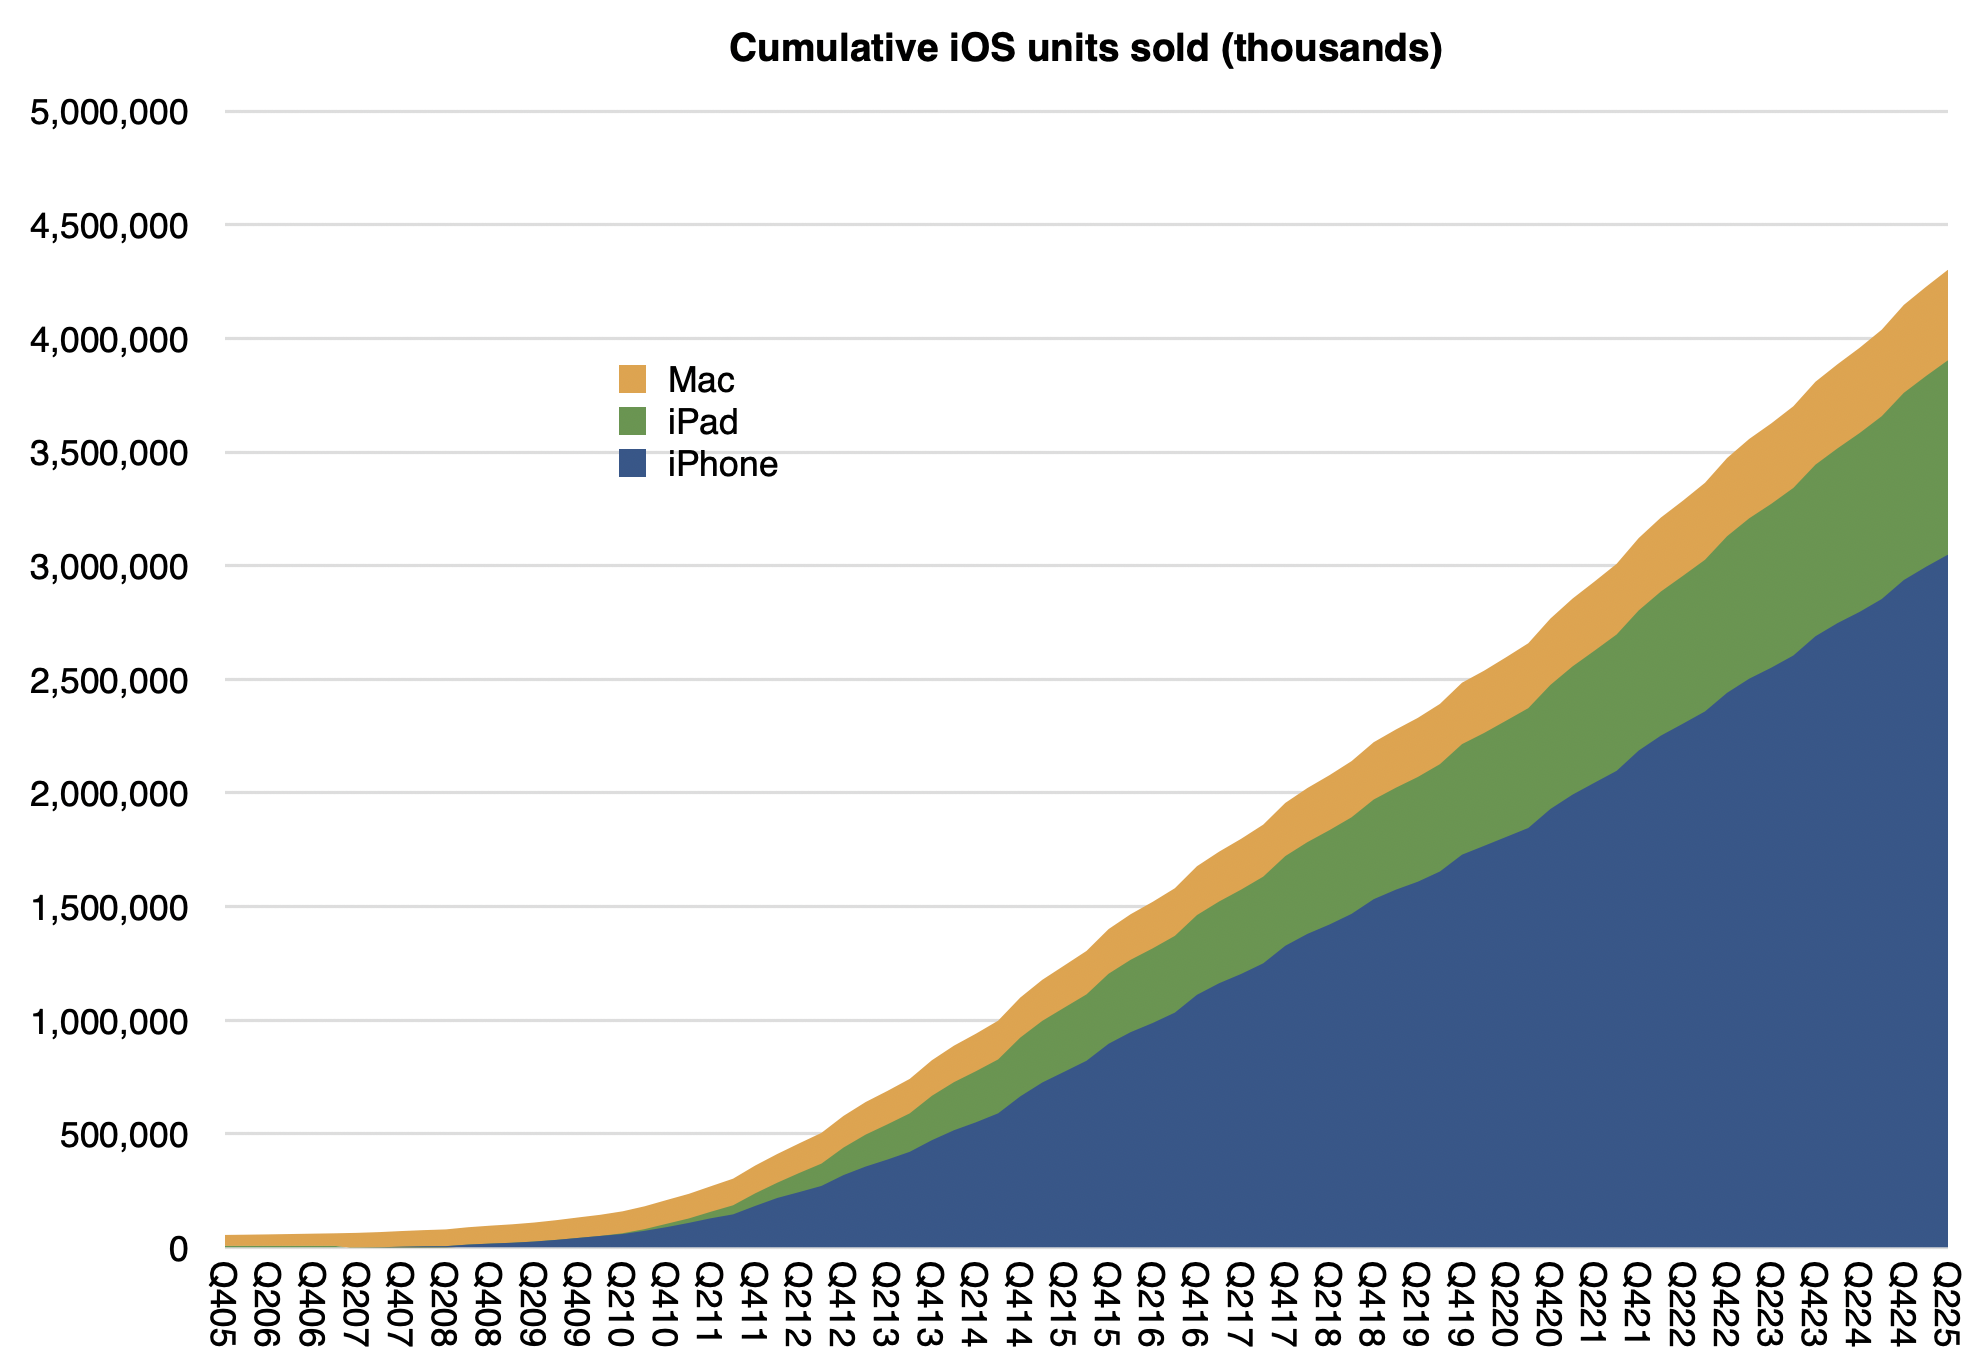
    Note also that I also included the iPad, Mac and the iPod touch for comparison. You can try your hand at reading the patterns there. For the record, my cumulative Mac estimate (since Q4 2005) is 398 million[1] and the cumulative iPad is 855 million. Here are the iPhone, iPad and Mac cumulatively with a current total of about 4.3 billion:

    Not shown are iPods (touch alone is about 114 million), Watches (probably at least 250 million) and Vision Pro (single digit millions) or wearables and home. If we did include those, it's a safe bet that Apple has shipped over 5 billion devices.

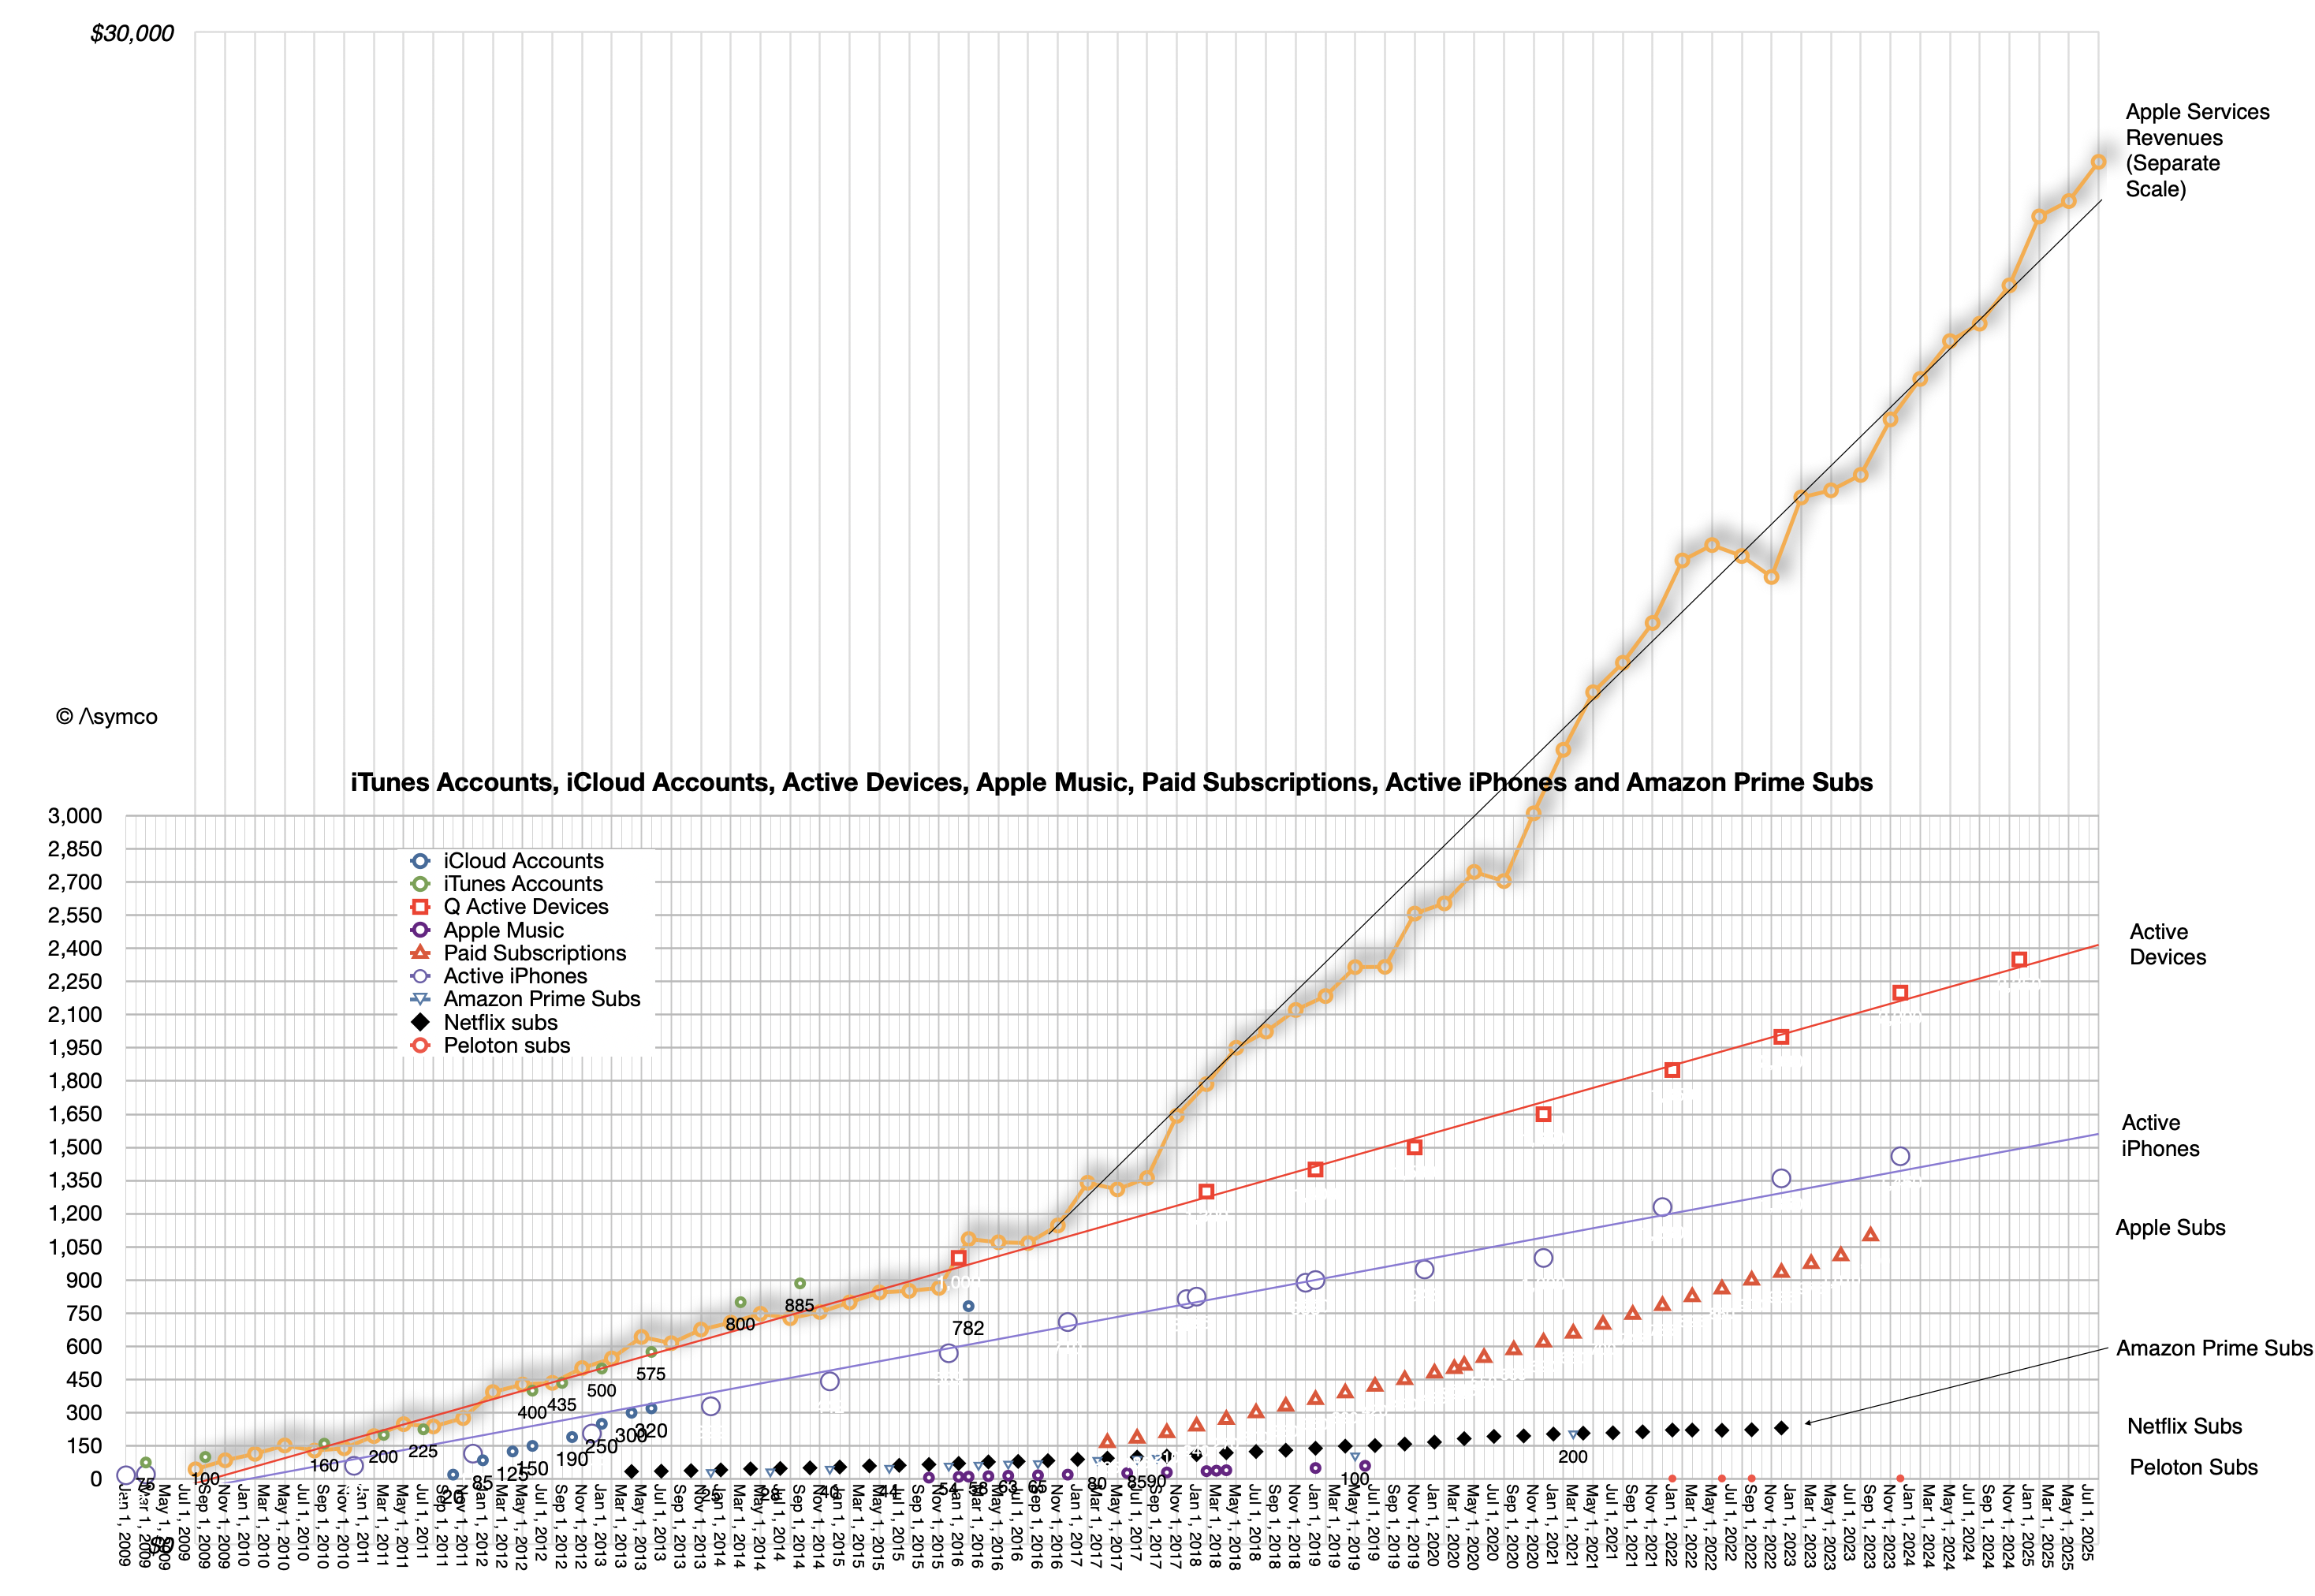
    Interesting, but not as interesting as how many are active (in use at least once a month.) For that estimate we have another set of data:

    The linear extrapolations for active devices, active iPhone and, on a separate scale, actual Apple Services revenues can be seen. Also subscriptions, as long as they were available, plus other data sets for comparison such as Amazon Prime subscriptions, Netfilx and old Apple Music and iCloud account data.

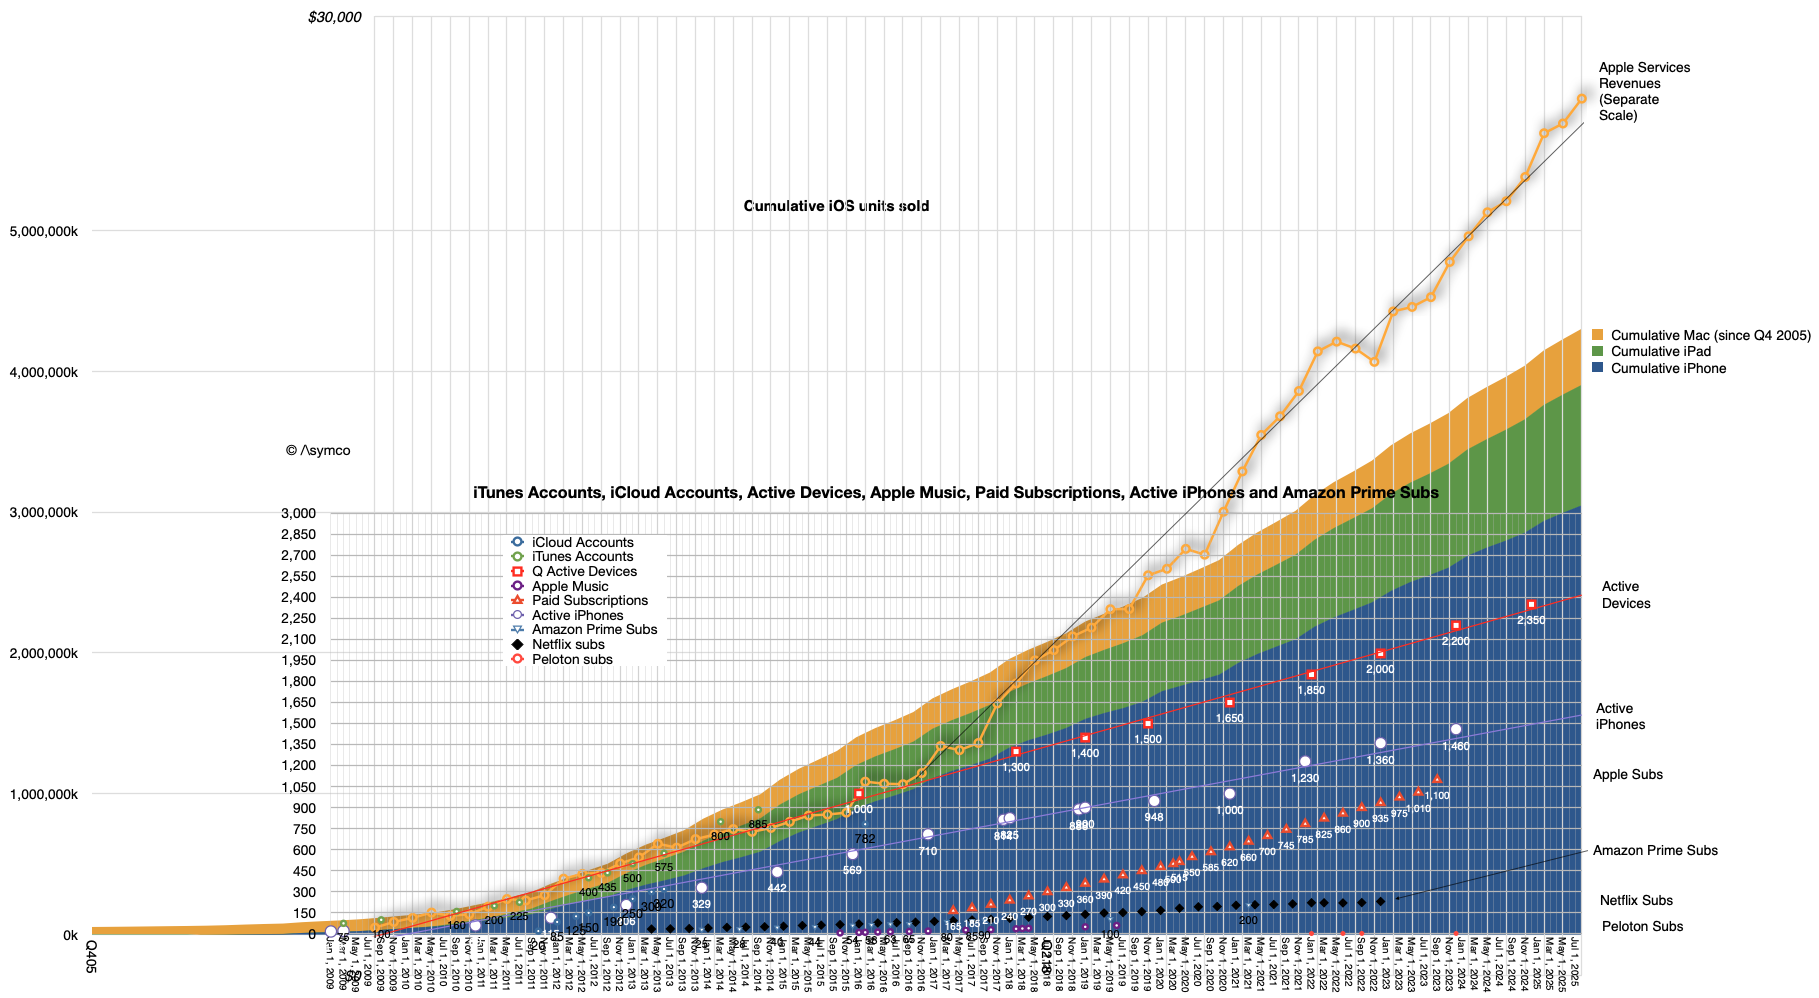
    At the risk of overloading an already busy graph, it might be interesting to show cumulative devices vs. active devices:

    The Composition of Active Devices

    The top of the area graph seems to be not too different than the top of the red dotted device line. What might be instructive is to calculate the ratio between these two: the active devices and the cumulative devices during the period from 2016 (when 1 billion active were reported) and the beginning of this year when the last figure was reported (2.35 billion active devices on Jan. 30 2025).

    Again, excluding wearables, iPod touch, Apple TV and Apple Vision Pro we have these ratios:

    DateRatio of Active devices to Cumulative iPhone, iPad and Mac sold
    Q4170.66
    Q4180.63
    Q4190.60
    Q4200.60
    Q4210.59
    Q4220.58
    Q4230.58
    Q4240.57

    What this suggests therefore is yet another way to forecast the value of Apple as an enterprise. We already know that the prediction of active devices, revenue per device and margin is sufficient to forecast the company's earnings. These all seem to be quite linear and thus predictable. Now we can add the relationship to devices sold as yet another way to calibrate or test assumptions.

    After diligently doing so, simply multiplying the results by a random number called the P/E ratio (aka "sentiment") allows you to predict the share price at any point in the future.

    Have fun.

    1. It would be interesting to consider that if, as it's been often claimed by Apple, half of Mac users and half of iPad users are new to the products, then there would be 200 million new Mac users and perhaps 400 million iPad users.
  9. Forecast for Apple's Earnings for Fiscal Fourth Quarter 2023

    Research

    As we move ahead into the September quarter, I'd like to review our outlook, which includes the types of forward-looking information that Saori referred to at the beginning of the call. We expect our September quarter year-over-year revenue performance to be similar to the June quarter, assuming that the macroeconomic outlook doesn't worsen from what we are projecting today for the current quarter. Foreign exchange will continue to be a headwind, and we expect a negative year-over-year revenue impact of over 2 percentage points.

    We expect iPhone and Services year-over-year performance to accelerate from the June quarter. Also, we expect the revenue for both Mac and iPad to decline by double digits year-over-year due to difficult compares, particularly on the Mac. For both products, we experienced supply disruptions from factory shutdowns in the June quarter a year ago and were able to fulfill significant pent-up demand in the year ago September quarter.

    We expect gross margin to be between 44% and 45%. We expect OpEx to be between $13.5 billion and $13.7 billion. We expect OI&E to be around negative $250 million, excluding any potential impact from the mark-to-market of minority investments, and our tax rate to be around 16%.

    Luca Maestri, CFO Apple Inc., Aug. 03, 2023

    In August Apple reported Net sales growth of -1% and EPS growth of 5.4%. My expectation is a 1% sales growth with EPS growth of 11.4%. This might be slightly optimistic but it's based on the following assumptions:

    • iPhone unit growth of -1.4% (y/y) but revenue growth of 2% (as per guidance, up from -2% previous quarter's growth).
    • Mac unit and revenue growth of -12% (this might be optimistic, low confidence)
    • iPad unit growth of -2% but revenue growth of -12%.
    • Services revenue growth of 12% (acceleration from 8% q/q)
    • Wearables 2% revenue growth (consistent q/q, down from 10% y/y)

    I estimate the gross margin to remain at 44.5%, open to be $13.5 billion (low-end of guidance), OI&E at -$250 million (per guidance) and tax rate at 16%.

    The number of shares I estimated at 15.666 billion (down 109 million, below 126 million average drop for last 8 quarters.)

    To summarize, for the fiscal fourth quarter 2023:

    • Total revenue: $91.1 billion
    • EPS: $1.43

    Revenue by segment:

    • iPhone: $43.5 billion
    • iPad: $6.2 billion
    • Mac: $10.0 billion
    • Services: $21.5 billion
    • Wearables/Home/Accessories: $9.8 billion
    • Gross margin on total revenue: 44.5%

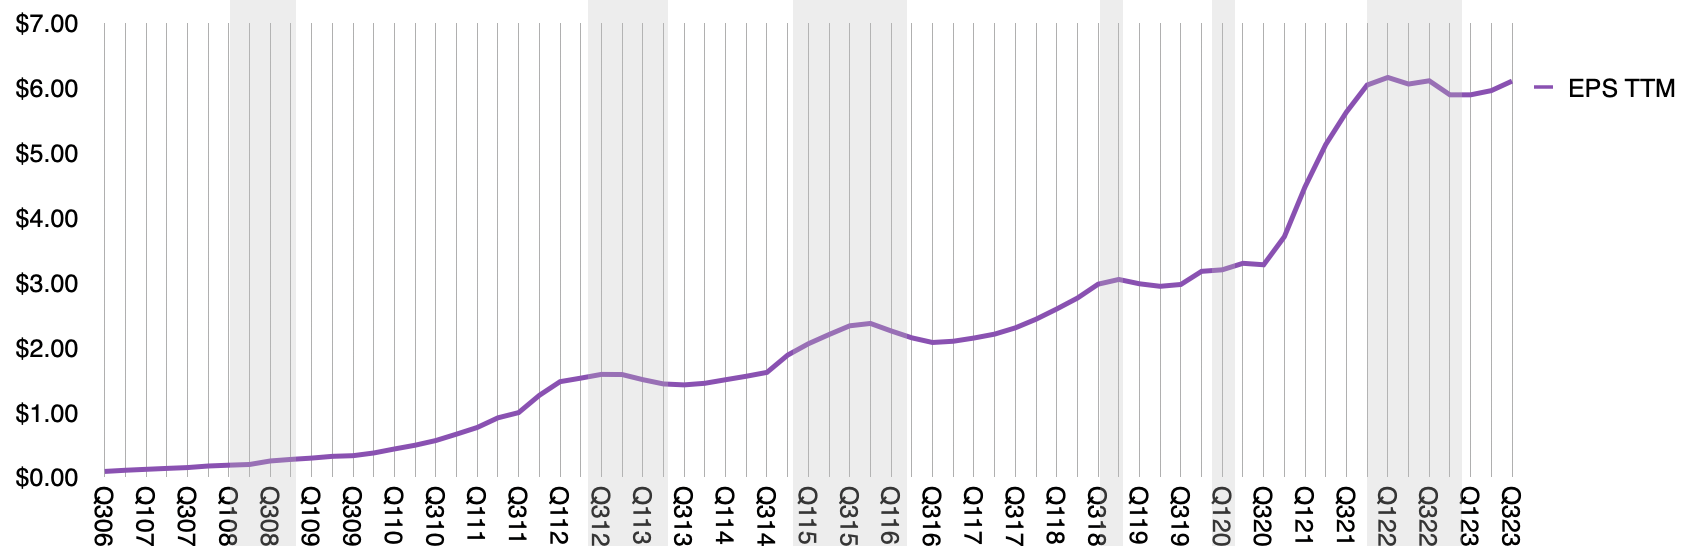
    As can be seen in the following graph, my expectation is that the company will return to a pre-Covid growth trajectory (on a TTM EPS basis) after a transient surge and recovery due to the phenomenon of work-from-home and reduced travel. The uncertainty related to Covid is subsiding but macro and geopolitical uncertainties remain and the company continues to provide limited guidance.

  10. The $2 Trillion Economy

    Research

    The App Store ecosystem crossed $1 Trillion in 2022.

    To be precise, in a report published in May 2023 by the Analysis Group the ecosystem is estimated to have exceeded $1.1 trillion. This ecosystem is defined as the total transactional value of the sale or distribution of digital and physical goods and services through apps. It also includes in-app advertising. The analysts relied on a variety of data sources, including data from Apple, app analytics companies, market research firms, and individual companies.

    Note that this includes Apple's own services as well as App Store developers. Unlike Apple's own reporting of payments to developers (and thus partially revealing its own App Store revenues) this data includes payments which are not captured by Apple directly. In the words of the authors, "More than 90% of this figure originated from transactions that did not happen through the App Store, meaning that these amounts accrued solely to developers and other third parties, and that Apple collected no commission on them."

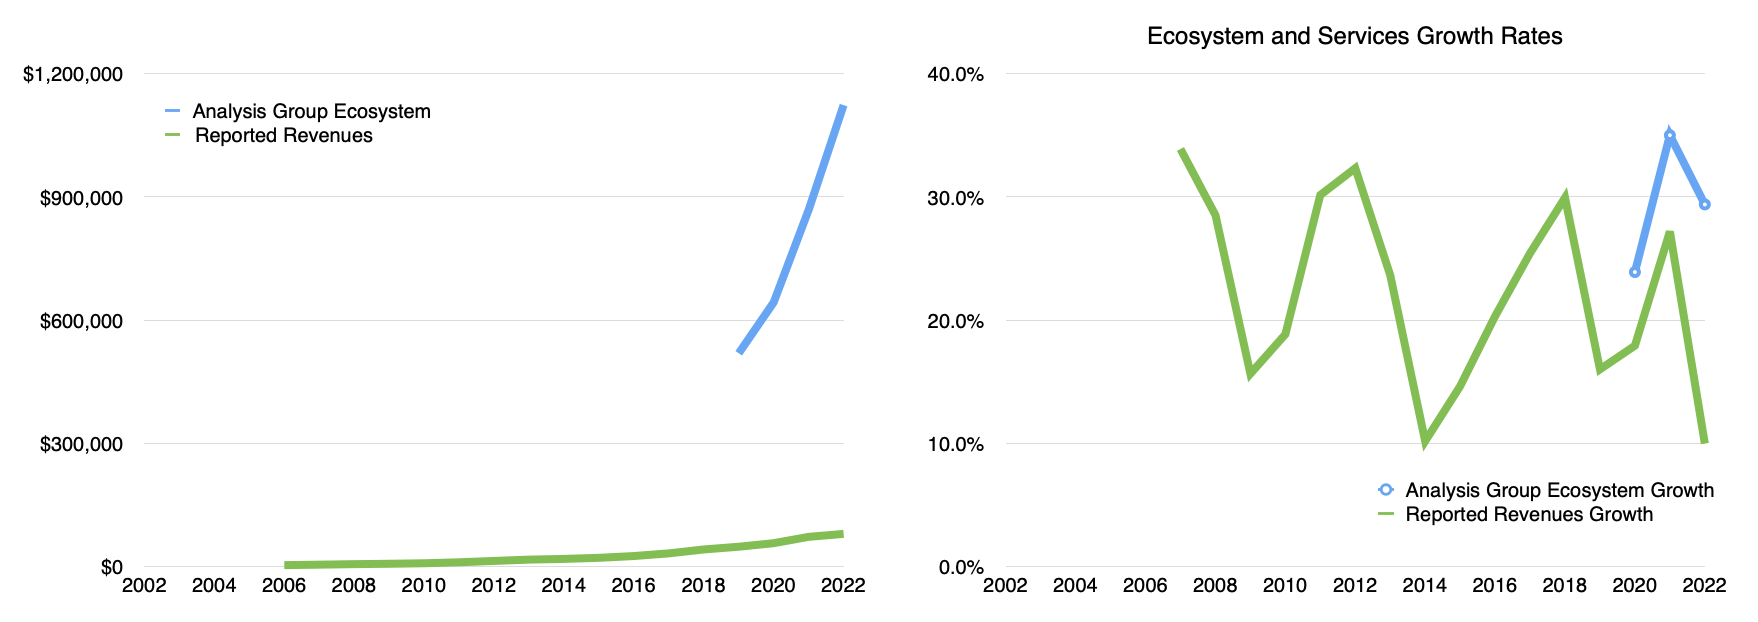
    This $1.1 trillion figure is almost double the value from 2019. Ecosystem estimates were first provided in 2019 at $519 billion, with $643 billion in 2020, $868 billion in 2021 and $1,123 billion in 2023. These correspond to growth rates of 24% in 2020, 35% in 2021 and 29% in 2022. The compound growth rate has been 29.4% since 2019.

    It would be ambitious to expect this CAGR to continue after the Covid boom but at the same time, it's worth noting that this growth out-paces Apple's own services growth rate. Services (reported) revenues grew at 18%, 27% and 10%. The actual figures and growth rates are shown below.

    This Analysis Group report is very much worth reading and adds an important new metric of resilience and scope and scale of the platform and ecosystem that Apple has created.

    However it is also not the complete picture. I strive to see the larger picture of what I call the Apple Economy. This includes the ecosystem as well as the direct revenues Apple obtains from products and services. [Of these revenues, roughly 60% is then passed on to Apple's suppliers, with less than 20% retained as earnings].

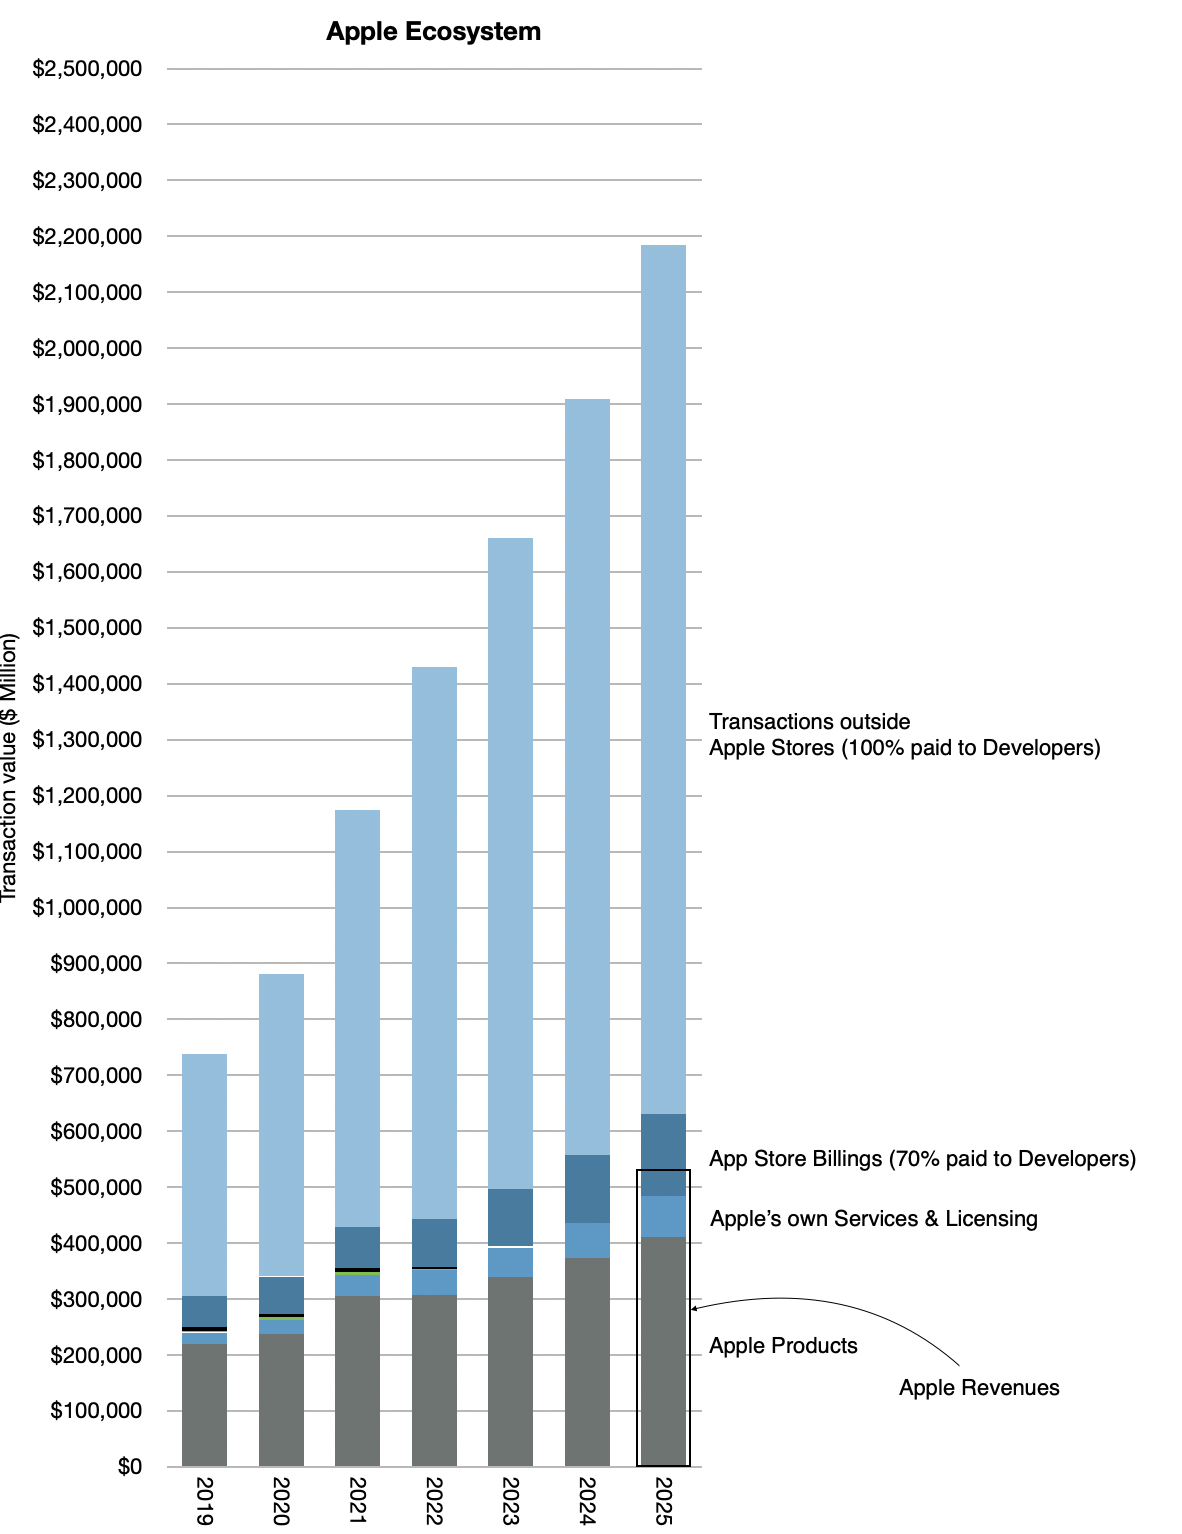
    Therefore, the combination of ecosystem and revenues is shown in the following diagram.

    Note that the "Economy" size was over $1.4 trillion when the ecosystem alone was $1.1 trillion. Note also that I'm also suggesting that it's likely to be $1.6 Trillion this year. This diagram shows the story since 2019 but also makes a forecast to 2025.

    I'm expecting the ecosystem to grow more modestly at 18% in 2023 (down from 29%) and 16% in 2024 and 15% in 2025. Apple's own product and services sales are also subject to estimation error.

    Nevertheless, it's not unreasonable to believe the forecast above where the Apple Economy expands to over $2 Trillion by 2025. This is an acceleration from previous forecasts.

    It's difficult to write about the implications of this. Any value in the trillions is hard to put in context. Certainly, Apple's market capitalization is in the trillions. For fun, we can calculate that Apple is trading at a multiple of 1.74 of its economy.

    But rather than trying to assess valuation directly, Apple's Economy is more like a GDP figure: I think it's helps to understand the overall scale and resilience. You might even ask what would happen if it were to cease to exist. The number of people who are employed in a $2 trillion economy is in the millions; perhaps 10s of millions of people.

    In 2023, global GDP is expected to reach $105 trillion. It's nice to think that Apple could soon be about 2% of the world.

  11. Preview of the holiday quarter

    Research · 6 comments

    Every October, at the end of its fiscal year, Apple files its Form 10K or annual report. In this report the company includes a section titled "Capital Assets" which details expenditures for capital equipment. This is last year's entry:

    The Company’s capital expenditures were $14.9 billion during 2017. The Company anticipates utilizing approximately $16.0 billion for capital expenditures during 2018, which includes product tooling and manufacturing process equipment; data centers; corporate facilities and infrastructure, including information systems hardware, software and enhancements; and retail store facilities.

    Note that there are categories of spending detailed and that their order might indicate the degree of such spending, suggesting that product tooling and manufacturing equipment is likely to be the costliest category.

    After this report, during subsequent quarters the company may update this forecast of spending. In the last (third fiscal) quarter the entry was as follows:

    The Company’s capital expenditures were $11.1 billion during the first nine months of 2018 . The Company anticipates utilizing approximately $17.0 billion for capital expenditures during 2018, which includes product tooling and manufacturing process equipment; data centers; corporate facilities and infrastructure, including information systems hardware, software and enhancements; and retail store facilities.

    Note that the forecast of $16.0 billion was updated to $17.0 billion and the first 9 months' expenditures were $11.1. Since there is only one quarter remaining ((and since at the time the quarterly report is filed, only about 2 months remain in the quarter)) it's reasonable to assume that the company's forecasts are more likely to be precise and that therefore the difference between total expected spending and already spent, i.e.f $5.9 billion remains to be spent.

    The actual spending is not recorded quarterly but an approximate value is reported in the Cash Flow statement as "Payments for acquisition of property, plant and equipment". That can be tracked but it does not equal exactly the capital expenditure. For example, the quote above says expenditures were $11.1 billion through first 9 months but the total of all payments for acquisition of PP&E is $10.272 billion.

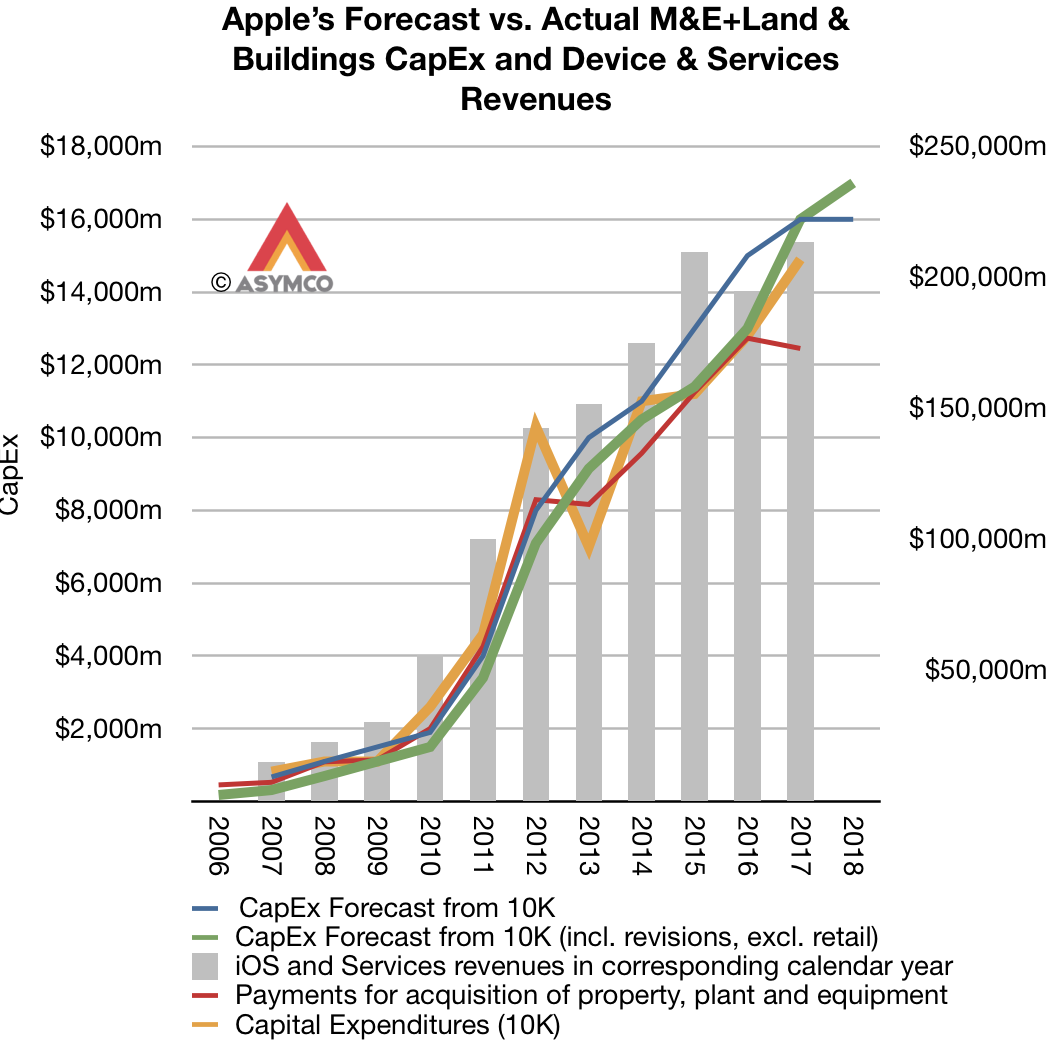
    Minor ((To the extent that $1 billion can be considered minor)) differences, aside, this forecast and actual spending and payments data is significant because it is highly correlated to Apple's overall business. Assuming that the spending on manufacturing equipment and information systems hardware (i.e. data centers) is in support of the iOS device sales and services we can try to show how sales correspond to spending with the following graph:

    Here sales are shown as a bar graph and the various spending forecasts and actual payments are shown as lines. Also note that the spending and sales are offset by one quarter. The fiscal year is used for spending and the calendar year for sales. The reason is that spending is presumed to lead sales by approximately one quarter.

    There are some notable discrepancies, especially with the 2012/2013 period when spending was brought forward a quarter thus showing a surplus to forecast in 2012 and a deficit in 2013. But apart from that, there is a broad correlation between spending and sales.

    This means that the CapEx forecast in October is a good indicator of sales in the following year.

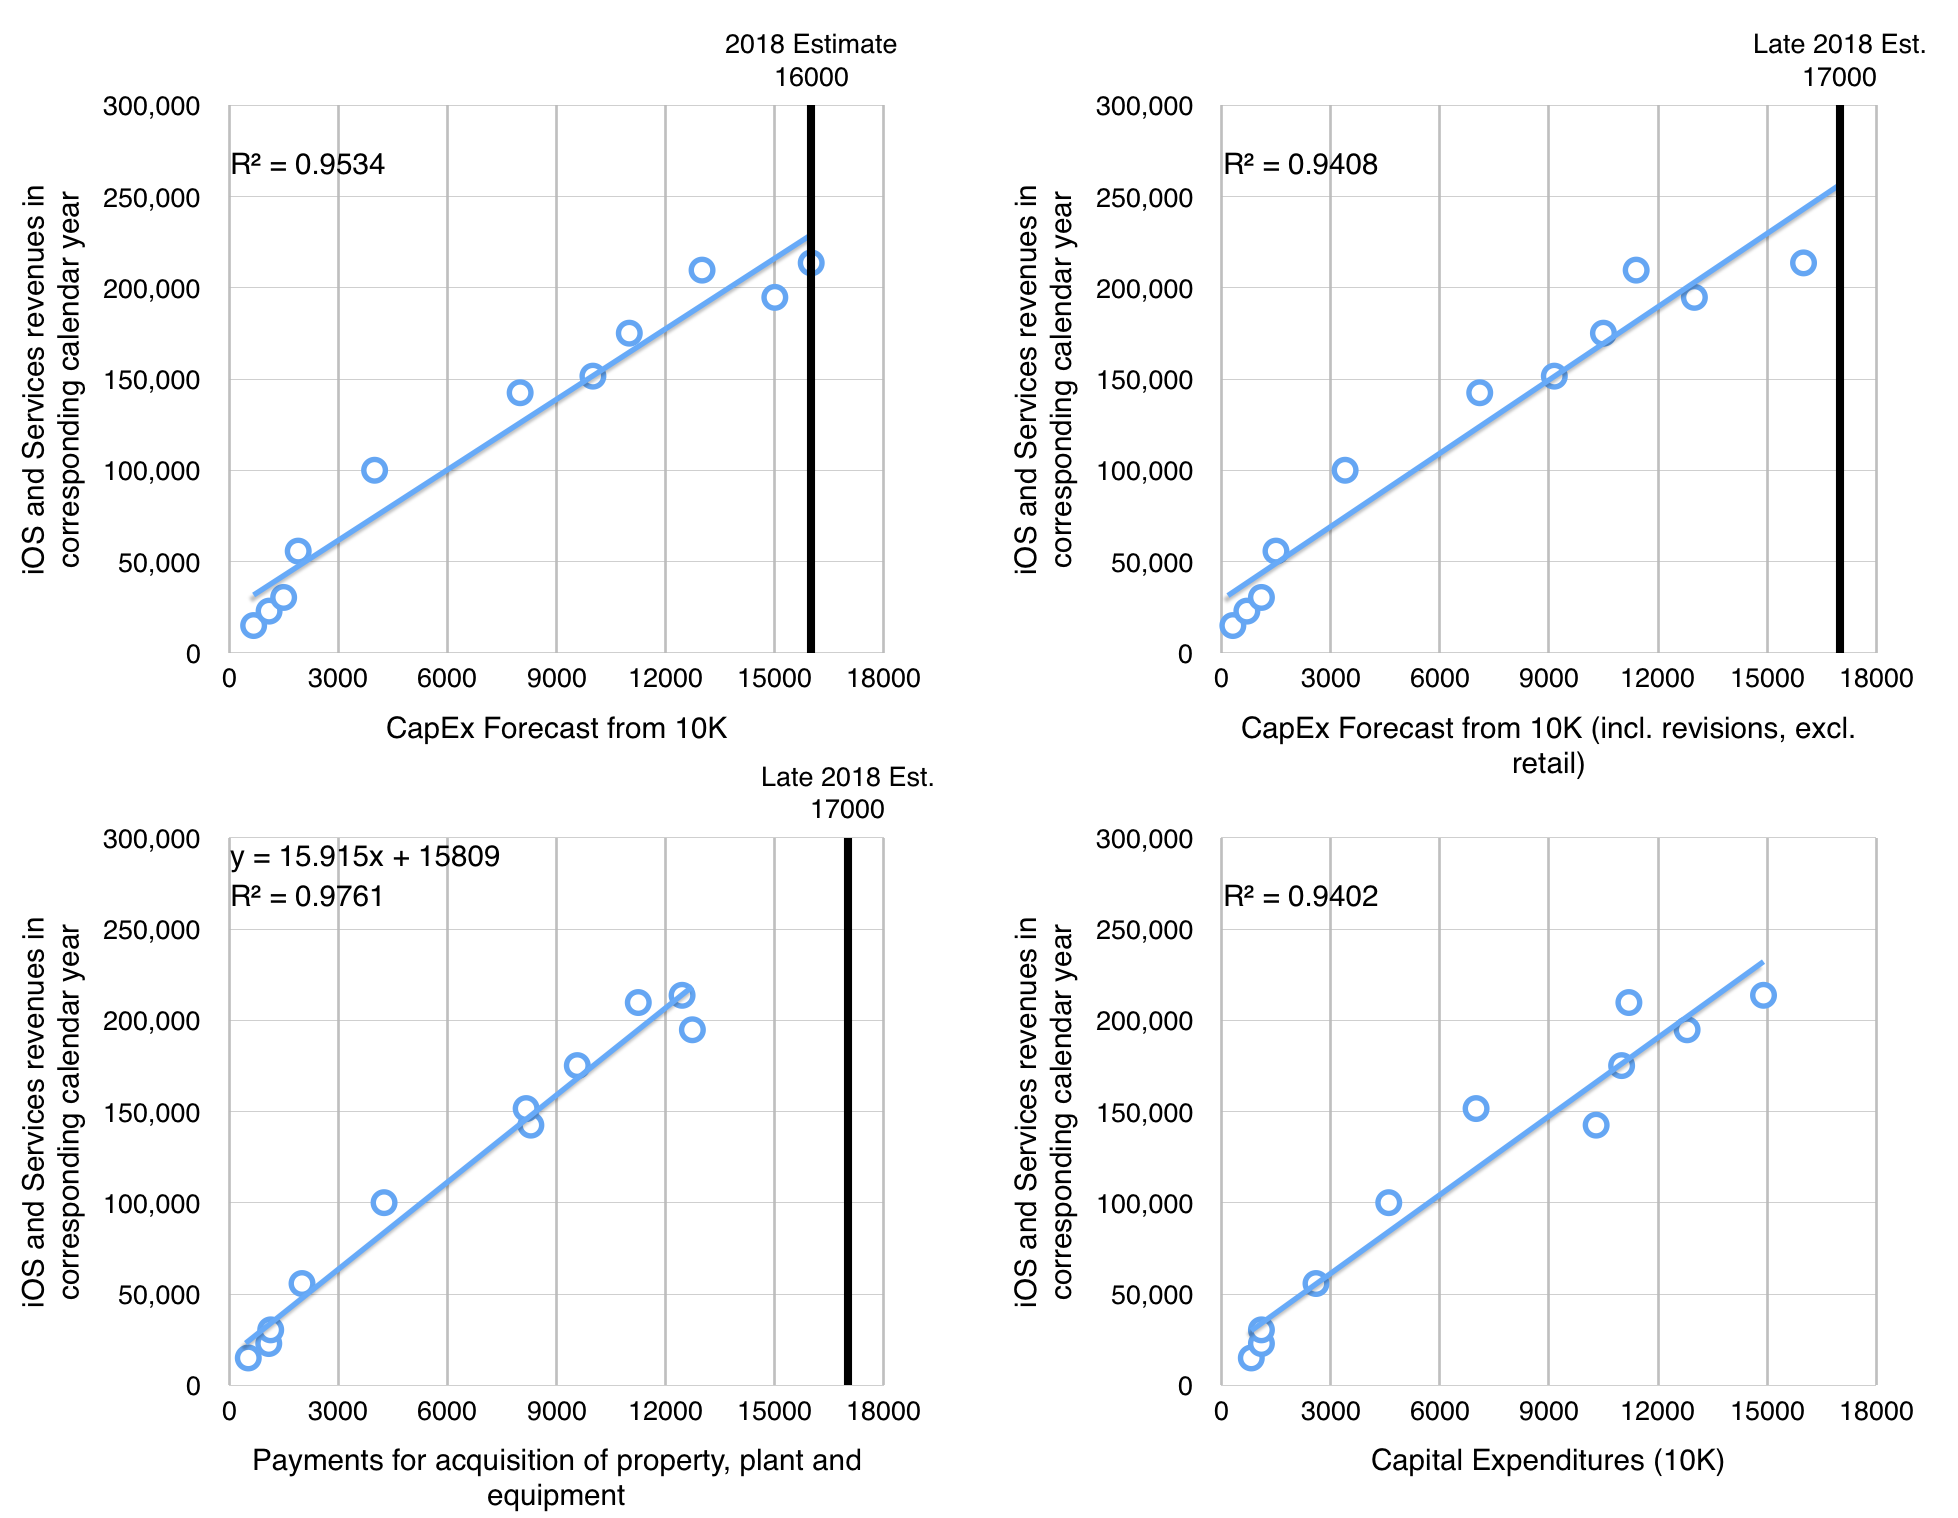
    In fact, the relationship is can be shown with four scatter plots, one for each of the published figure:

    I caution that this is a yearly forecast and it is revised through the year on a quarterly basis, sometimes up, sometimes down. It's therefore not a perfect indicator and of course the relationship between sales and spending is not perfectly predictable. Note that there are four types of spending that can be measured, two are forecasts (one year and revised) and two are actuals (cash flow payments and reported total expenditures)

    We can measure the best variable that fits the sales data through the coefficient of determination or R-squared. The best fit seems to be with Payments for acquisition of property, plant and equipment (R-squared of 0.976).

    This gives the formula for yearly sales as 15.915x + 15809 where x is the expected total spending. That spending to date has been $10.272 billion and it's probably going to exceed $16 billion for the year.

    Using $16 billion spending total, we can calculate iOS products and services for calendar 2018 of $270.45 billion.

    iOS and Services sales to date have been $103.2 billion with an estimate for next quarter of about 54.3 billion (based on guidance) and thus a total through Q3 of $157.5 billion. Subtracting this from the $270.45 billion expectation from the calculation above gives a fourth calendar quarter iOS revenue of $113 billion.

    Adding $7 billion for the Mac results in a total net sales of 120billion. This therefore is what I'd put forward as a reasonable target for CQ4.

    Note that this is equivalent to a growth of 36% from the 2017 fourth quarter.

    [UPDATE: Original version used total sales rather than iOS related products and services (i.e. excluding Mac). The text has been edited to reflect the correct figures.]