The Omdia research group says Mac sales grew 10.7% year-over-year in the first quarter of 2026, while the IDC research system says the growth was 9.1%. Now Gartner says Mac sales grew 12.7% year-over-year.
This research group says Apple sold approximately 6.7 million Macs in the first quarter of 2026 for 10.6% global market share. That compares to sales of 5.9 million Macs and 9.8% market share in the first quarter of 2025.
Apple remains in fourth place among worldwide PC vendors. Ahead of it are Lenovo (26.5% market share), HP (19.3% market share), and Dell (10.6% market share). Note that none of the research groups count tablets, even the iPad Pro, as PCs.
“Apple grew 12.7% year-over-year, which was the largest jump among the major vendors and resulted in a 0.8% increase in market share,” said Rishi Padhi, research principal at Gartner. “This performance was primarily driven by robust demand for the MacBook Neo, particularly among new Mac users and buyers in the education sector. This strategic positioning enabled Apple to attract cost-conscious consumers seeking high-performance devices, further solidifying its competitive advantage in the segment.”
Worldwide PC shipments totaled 62.8 million units in the first quarter of 2026, a 4% increase from the first quarter of 2025, according to preliminary results by Gartner, Inc.
In the fourth quarter of 2013, mobile phone sales in mature regions fell due to weaker demand."Mature markets face limited growth potentialis the markets are saturated with smartphone sales, leaving little room for growth with declining feature phone market and a longer replacement cycle," said Anshul Gupta, principal research analyst at Gartner. "Lack of compelling hardware innovation has further exacerbated replacement cycles for high-end smartphones in 2013 because consumers don't find enough reasons to upgrade." - Gartner
Anshul Gupta's assertion of market saturation was not the first. IDC also cited "a number of mature markets nearing smartphone saturation" in late 2013.
Shortchanging the smartphone market is nothing new. It was happening very early in the market's formation when initial growth was not as rapid as expected. I recall Nokia managers disappointed with sales growth losing faith in smartphones in 2004. Eleven years later, the market is still growing.
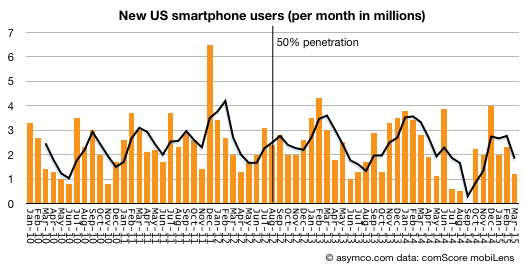
comScore reported that during the first quarter of 2015 the US market was adding over two million new smartphone users every month. These are not two million units sold every month but two million new users who began using smartphones for the first time ever, every month.
Since the end of 2013 when both IDC and Gartner declared the onset of saturation in "mature regions" ((The US is the most mature by penetration data)) 31.5 million new-to-smartphones Americans adopted the product. That's an addition of 11% of the sampled market.
And the sampled market is just a subset of the addressable market. comScore only counts 'primary phones' in use and excludes company-purchased devices and any users below age 13.
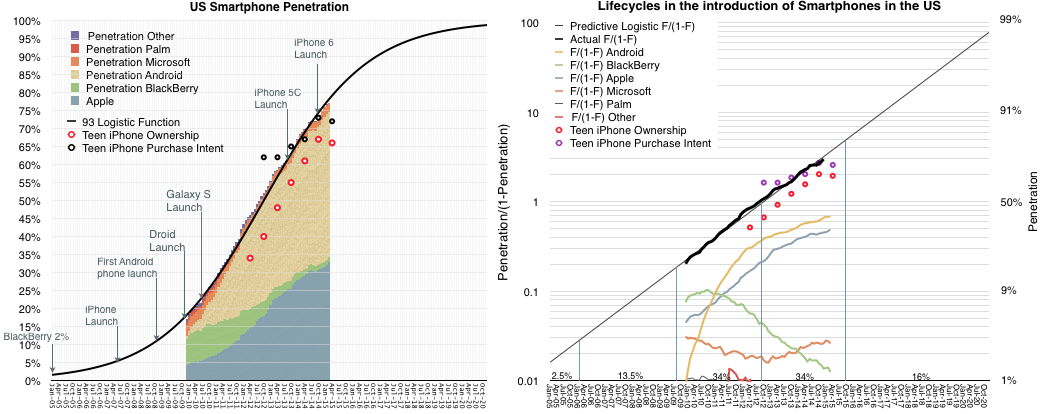
So according to comScore's data, the US market is at 77% smartphone usage. My assumption is that saturation would come at the earliest at 90% and could be 100%. ((Of the market comScore measures)) The fact that conversion to smartphones is still proceeding at roughly the same rate it has been for five years, makes this assumption pretty safe.
The pattern of growth fits a diffusion S curve (Logistic curve) as closely as ever:
Note that the curve continues to rise even into 2020, and that this is the US only.
The US is the most highly penetrated market but it's not the biggest. That would be China. So it's not surprising that two years after declaring US growth was over, IDC claims "China's smartphone market has reached saturation".
Chinese penetration is far below the US. It was estimated at 43% by the end of 2014. If we assume Chinese users are no less hungry for information than US consumers, then why should Chinese stop adopting the technology at less than half of US levels of use?
That would be risky.
This understanding of the maximum potential of a market — its highest level of user adoption — is crucial for product development. Paying attention to short term sales trends blinds you to the power of the job your product is hired to do. Your product's purpose is not to be sold, but to be hired. If your product is powerful enough, it can be hired for universal jobs and it should be desired by all consumers, not just the fickle.
Being patient for growth means that you can release features when the majority of users can absorb them, not just when early adopters choose to play with them. Often, early adopters offer feedback which is off-putting to later, mainstream adopters. In engineering and design one has to always make compromises. The right balance at the right time avoids overshooting a market or under-performing against competitors.
There are plenty of examples of getting it wrong (see the graph on the right above).
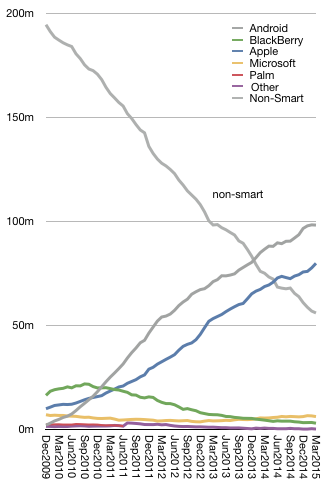
At this stage in the US market, the iPhone has more than 80 million (sampled) users. Android has about 100 million. It's still a growing market so apart from BlackBerry, ((Three million BlackBerry users in the US remain.)) the churn between the smartphone platforms is still minimal. The two main platforms are still harvesting non-consumers.
This will change of course. And when it does, the competition will shift from winning against non-consumption to winning against other-consumption or over-consumption. That post-saturation competition will be decided by brand loyalty as much as anything else.
---
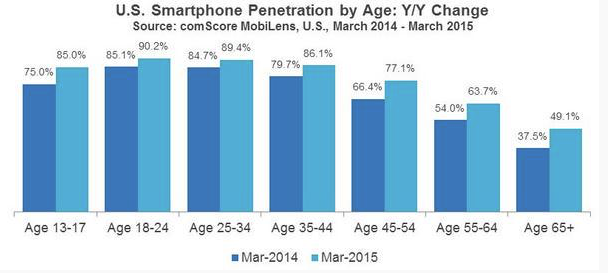
Update: comScore just published US Smartphone penetration by Age which offers some clues where smartphone hiring is still going on. (Note: <13 ages are not shown).
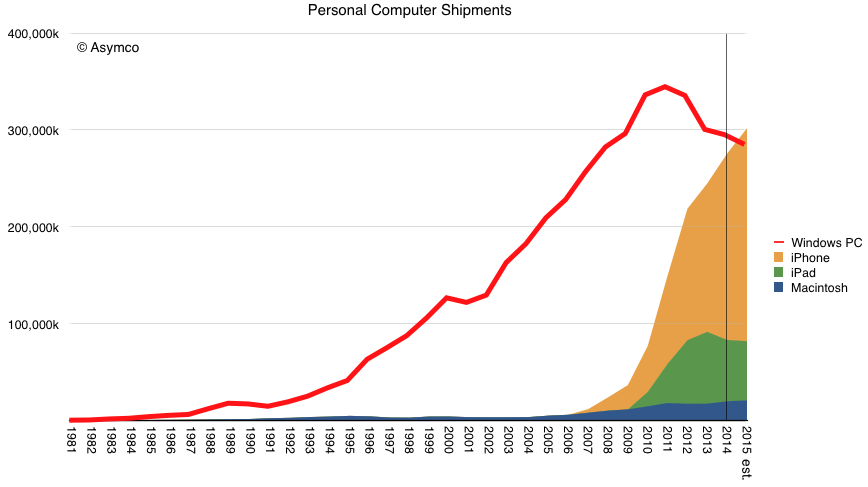
The history of the Personal Computer market (since 1981) is shown below:
Note that I added a forecast for 2015. Data from Gartner shows Windows PCs declining at a 6% rate in Q1 with a full-year forecast of -2.4% (including OS X). Assuming 20.7 million Macs, the Windows PC market will decline to 285.6 million units (from 295 million in 2014). My estimate is that iOS and OS X combined shipments will total about 302 million.
If this rather conservative forecast is correct then in 2015 Apple will ship more iOS and OS X computers than all Windows PCs combined ((This excludes iPod touch, Apple TV and Apple Watch. PC data is from public Gartner press releases.)) .
Gartner's own press release has an interesting spin:
"After Two Years of Decline, Worldwide PC Shipments Experienced Flat Growth in Second Quarter of 2014, According to Gartner"
Gartner's actual figure is 0.1% growth. Gartner and IDC measure slightly different quantities as "PC" but they don't disagree much. IDC still shows declining PC sales at about -1.7%. However both also include the Mac in their accounting of PC. If we were to remove the Mac and measure "Windows PC" ((In quotes because this total includes Linux and Chromebook)) Gartner's figures would show -0.8% drop in PC ex-Mac shipments.
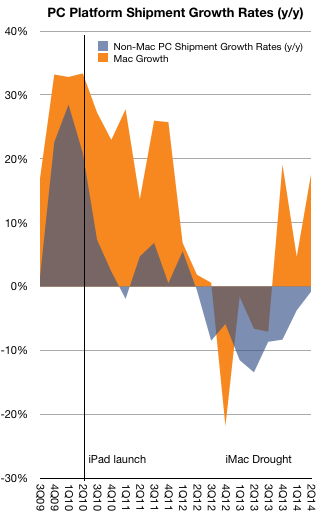
The difference in growth between the Mac and non-Mac PCs is shown in the following graph.
As Apple puts it, the Mac grew faster (and hence gained share) for 31 out of the last 32 quarters. It missed on this perfect record during the fourth quarter of 2012 when the then fresh new iMac was impossible to buy due to production issues.
So as far as the Mac is concerned the slowing of the decline in PC unit shipments isn't at its expense. What has been discussed as a cause for the moderation of market contraction is the expiration of Windows XP support. Certainly that seems plausible and is supported anecdotally. If it's true then the PC respite may be transient.
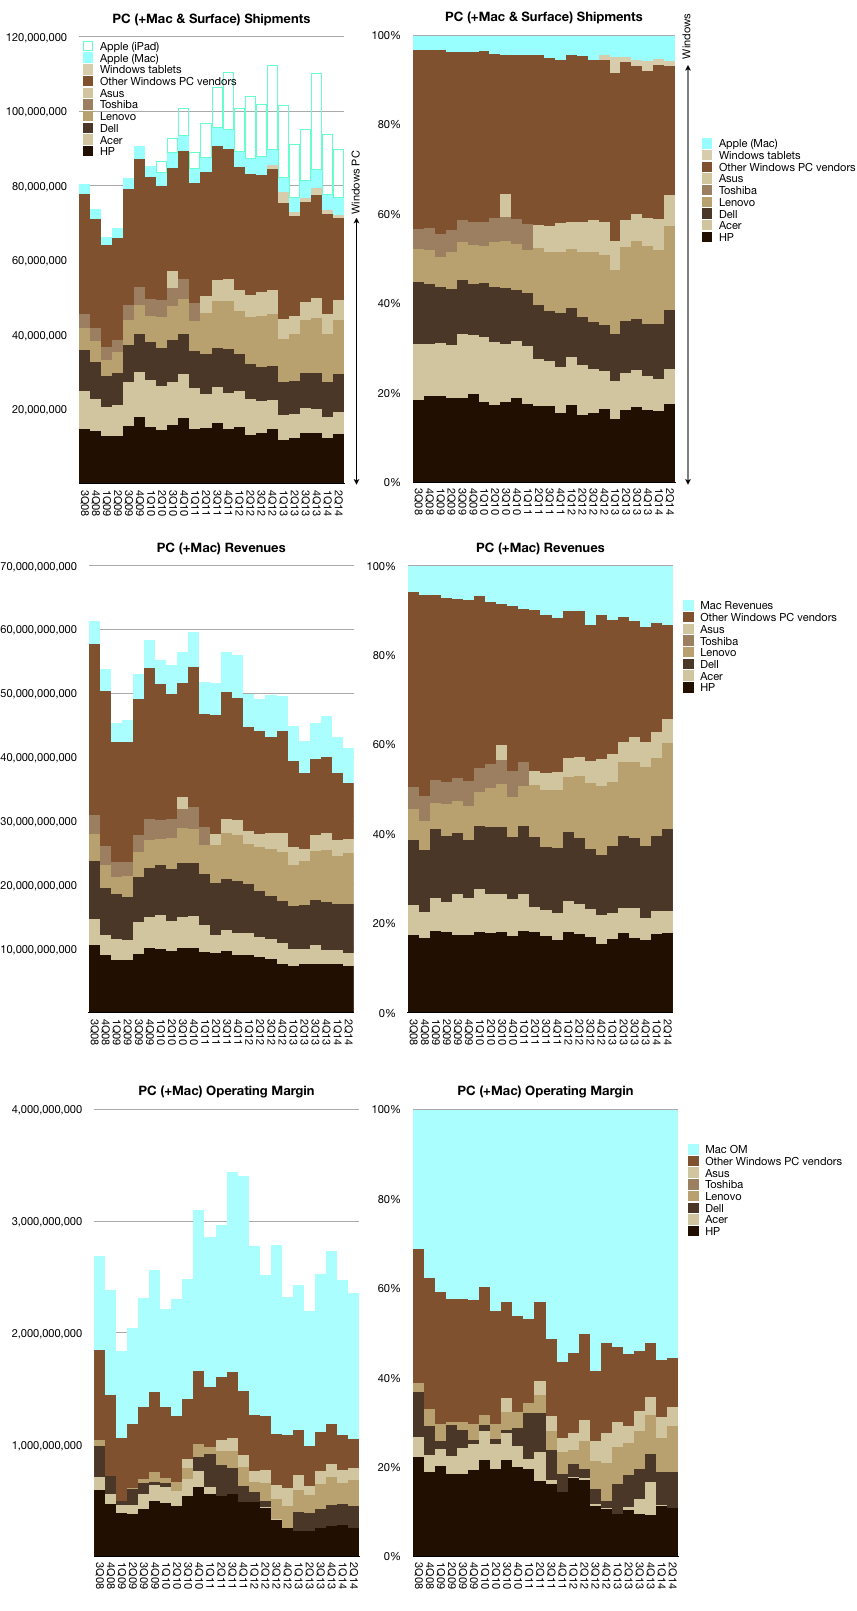
To put a finer point on it, it would be useful to know revenues and profits in addition to volumes. Thanks to Charles Arthur for providing most of the data that allows this picture to be drawn:
The revenue pictures shows that (non-Mac) PCs have been declining for almost four years and into the present quarter and operating margin ("profit") has shrunk to nearly $1 billion (while being generous with "other" PC vendors).
Incidentally, the Mac is nearly the highest revenue PC brand and by far the most profitable. Indeed, it's more profitable than all the other vendors put together.
If one includes the Mac, the PC industry may be limping along, but if we were to exclude it then this post conforms to Betteridge's law of headlines.
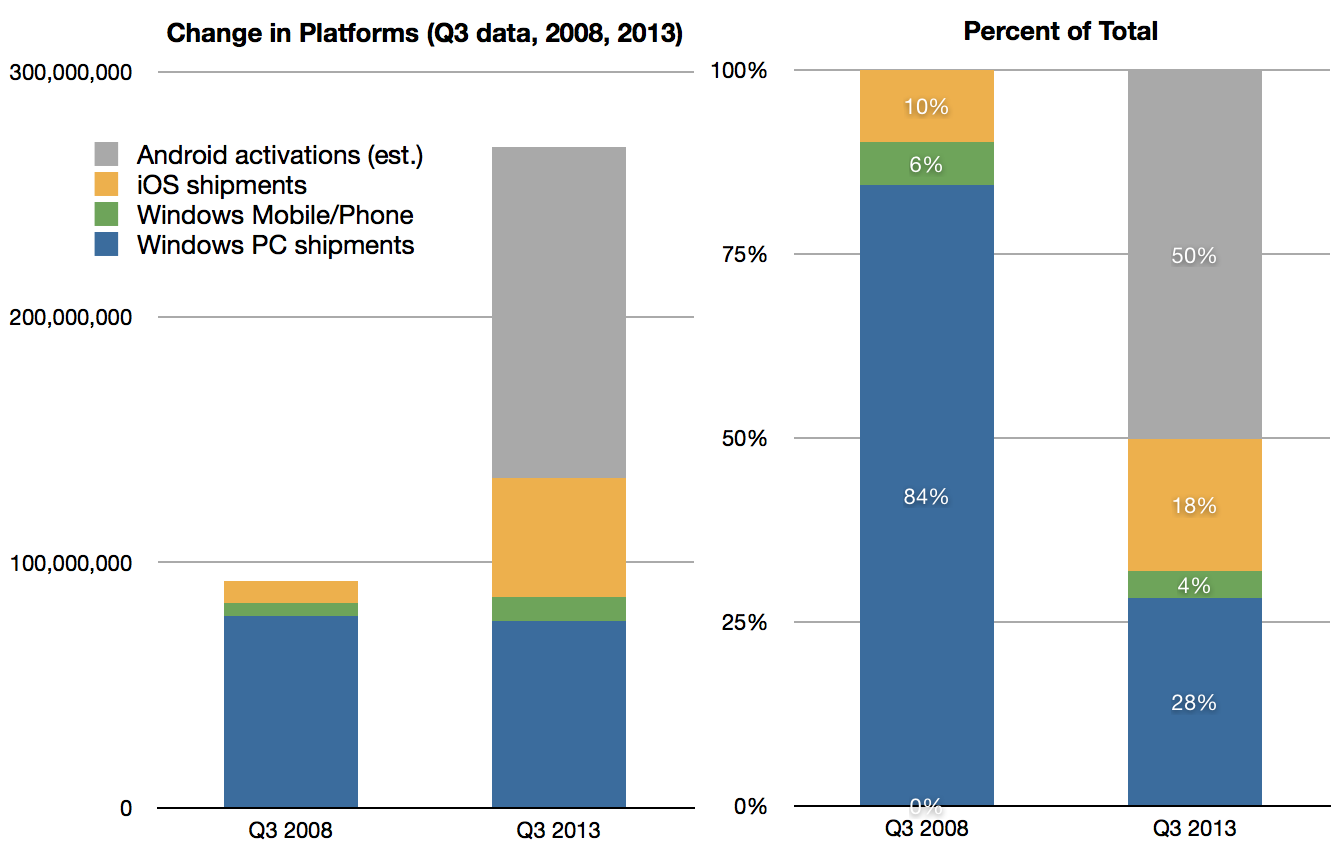
Gartner reported that PC shipments totaled 80.3 million units in Q3. Subtracting an estimated 4.4 million Macs yields an estimated 75.9 million Windows PCs. ((The total will be less than this as some PCs will not ship with Windows))
This total is lower than the total shipped in the same period of 2008.
The graphs above show the Gartner data and the split between tablets and PCs. ((Tablet and Mac data for Q3 is not yet available))
If we include all iOS and Android devices the "computing" market in Q3 2008 was 92 million units of which Windows ((Windows including Windows Mobile or Windows Phone)) was 90% whereas in Q3 2013 it was 269 million units of which Windows was 32%.
Any guesses on what this market will look like in 2018?
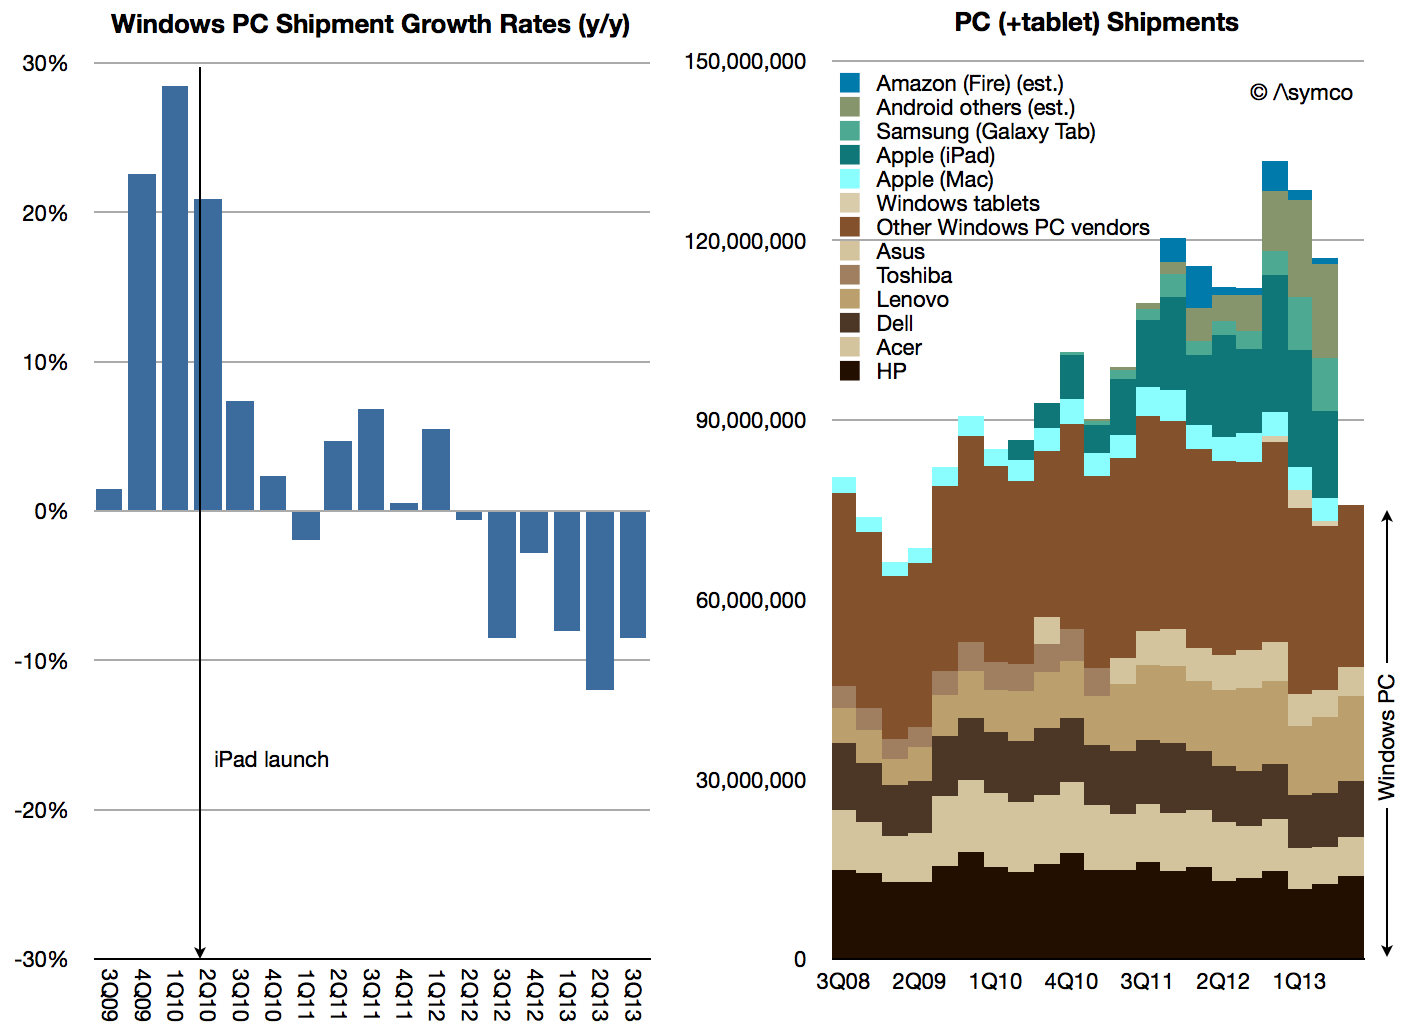
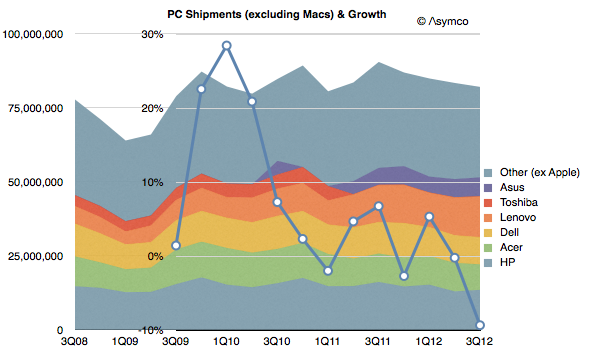
The iPad launched in April (i.e. Q2) 2010. Since then the PC industry (excluding Macs) has seen a decline in growth. The following graph illustrates global shipments as reported by Gartner:
Note that the growth rate has been negative for 4 out of the eight quarters since. The latest data shows a decline in shipments of over 9% bringing yearly growth to negative territory for the first time since the recession of 11 years ago.
There's not much I can say that hasn't been said every quarter since 2010. The industry analysis as provided by Gartner suggests a different cause for the decline, becoming more creative each quarter. This time it's "challenging economic environment" and "lack of appeal and innovation", "delays due to tax incentives", "lack of new models", "conservatism", "clearing out inventory" and "softness".
The primary challenge to these ascribed causes has to be that all these factors also affect the tablet industry and yet it's growing at phenomenal rates. The rate of new product introductions is not faster for the iPad than for PC vendors. The public and private sector buying conditions are the same. The "conservatism" on the part of institutional buyers should affect the newcomer more than the established.
The notion that an outside challenger with a new platform, an unproven set of features and missing "security" should grow in the face of difficult macro conditions that are slowing the established platform makes no sense.
My hypothesis is that the new products are solving new jobs for the users and those new solutions are trumping any "softness" in demand. In other words, an upgrade to an over-serving product will be deferred at the slightest excuse while an installation of an under-serving product that attacks an unsolved problem will be rationalized no matter the circumstances.
One product will be met with "Why should we buy it?" and the other by "Why shouldn't we buy it?"
These are the decisions made by millions every day and yet it seems that some analysts don't see any pattern forming. Such is the dilemma of disruption.
Gartner has published preliminary PC unit sales for Q2. The data from Apple's Mac sales has not been published yet but based on some estimates, we can draw a partial picture of the personal computer market.
My estimate is that the Windows PC market fell by 1% while the Mac market grew by 15%. Gartner reports an overall flat market. I'll leave out the iPad for the time being, and show the growth of the Mac vs. Windows:
In terms of individual vendors vs. each other, the patterns are as follows:
It's perhaps a bit early to tell, but if the Windows PC market continues to slow or contract, it may be possible that HP and Dell will cede their market share leadership positions to Lenovo and Acer. Already "Others" account for as many units as HP and Dell put together.
If we are to believe the analyst community reflects consensus, the industry, in the aggregate, continues to treat the potential for disruption from devices as unlikely. There always seems to be a wrinkle, a quirk, or an exceptional circumstance that is to blame. I won't get into all the excuses given by analysts for the slowing of PC sales but will point out that there's been a series of initiatives put forward by the industry to act as "catalysts" for growth. So far they have not worked. The current expectation is that Windows 8 will reverse this trend.
Perhaps. But perhaps the relief, if it comes at all, will be temporary.
[UPDATE: Due to a data error, the drop in Windows was overstated in the initial version of this post as 10%. It's been corrected to a drop of 1%]
Markets are difficult to measure. Mainly because the information is not easy to obtain and that which is obtained is not made public. Collecting, analyzing and filling in the gaps is big business with many firms involved in selling it.
However, with all the analysts and companies selling and promoting their "numbers" it's important to understand the difference between the methods used. There are for instance at least the following measurements:
Units sold to end users. For example NPD or GfK data of retail transactions. Also Gartner's estimates for phone units sold.
Units sold to the channel. For example units recognized on income statements usually reported by companies. Also IDC's estimates for phone units sold.
Units in use. For example comScore and Nielsen survey data.
Units "activated". The measurement Google uses to describe Android performance.
Intent to buy. For example ChangeWave surveys of early adopters.
Utilization rate. For example browser statistics.
Each measurement tells a different story about the market but the best story is told when all data is analyzed in a combined integrated market review.
Before diving into that it's important to understand the difference between the first and second measurements or the difference between shipped and sold.
What does "Sold" mean?
Let’s say that you sell a phone to another party. What constitutes a sale? The sales agreement? That you shipped it? That he wanted it? That you were paid for it?
What if he changes his mind and returns it? Is it still a sale? What if a manager's bonus depends on these sales? What if the company’s share price depends on these sales? Is there a way to rig the accounting?
As it turns out, yes there are; many ways. Unethical and fraudulent practices happen surprisingly often. A classic instance would be: A customer is shipped ten phones, though he only wants one, and he gets paid to ship the other nine back, after the close of the year.
The sales manager records ten times the sales he actually made, making ten times the commission and the company’s stock price rises. To compound the offense, the manager could also tip his friends to short the stock at the end of the year, leaving investors “holding the bag” when the inevitable correction follows.
There have been so many cases of this kind of accounting fraud that the FASB (GAAP), SEC, and IFRS have placed a very stringent definition on “revenue recognition”. This means that although you can sell all you want, the company can only recognize the proceeds and profit in the financial statements according to strict rules.
In the case of hardware (Sales of Goods), the customer must receive it (“delivery has occurred”), and like it enough to not return it (“amount to be refunded”), and be able to pay for it (“collection is probable”). If some are projected to be returned or unpaid, that percent is subtracted from total revenue. In the case of software (Sales of Services), it is generally accounted for over a time period. And because it is customary to send the customer upgrades, the revenue must be spread out over the time the service is provided. (“upgrade rights … 24 to 48 months.”)
It gets complicated when a piece of hardware has upgradeable software. The rules used to stipulate that the hardware, in its entirety, must be accounted for as a service and have subscription accounting. This is how Apple had to report sales during the first few years of the iPhone. It still defers some revenues for its hardware, mainly on account of iCloud, but the vast bulk of hardware revenue (96%) is now accounted upfront, recognized upon the product's acceptance by customers. 4% is for software upgrades and is accounted for over a specific lifetime of the product (24 months in the case of the iPhone).
What does "Shipped" mean?
The discussion so far implies that if a product that is accounted for as "Sold" on an income statement does not mean that it's in the hands of an end user. These "revenue recognized" products are sold to a distributor, typically for a phone that's an operator.
These sales satisfy the requirements for financial reporting as revenues booked. But they are not in the hands of users. Nor are they "activated" and they don't generate page views that are measured by web analytics companies. Most analysts and companies now use the phrase "Shipped" to describe these revenue-recognized units though it's also common to hear "sold".
When a product sells to end users it's sometimes called "sell-through". It's counterpart is "sell-in" which is sales to the channel distributors.
A big gap between sell-in and sell-through might imply large amounts of in-channel inventory. This is product that is sitting either in stores or in warehouses or on trucks in transit. If sales are steady, the inventory is measured in time as in "weeks of inventory". This means that the excess is expected to be sold within a fixed time frame if shipments were to end. The smaller this amount, the better or "tighter" the operations are. Inventory, as Tim Cooks says, is fundamentally evil. It eats capital and erodes profitability.
Sometimes miscalculation of sell-through could result in vast amounts of inventory that has to be returned by distributors. That inventory is either written off or sold at fire sale prices resulting in a "write-down". This happened recently with both the HP TouchPad and with the RIM PlayBook. This special charge against income is a one-time (usually) incident but it can also affect a firm's reputation with channel partners for a long time. This type of failure is very costly.
Therefore what matters most is to keep the difference between Sell-in and Sell-through as small as possible. However, it can't be too small. Sometimes if Sell-through is too fast, you get stock-outs which means that there is more demand than supply and sales opportunities are missed. This has happened many times with iPhones and iPads. This is also an unwanted situation (unless there was too much inventory in the channel during the previous period and thus it was being drained in the current period.)
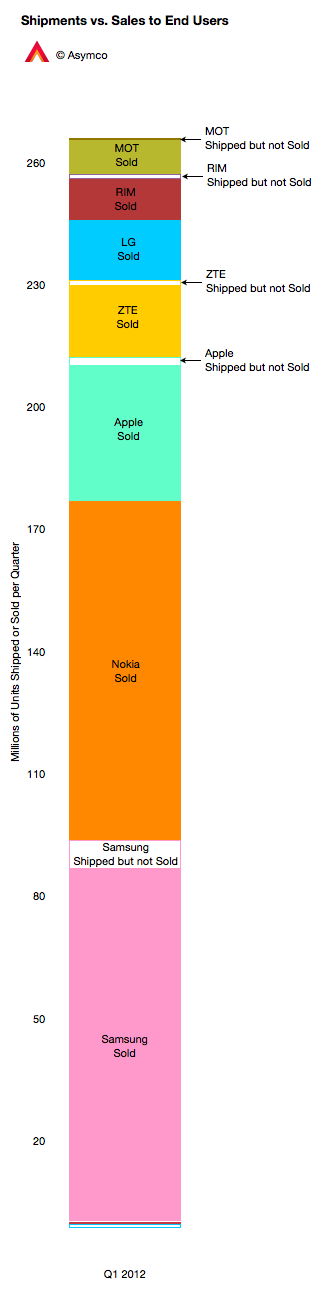
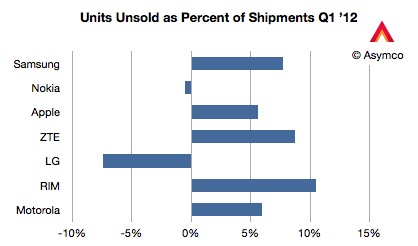
The chart to the left shows how the phone market looked for various vendors last quarter. I compiled the data based on Gartner's "sales to end users" and IDC's "shipments" data. Two vendors had higher sell-through than sell-in (Nokia and LG) probably because they were draining excess inventory. The others had channel inventory of between 5% and 10% of units shipped.
This ratio is shown below in a chart comparing the largest phone vendors.
Management is often rated for performance on this metric, as they should be, since it's a measure of operational skill. However, there are many factors that affect overall performance.
New product launches, windows of opportunity related to seasonal buying patterns, anticipating macroeconomic slowdowns, even natural disasters and legal challenges can affect this metric.
Understanding the overall market requires an appreciation of this distinction but also an understanding of all the other metrics listed above and what stories they tell.
---
Notes: My thanks to Michael Dediu for input on this discussion.
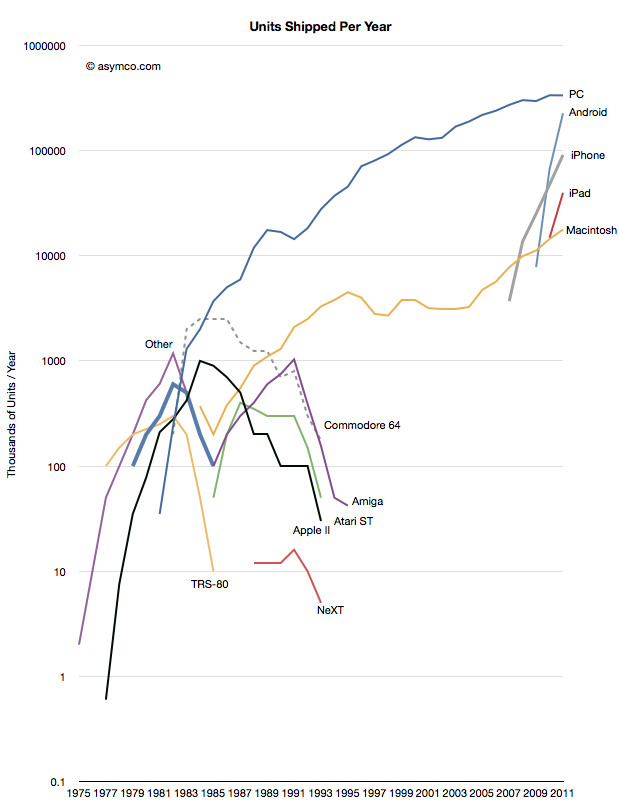
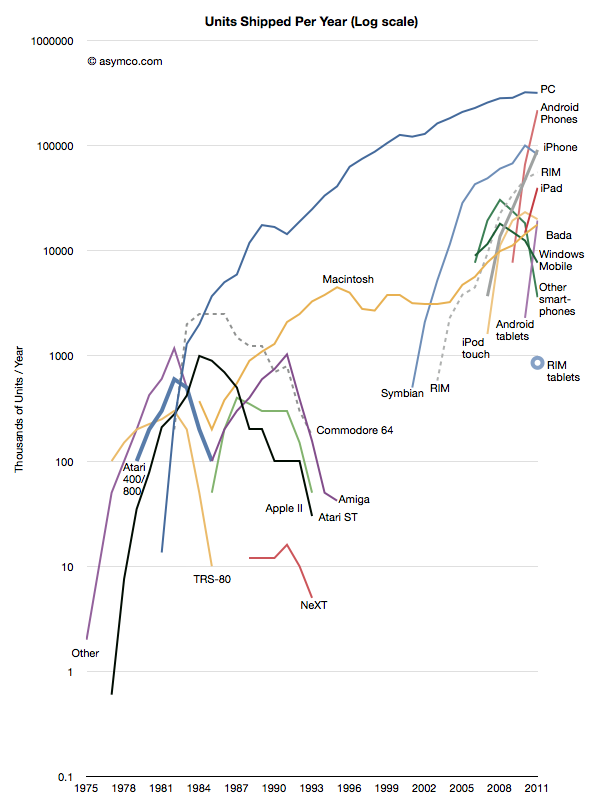
Thanks to Jeremy Reimer I was able to create the following view into the history of computer platforms.
I added data from the smartphone industry, Apple and updated the PC industry figures with those from Gartner. Note the log scale.
The same information is available as an animation in the following video (Music by Nora Tagle):
httpv://www.youtube.com/watch?v=8h-C6u4yLj4
This data combines several "categories" of products and is not complete in that not all mobile phone platforms are represented. However, the zooming out offers several possible observations into the state of the "personal computing" world as of today.
We cannot consider the iPad as a "niche". The absolute volume of units sold after less than two years is enough to place it within an order of magnitude of all PCs sold. We can also observe that it has a higher trajectory than the iPhone which became a disruptive force in itself. Compare these challengers to NeXT in 1991.
The "entrants" into personal computing, the iPad, iPhone and Android, have a combined volume that is higher than the PCs sold in the same period (358 million estimated iOS+Android vs. 336 million PCs excluding Macs in 2011.) The growth rate and the scale itself combine to make the entrants impossible to ignore.
There is a distinct grouping of platform options into three phases or eras. The first lasting from 1975 to 1991 was an era of rapid growth but also of multiple standards and experiments. It was typical of an industry in emergence. The personalization of computing brought about a new set of entrants. The second phase lasted between 1991 and 2007 and was characterized by a near monopoly of Microsoft, but, crucially one alternative platform did survive. The third phase can be seen as starting five years ago with the emergence of the iPhone and its derivatives. It has similarities to the first phase.
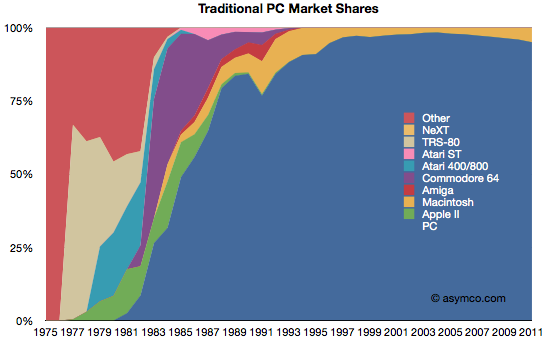
We can also look at the data through a slightly different view: market share. Share is a bit more subjective because we need to combine products in ways that are considered comparable (or competing).
First, this is a "traditionalist" view of the PC market as defined by Gartner and IDC, and excluding tablets and smartphones.
This view would imply that the PC market is not changing in any substantial way. Although the Mac platform is gaining share, there is no significant erosion in the power of the incumbent.
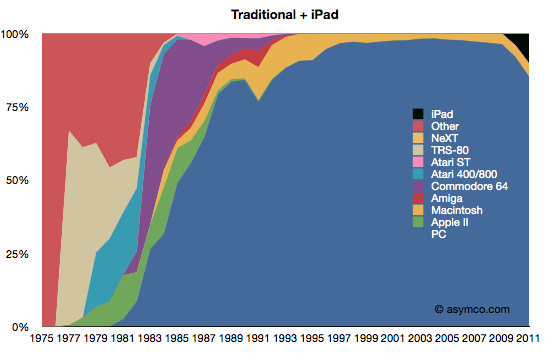
Second, is a view where the iPad is added to the traditionalist view.
This view is more alarming. Given the first chart, in order for the iPad to be significant, it would need to be "visible" for a market that already ships over 350 million units. And there it is. If counted, the iPad begins to show the first disruption in the status quo since 1991.
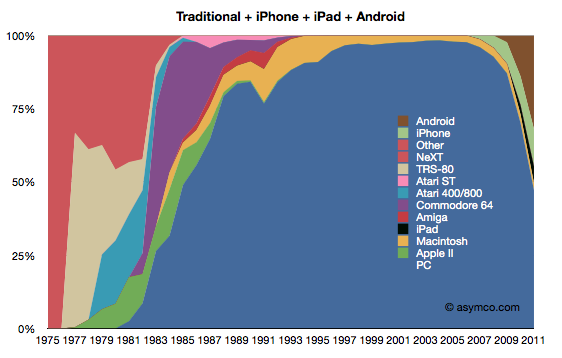
The third view is with the addition of iPhone and Android.
This last view corresponds to the data in the first graph (line chart). If iOS and Android are added as potential substitutions for personal computing, the share of PCs suddenly collapses to less than 50%. It also suggests much more collapse to come.
I will concede that this last view is extremist. It does not reflect a competition that exists in real life. However, I put this data together to show a historic pattern. Sometimes extremism is a better point of view than conservatism. Ignoring this view is very harmful as these not-good-enough computers will surely get better. A competitor that has no strategy to deal with this shift is likely to suffer the fate of those companies in the left side of the chart. Treating the first share chart as reality is surely much more dangerous than contemplating the third.
I've used anecdotes in the past to tell the story of the disruptive shift in the fortunes of computing incumbents and entrants. I've also shown how the entry of smart devices has disrupted the telecom world and caused a transfer of wealth away from the old guard.
The data shown here frames these anecdotes. The data is not the whole story but it solidifies what should be an intuition.
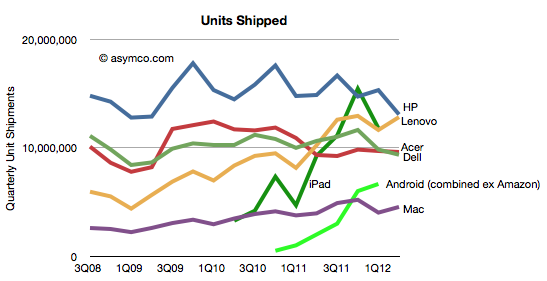
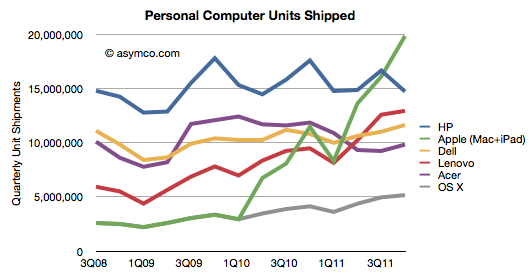
However, according to Gartner, HP shipped 14.7 million PCs in the last quarter. While we don't have the total global figure for Apple, my estimates are 5.2 million Macs and 14.7 million iPads, for a total of 19.9 million computers in the same period.
There might be an error in both Gartner's and my numbers, but the gap of over five million in Apple's favor is unlikely to disappear.
The history of shipments from these vendors is shown below.
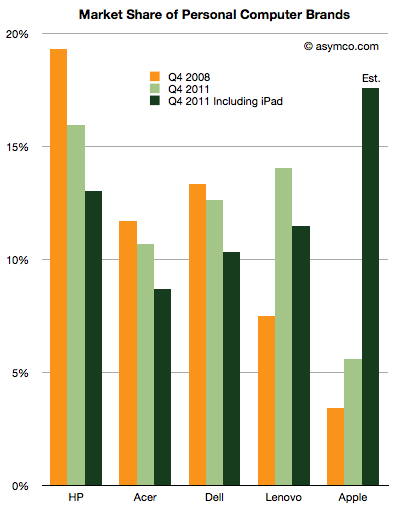
The market shares are also shown here:
I included the market shares thee years ago, and the rankings with the iPad excluded.[1] Apple went from 3.42% share at the end of 2008 to 5.6% share today excluding the iPad or 17.6% including the iPad. HP went from 19.3% in 2008 to 16% today or 13% if iPad is included.
Apple is ahead of schedule on their taking[2] the top spot in terms of units.
Notes:
Although vendors other than Apple also sell tablets, their totals are unpublished and I am not aware of any estimates so. If anyone has seen estimates I would be happy to amend the data.
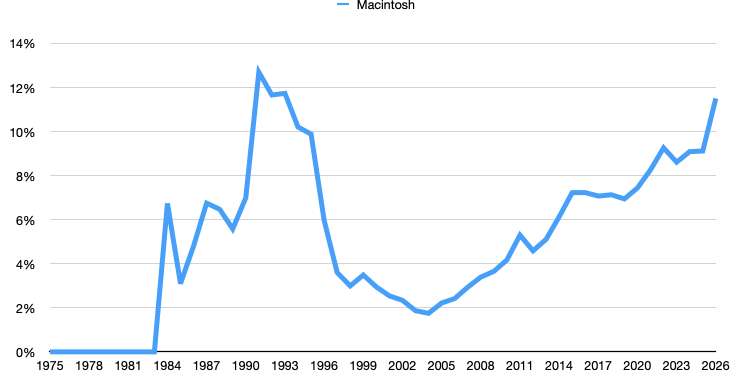
Throughout the history of the industry, Apple never held the top spot. The Apple II peaked at 15.8% in 1984 and the Mac at 12% in 1992.
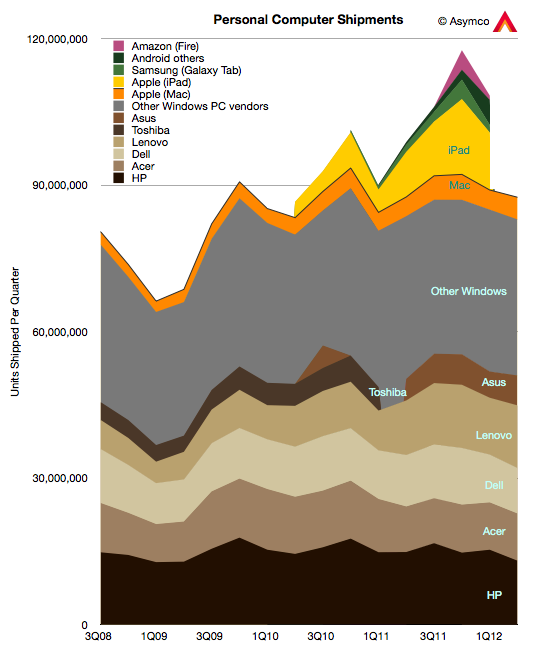
Gartner published its estimates for "PC" shipments during the fourth quarter. As I've done in the past, I combined their estimates with known shipments from Apple and separated Apple's performance from the Windows-based market.
I also take into consideration the iPad as a potential competitor for computing purchases. Apple will report fourth quarter results including Mac and iPad shipments in less than two weeks but I am using my own estimates until then.
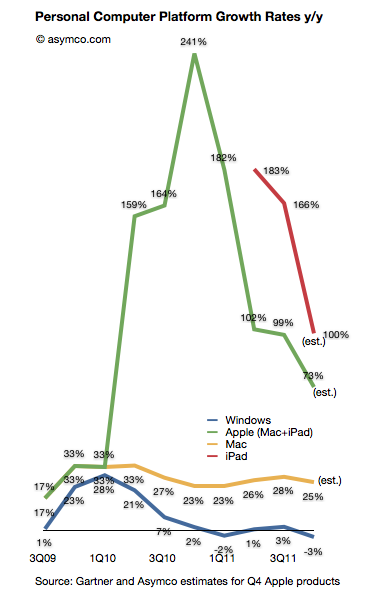
Here is how the platforms grew over the last few quarters (all figures are global):
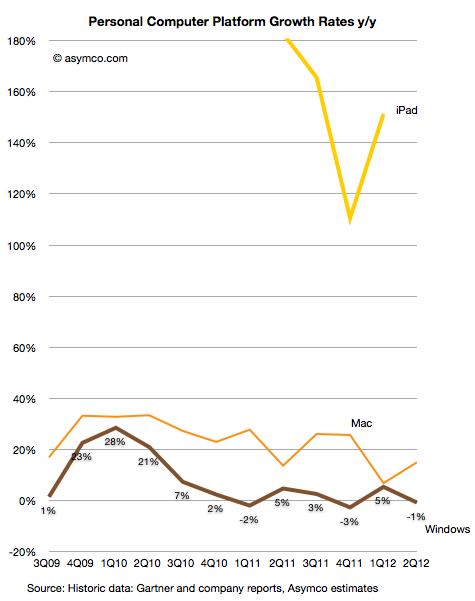
The Gartner data implies a 3% decline in the size of the Windows PC market during the last quarter. This is the fourth quarter of disappointing Windows performance. If you observe the pattern for the Mac vis-a-vis Windows there is a similarity in the overall cycle but a divergence in terms of growth. The "spread" between Windows and Mac OS X is increasing and has reached an all-time high of 28 points.
But the more interesting story is that the decline in Windows seems to be coincident with the growth in the iPad. The green (Mac + iPad) shows the effect of the new category while the red line (iPad only) shows that growth in isolation (year-on-year).
Coincidence?
Ever since the iPad launched the hypothesis that it has an impact on PC has been hanging in the air. Most analysts (including Gartner) argued that there was no effect from iPad and that the problems with Windows were all due to one-time circumstances. We hear the same about the last quarter with floods in Thailand being blamed.
However, in the latest quarter Gartner began suggesting that "consumers' attention was diverted toward other product categories, especially smartphones and media tablets."
One wonders if these "media tablets" are not PCs and yet they negatively affect the purchase of PCs whether they are indeed competing with PCs.