Asymco

Asymmetric Intelligence

guidance

  1. Best guess for how many iOS devices will ship in 2014

    Research · 19 comments

    In October 2013, at the end of its last fiscal quarter, Apple stated:

    The Company’s capital expenditures were $7.0 billion during 2013, consisting of $499 million for retail store facilities and $6.5 billion for other capital expenditures, including product tooling and manufacturing process equipment, and other corporate facilities and infrastructure. The Company’s actual cash payments for capital expenditures during 2013 were $8.2 billion.

    The Company anticipates utilizing approximately $11.0 billion for capital expenditures during 2014, including approximately $550 million for retail store facilities and approximately $10.5 billion for other capital expenditures, including product tooling and manufacturing process equipment, and corporate facilities and infrastructure, including information systems hardware, software and enhancements.

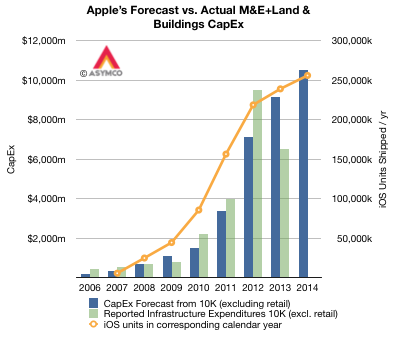
    These 10K (fiscal year annual) forecast figures for capital expenditures are shown in the following graph. Note that they also include the fiscal years from 2006 to 2012. Note also that the graph includes the actual expenditures (in green).
    Screen Shot 2014-08-12 at 5.37.57 PM

    From 2006 through 2013 the sum of the forecasts was $23.445 billion while the sum of the expenditures were $24.662 billion. With the exception of a carry-forward in 2012, the forecasts are broadly in-line with expenditures, with about 5% more spent than forecast.

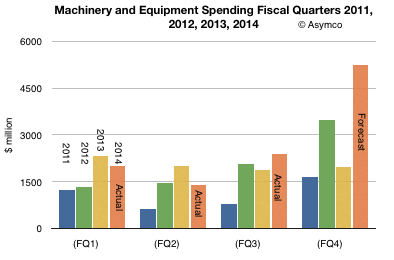
    This pattern of accuracy in spending makes a $10.5 billion expenditure during the current fiscal year believable. In other words, taking the forecast at face value, and given that three quarters of the fiscal year have already passed, what does it imply for the current and last quarter? The following graph shows what Q3 spending should be relative to previous quarters (and 2011, 2012 and 2013).
    Screen Shot 2014-08-12 at 5.38.27 PM

    The FQ4 (CQ3) "budget" for PP&E should therefore be $5.255 billion. This would be the most Apple has ever spent on PP&E in a single quarter.

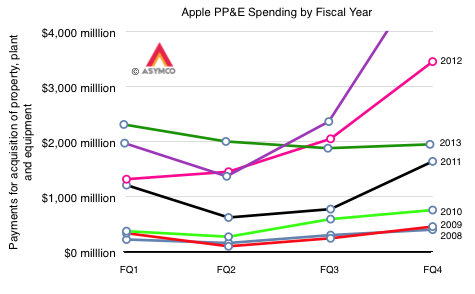
    Shown another way, each fiscal year's spending from 2008 to present looks like this:
    Screen Shot 2014-08-12 at 5.46.27 PM

    2014 is shaping up to be a bigger "ramp" in spending than any previous year. We have also noted how iOS device shipments correspond to these CapEx figure.

    The relationship is shown in the first graph. I super-imposed iOS unit shipments for the calendar years because capital expenditures tend to result in production in the following quarter and Apple's fiscal year is shifted one quarter earlier than the calendar year. The iOS units shown for 2014 is based on shipments to date and a forecast of shipments for Q3 that is in-line with company guidance ((37.2 million iPhones, 14 million iPads, 1.9 million iPods touch which result in net sales of $40.18 billion and corresponds to the top of the guidance range of $37 to $40 billion)) and a modest forecast for Q4.

    The metric of Capital Expenditures (excluding retail) is a good "rule-of-thumb" for predicting iOS growth, but it's not perfect. Obviously we've seen issues between forecasts and actual spending on a quarterly basis, but there is an overall relationship which makes sense: Apple spends on tooling and infrastructure in terms of data centers to support iOS growth. So far, a growth in CapEx has resulted in a growth in iOS.

    It's therefore reasonable to assume that calendar 2014 will see at least 250 million iOS devices sold. How much that figure will vary will depend to some degree on the confluence and substance of product announcements this fall. ((My best guess is now 255.8 million.))
     

  2. Surprise

    Research · 46 comments

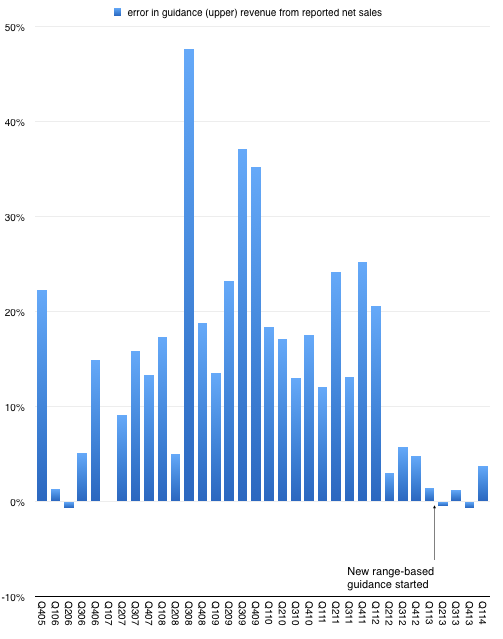
    After n quarters of predictability, Apple surprised with sales performance that was 3.74% above the top of their guidance. This may not seem significant but since instituting a new range-bound guidance method in Q1 of last year the company reported revenue within about 1% of the top of the range.

    This is in stark contrast to the wide variance in prior years. The following graph shows the "error" in guidance as the percent difference between reported sales and guidance ((Upper end of range in quarters where a range was given.)).

    Screen Shot 2014-04-25 at 4-25-10.18.06 AM

    So prior to last quarter we were lulled into thinking that guidance was very nearly perfectly predicting the company. As I tweeted, it took the "sport" out of trying to do any forecasting. All an analyst had to do is tweak the main product growth figures to hit the sales target and then subtract the (generously provided) operating expenses and (also provided) tax rate to get the earnings. Only unknown to getting to an estimate of EPS was how many shares would still be outstanding. ((The company itself would not know shares outstanding as their buying was opportunistic during the quarter.))

    Knowing Apple also means that average selling prices are also very rigidly set in stone so the degrees of freedom in analysis were becoming highly constrained.

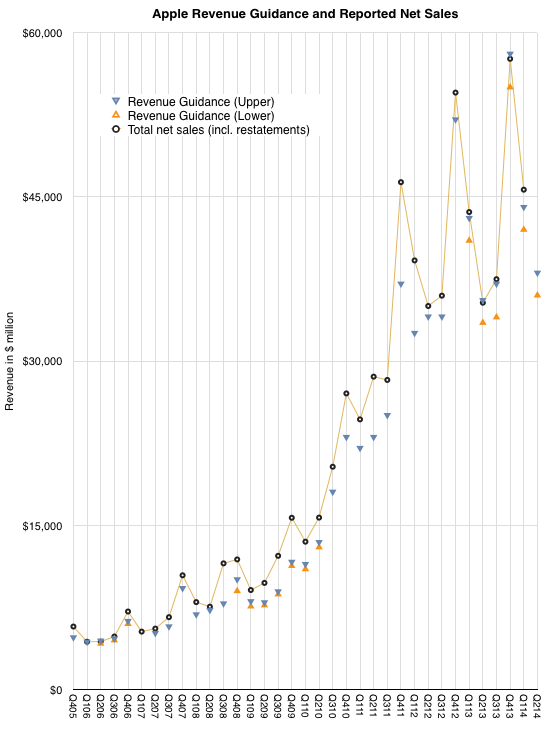
    But just when you think you spotted a pattern, it changes. The company surprised with performance outside the band. The following graph shows the estimate ranges it has given and the actual revenues delivered. ((Next quarter is also pencilled in.))

    Screen Shot 2014-04-25 at 4-25-10.19.24 AM

    So what happened?

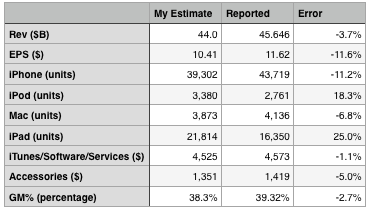
    The answer seems to be better iPhone performance. The following table shows my expectations, which were tuned to return revenues exactly at the top of the guidance range.

    Screen Shot 2014-04-25 at 4-25-10.25.16 AM

    On product shipments/sales I underestimated the iPhone and Mac and overestimated the iPad and iPod. I estimated iTunes accurately and underestimated accessories by 5%. I also generally got the blend of margins fairly close, being 1 point too low on gross margin.

    The bottom line was that the Revenue and Earnings surprise could be accounted for through a significant outperformance on iPhone which offset a less significant underperformance on the iPad.

    The iPhone grew sales by 14% which more than offset a drop of 13% in iPad sales and was enough to allow net sales to grow by 5%. Since the company guided nearly flat growth, that 5% was a big surprise.

    Now one could ask whether 14% growth in the iPhone revenues is a meaningful change in the long-term evolution of the category. This is a difficult question. The way the iPhone is positioned makes it a great success in the premium segment of the market but it does not place it in competition with the perhaps 80% of the market which seems to be defined by a lower price point.

    However let's not forget that pricing is correlative to the market but it may not be causal. Purchase decisions are complex and price is one aspect of that decision. But there are many others. Availability, channels, service, brand all play parts. The error of many analysts is to conclude that price and price alone is causal to behavior. That may be so with commodities, but let us not forget that these products and their uses are newly created and how value is perceived has been changing rapidly. Buyers follow a learning curve in terms of discovering the uses and value of products. These learning curves can be modeled and usually show several years (sometimes decades) for most populations between early and late adoption.

    We don't know where the iPhone is on the learning curve for any particular region and that means we can still be surprised by how it grows.

  3. Apple Fourth Quarter Estimates

    Research · 56 comments

    As Philip Elmer-DeWitt is still interested in my estimates I provided the following:

    Revenues ($B) 57.8
    EPS ($) 14 (908m shares)
    iPhone (units) 56.4 million
    iPod (units) 7.6 million
    Mac (units) 4.14 million
    iPad (units) 26.5 million
    iTunes/Software/Services ($) 4.2B
    Accessories ($) 2.2B
    GM% (percentage) 37.1%

    I arrived at these estimates without looking at anyone else's (except for Apple's own published guidance). Soon after sending them I noticed that Daniel Tello published his own.

    In the same format as above, I quote them for comparison. Please visit his post for additional detail.

    Revenues ($B) 59.0
    EPS ($) 14.92 (895m shares)
    iPhone (units) 56 million
    iPod (units) 9 million
    Mac (units) 4.65 million
    iPad (units) 25.5 million
    iTunes/Software/Services ($) 4.3B
    Accessories ($) 1.8B
    GM% (percentage) 37.8%

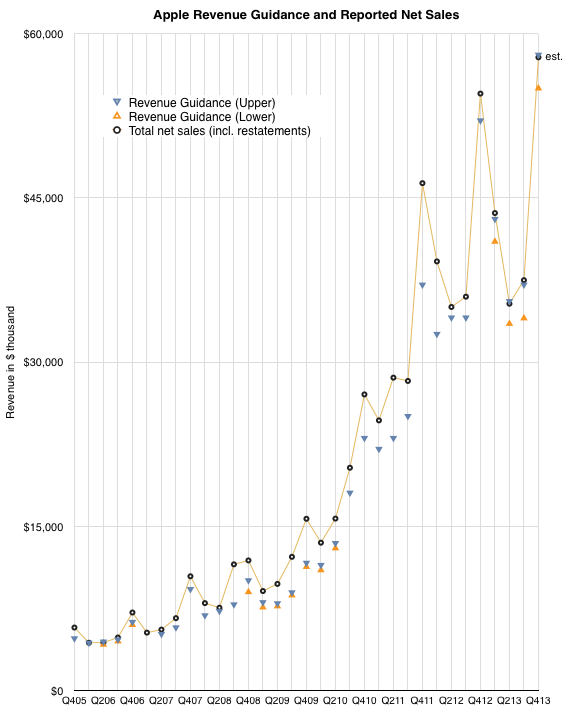
    The graph below shows the history of revenue guidance vs. revenue reported. The last quarter shows my estimate for net sales.

    Screen Shot 2014-01-15 at 1-15-4.06.58 PM

    Note that the company achieved at or slightly above its upper guidance ever since they started offering a range for guidance (i.e. since Q1 2013). My estimate for sales is therefore very near the top of guidance. The figures for units earnings and margins all result from this assumption.

  4. Apple’s 3Q FY13 Review (Padcast)

    Research · 16 comments

    Preview 3Q-13 screenshot

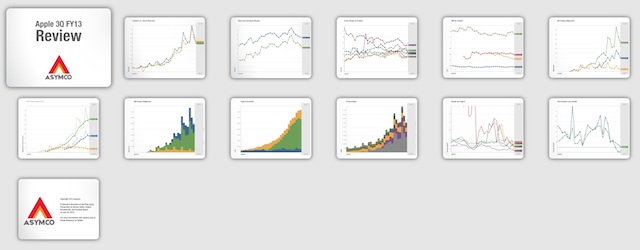
    Using interactive graphics and narration, this latest Apple Earnings Review discusses Apple's performance in relation of its historic performance as well as to expectations (published in the Preview) on the following topics:

    1. Guidance vs Actual performance: Now that Apple changed the way it provides guidance, are we seeing a new degree of precision in their signaling. We look at the history of earnings guidance and how effective (or not) the current method is in helping predict performance.
    2. Gross and Operating Margins analysis: What is the pattern of margins and how important are margins to the perception of competitiveness?
    3. Margins by product. How are margins allocated by product?
    4. Average selling prices for each product. Any surprises in Pricing? What was the magnitude, cause and significance of iPhone ASP drop.
    5. iOS product shipments. Comparison with expectations, trends and explanations. Overall iOS growth story.
    6. Cash balance and the effect on cash of share re-purchase.
    7. Sales growth and Earnings growth, a long term retrospective.

    Duration is about 1hr.

    As a reminder, the Padcast can be reviewed interactively users can access to the underlying data.

    It's available for download on the iPad for $19.99. Those who already bought the Preview will be receiving an updated version soon that includes the Review at no extra charge.

  5. Estimates for Apple’s first fiscal 2013 quarter

    Research · 130 comments

    I've postponed my estimates for the fourth calendar for a long time. The reason is that there have been conflicting data to deal with and I've been hoping for some clues to give clarity. Unfortunately, even though I waited, I have not received many clues. Here are the challenges we have to deal with in this quarter:

    1. Management gave very low guidance for the quarter's earnings and sales. Normally this should not be a concern since the long-term pattern has been for them to "sandbag" significantly. For example last year's fourth quarter was guided at $9.3 EPS while the company delivered $13.87, a 49% "beat" to their guidance. However Q2 and Q3 beats were only 7% and 13% respectively and if we assume a similar number (10%) for Q4 we get about $13/share which would be a year-on-year decline in earnings (down from $13.9). This has not happened for many, many years. Management explained this through a lengthy set of reasons including a shorter quarter (13 weeks vs. 14 weeks), new product launches, currency fluctuations, deferrals and unfavorable component pricing. Then again, similar explanations were used in the past with no reflection in what actually happened.
    2. Management also launched a large number of new products. This normally leads to a surge in sales. In fact, 80% of revenues would come from a new portfolio of products. Having such a broad launch quarter into a holiday, would normally imply huge growth. Not only is this a critical launch quarter for many products but they also rolled out the iPhone to more markets more quickly than ever: 100 countries in three months. The broad roll-out implies a steeper ramp in production and thus more volumes. This would also contradict the lowered expectations from the CFO. However...
    3. Production was constrained. It was quite a long time before waiting times decreased for the iPhone--longer than what we saw last year. In the earnings call Tim Cook said "It's difficult to predict when supply and demand will balance, but I'm feeling very confident on our ability to supply quite a few iPhones". This again implies significant acceleration but did they achieve the targets? He did also announce that they met their target of 100 countries during the quarter but it's not clear if this was as quickly met as they would have liked.
    4. Margins are complicated. Launch quarters have lower margins typically and this is well understood. However, we have new products in the form of a new iPad at a new price point as well as the new iPhone which may have had some difficult manufacturing issues (i.e. yield). So how much faith do we put in the perennial pessimism in guidance?
    5. There was a vast increase in CapEx in the prior quarter. Normally CapEx spending "leads" production and is in proportion to it. However, the surge in Q2 and Q3 seemed to be unmatched by vast new production, at least that's what we are led to believe by both consensus and by management guidance. Did this CapEx differ in character from previous CapEx? Was it more "strategic" and less "tactical"? Will the disconnect continue?

    There are also the deeper questions:

    • Why there are no new operators being signed? The addressable market has not increased in the last 6 months. Why?
    • Is there a faster product cycle in the works? Is there a shifting of gears to a new product development process?
    • What's the nature of the relationship with Samsung as a supplier? Is their replacement characterizing the new type of CapEx spending?

    All these currents make this quarter doubly difficult to forecast. And it does not help that it comes on the back of two weak quarters which were argued away as exhibiting transition effects.

    So I'm very uncomfortable with my forecast and find it hard to defend this quarter. I considered not publishing one at all because it gives too much confidence when none is warranted. However, I received so many requests to publish that I relent and offer the following:

    • iPhone units: 55.5 million (50%/62%)
    • Macs: 5.0 million (-4%/+3%)
    • iPads: 24.4 million (58%/70%)
    • iPods: 11.2 million (-27%/-22%)
    • Music (incl. app) rev. growth: 25%/38%
    • Peripherals rev. growth: 10%/19%
    • Software rev. growth: 5.5%/14%
    • Total revenues: $60.0 billion (30%)
    • GM: 39.8%
    • EPS: $15.74 (13%)

    I included two growth figures (in parentheses). The first is a straight y/y value and the second is adjusted by assuming there were 13 weeks last year (and that sales were evenly distributed over those weeks).

    [We'll get a chance to go over this forecast and what is actually reported at Asymconf. Don't forget to sign up.]

  6. Estimates for Apple's fourth fiscal 2012 quarter [Updated]

    Research · 74 comments

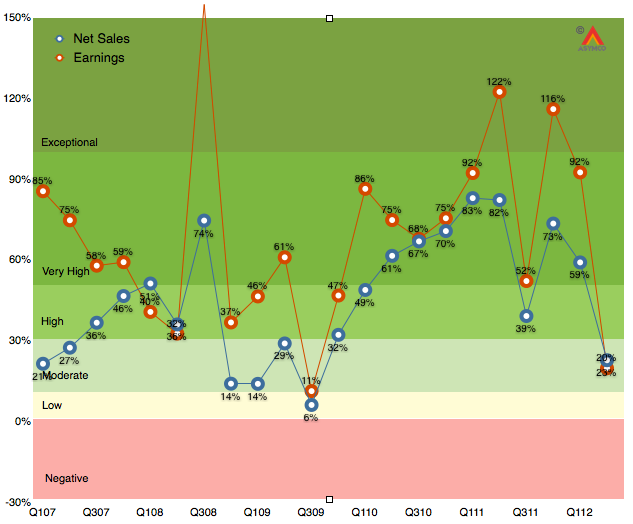
    As the chart below shows, the last quarter (second calendar 2012, third fiscal 2012) was disappointingly moderate with 20% earnings growth and 23% net sales growth.

    It was the first quarter since the iPhone launched that earnings growth has fallen into moderate (below 30%) territory. Much of that disappointment (to me) was the relatively low performance of the iPad following a launch quarter. The iPhone was weak as well, though that was expected.  As I said last quarter, the iPhone is still the most important component but the iPad is becoming increasingly decisive in overall performance. In fact, I’m projecting that the iPad will have the same revenues as the iPhone had one year earlier.

    The iPhone is going to be extremely difficult to project. On one hand we have the launch of the i5 which will account for about 10 million units in the quarter, on the other, chances are that sales were very weak prior to the launch as purchases were being deferred even more than during the last quarter.

    So with these very meager clues, here are my estimates for the quarter (with y/y growth in parentheses):

    • iPhone units: 27.8 million (62%)
    • Macs: 5.6 million (15%)
    • iPads: 18.8 million (69%)
    • iPods: 5.6 million (-15%)
    • Music (incl. app) rev. growth: 40%
    • Peripherals rev. growth: 10%
    • Software rev. growth: 15%
    • Total revenues: $39.5 billion (40%)
    • GM: 42%
    • EPS: $9.75 (38%)

    This earnings value would imply a trailing twelve months’ EPS of about $45.2. At the current price of $697/share the P/E would be 15.4. Cash and equivalents will probably increase to $125 billion or $131/share. Excluding cash, the P/E would be 12.5.

    [Update. The EPS figure above includes a tax rate estimate of 30%. Company guidance was 25.5%. Using the company's guidance yields an EPS of 10.43. TTM EPS becomes $45.9/share and at $697 the PE is 15.2. At time of this update the share price has fallen to $665 and thus the pro-forma trailing P/E ratio is 14.5).]

  7. Apple's Guidance Deficits

    Research · 94 comments

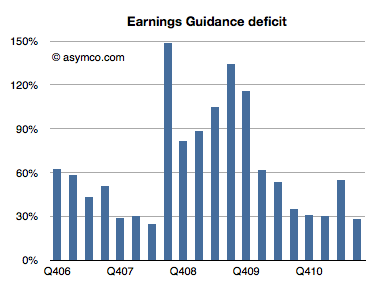
    Every quarter Apple's management issues a "guidance" or forecast of their own earnings in the following quarter. Over the years, this figure has been nearly useless because not only is it not accurate, the error itself has been wildly variable. I plotted what I call the Earnings Guidance Deficit for Apple based on the formula (Actual EPS diluted - Guidance)/Guidance.

    The higher the value in the bars above, the more the company underestimated (or under forecast) its performance. Note that during the recession the company routinely offered guidance at half the level they actually delivered. After the recession they returned to a more reasonable ~30% under-reporting.

    The problem with this analysis is that there is such a high volatility in this factor that we can't count on it to predict where earnings will fall. Even if we saw a range bounded at 30% to 60% the usefulness of this would be very low as that is far worse than the range that analysts can get through other means (Deagol's accounting of analyst error). The best thing we can say is that the range seems to be bounded by 30% and 150%.

    Rather than using this history for precision, perhaps it makes more sense to assume that the lower bound offers at least some limit to the possible value of next quarter's earnings. Maybe it can give us a "sanity check" for our own estimates.

    For the next quarter Apple guided $9.30 per share. If we assume a 27% "deficit" which is at the lower end of the range above then the earnings are likely to be about $11.8.

    That's equivalent to an 84% growth in earnings year/year. It would also imply $33 for the 2011 calendar year. At the current share price of $384 that implies a P/E of 11. That happens to also be the P/E for Apple at the trough of the recession in January 2009.

    In other words, if the stock price does not rise (or falls) from the current level by the time earnings are reported in late January, then the P/E for Apple may drop to less than 11 on growth of 83%. That's a sanity check all of its own.


  8. Is Nokia worth less than Skype?

    Research · 57 comments

    Yesterday Nokia warned that its guidance for the quarter and the year were "no longer valid." The surprise to me is that management was surprised. In February I warned that even if Nokia could fool consumers into buying products whose platform was publicly executed, distributors and operators would not likely go along with the deception. Pricing collapse is the proof of a channel breakdown.

    That seemed predictable. What I struggled with was how Nokia itself could present such an optimistic forecast. Absent any explanation, Nokia's forecast of robust sales for Symbian products into the near future belies a failure of understanding of the dynamics of platforms and especially the impact of destruction of trust and brand value that commenced in February. Distress is a slippery slope and it does not model well in a spreadsheet. It takes a leap of non-linear faith to predict the piling-on effect on the up- and the down-side.

    Faith in the company's guidance meant that the market reacted to the bad news by discounting Nokia down to a market cap of $26.7 billion. One analyst even cut his target price down to $4/share, 57% of yesterday's close. How can this fair? What is Nokia's phone business worth?

    Here's a quick sum-of-the-parts analysis. After yesterday's hair cut Nokia's overall enterprise value is about $20 billion. The Navteq part of the business (purchased for $8.1 billion in 2008) could get a value of $3 billion (based on about 3x sales) and the value of Nokia Siemens networks could be at $6b (less than 0.5x sales). That makes Nokia's phone business worth about $11 billion.

    An alternative view based on "the Motorola case study" $4 target price would imply an overall enterprise value of $11 billion. This either makes Navteq and NSN worthless and Phones worth $11 or it makes the phone business worth a lot less than $10 billion. Perhaps less than $8.5 billion which is what Microsoft paid for Skype. Should we be shocked? Nobody would argue that Nokia is worth more than Facebook so who's to say that Skype or Twitter aren't more valuable than a device company in crisis?

    I don't try to predict the market's behavior, nevertheless, the markets are now very skeptical that there is much in Nokia to salvage. It's perhaps unfair and illogical but this is the end game of disruption. It ends much more suddenly than it begins. It's the consequence of nobody noticing the beginning that makes the end so shocking.

  9. Is Apple a candidate for acquisition?

    Research · 57 comments

    As shown in the Apple growth scorecard, the company's earnings growth is continuing at 75% with the top line increasing at the annual rate of 70%.

    The $59 billion of cash on the balance sheet has reached the equivalent of $64 per share yielding an enterprise value of $263 per share based on closing price of January 21st.

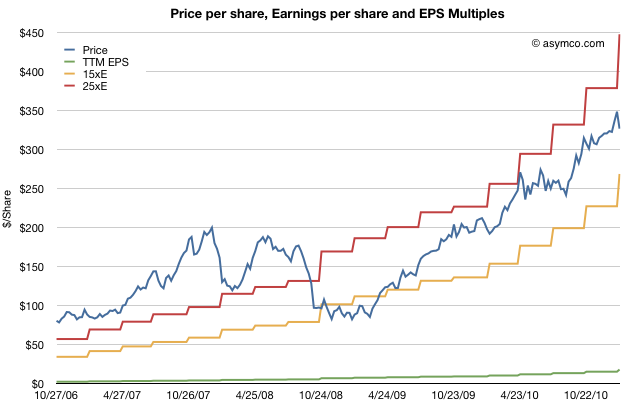
    The stock price has been rising but not outside a narrow P/E band. The following chart shows the stock price and the 15 P/E and 25 P/E bands that have bounded it for nearly three years.

    As previously observed, this overall share appreciation is not accounting for the growth in earnings.

    The trailing twelve months' earnings were $17.91 per share. Therefore the P/E ratio is now 18.2. Excluding cash, the P/E is at 14.7. However, that's based on 2010 levels of earnings. Those earnings are increasing very quickly.

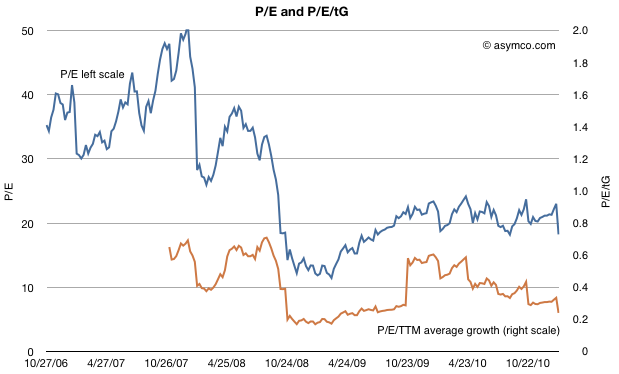
    To account for earnings and their growth, I developed the following chart which shows the P/E and P/E/trailing-Growth for the stock.

    The P/E is fluctuating on either side of 20 but when considering trailing growth, comparable companies, the macroeconomic conditions and guidance the value of the company is reaching new lows.

    P/E/tG nearing recession lows

    Earnings were 75% higher in 2010 than the year before. So based on the growth, the rule-of-thumb ratio P/E/trailing Growth (P/E/tG) is 0.24. This ratio (where 1.0 is seen as "fair value") is the lowest since July 2009, during the first months of recession recovery. The trend for this ratio is down (see the burnt orange line in the chart above). It's not far from hitting the lowest point during the recession at 0.17.

    Now I'd like to reminisce a bit about that point in time. The stock had bottomed at $78/share[1]. It was trading at barely 3x cash and a P/E of 11 but growing 3x that level (32% in the slowest recession quarter but averaging much higher).

    So today we are at a similar point in valuation. The cash is at $64/share, shares are priced 5x that amount and the growth is 4x P/E[2]. Although analyst targets are less comical, there is still the sense of extreme despondency when looking at the valuation ratios.

    Guidance, Comparables and Macroeconomics

    Unlike two years ago there aren't the same dark clouds on the macro horizon. The company is also not as cautious on its guidance (guiding 63% EPS growth must be a new record for a post-holiday quarter) and there is talk of bubble in valuation for comparable companies. Netflix, Amazon, and ARM have eye-watering valuations relative to growth.

    A discount to the S&P 500

    And to round out the tragic tale, Apple's P/E is, once again, at a discount to the S&P 500 P/E (14.7 vs. 16.57 respectively).

    Given the new low in valuation contrasted with optimism on behalf of many (including management), on some forums there is discussion about Apple becoming the target for a take-over.

    There is some perverse merit to this logic. With $64 in cash, $25/yr in earnings and 75% growth it's so cheap that if credit were available, it would make a tempting candidate. Private equity could take it private and use the gigantic cash flow to pay off debt (in about four years). In bygone days, this would have been an easy pitch.

    Alas, the capital markets may not have liquidity for the size of the market cap Apple holds and I don't see any competitors able to get the leverage for an acquisition either. Or can they?

    ---

    Notes:

    1. In early summer 2009 some analysts put 12 month targets for the stock at $70, so their predictions were within $6/share to today's book value.
    2. A buyer of shares two years ago would only have to wait two years to have 80% of their investment sitting in retained earnings.  An investor who read the data from Apple and knew that the iPhone existed could not fail but be amazed.