Want to experience twice as fast load times in Safari on your iPhone, iPad and Mac?
Then download Magic Lasso Adblock – the ad blocker designed for you. It’s easy to setup, blocks all YouTube ads, and doubles the speed at which Safari loads.
Magic Lasso Adblock is an efficient and high performance ad blocker for your iPhone, iPad and Mac. It simply and easily blocks all intrusive ads, trackers and annoyances in Safari. Just enable to browse in bliss.
And unlike some other ad blockers, Magic Lasso Adblock respects your privacy, doesn’t accept payment from advertisers and is 100% supported by its community of users.
As we move ahead into the September quarter, I'd like to review our outlook, which includes the types of forward-looking information that Saori referred to at the beginning of the call. We expect our September quarter year-over-year revenue performance to be similar to the June quarter, assuming that the macroeconomic outlook doesn't worsen from what we are projecting today for the current quarter. Foreign exchange will continue to be a headwind, and we expect a negative year-over-year revenue impact of over 2 percentage points.
We expect iPhone and Services year-over-year performance to accelerate from the June quarter. Also, we expect the revenue for both Mac and iPad to decline by double digits year-over-year due to difficult compares, particularly on the Mac. For both products, we experienced supply disruptions from factory shutdowns in the June quarter a year ago and were able to fulfill significant pent-up demand in the year ago September quarter.
We expect gross margin to be between 44% and 45%. We expect OpEx to be between $13.5 billion and $13.7 billion. We expect OI&E to be around negative $250 million, excluding any potential impact from the mark-to-market of minority investments, and our tax rate to be around 16%.
Luca Maestri, CFO Apple Inc., Aug. 03, 2023
In August Apple reported Net sales growth of -1% and EPS growth of 5.4%. My expectation is a 1% sales growth with EPS growth of 11.4%. This might be slightly optimistic but it's based on the following assumptions:
iPhone unit growth of -1.4% (y/y) but revenue growth of 2% (as per guidance, up from -2% previous quarter's growth).
Mac unit and revenue growth of -12% (this might be optimistic, low confidence)
iPad unit growth of -2% but revenue growth of -12%.
Services revenue growth of 12% (acceleration from 8% q/q)
Wearables 2% revenue growth (consistent q/q, down from 10% y/y)
I estimate the gross margin to remain at 44.5%, open to be $13.5 billion (low-end of guidance), OI&E at -$250 million (per guidance) and tax rate at 16%.
The number of shares I estimated at 15.666 billion (down 109 million, below 126 million average drop for last 8 quarters.)
To summarize, for the fiscal fourth quarter 2023:
Total revenue: $91.1 billion
EPS: $1.43
Revenue by segment:
iPhone: $43.5 billion
iPad: $6.2 billion
Mac: $10.0 billion
Services: $21.5 billion
Wearables/Home/Accessories: $9.8 billion
Gross margin on total revenue: 44.5%
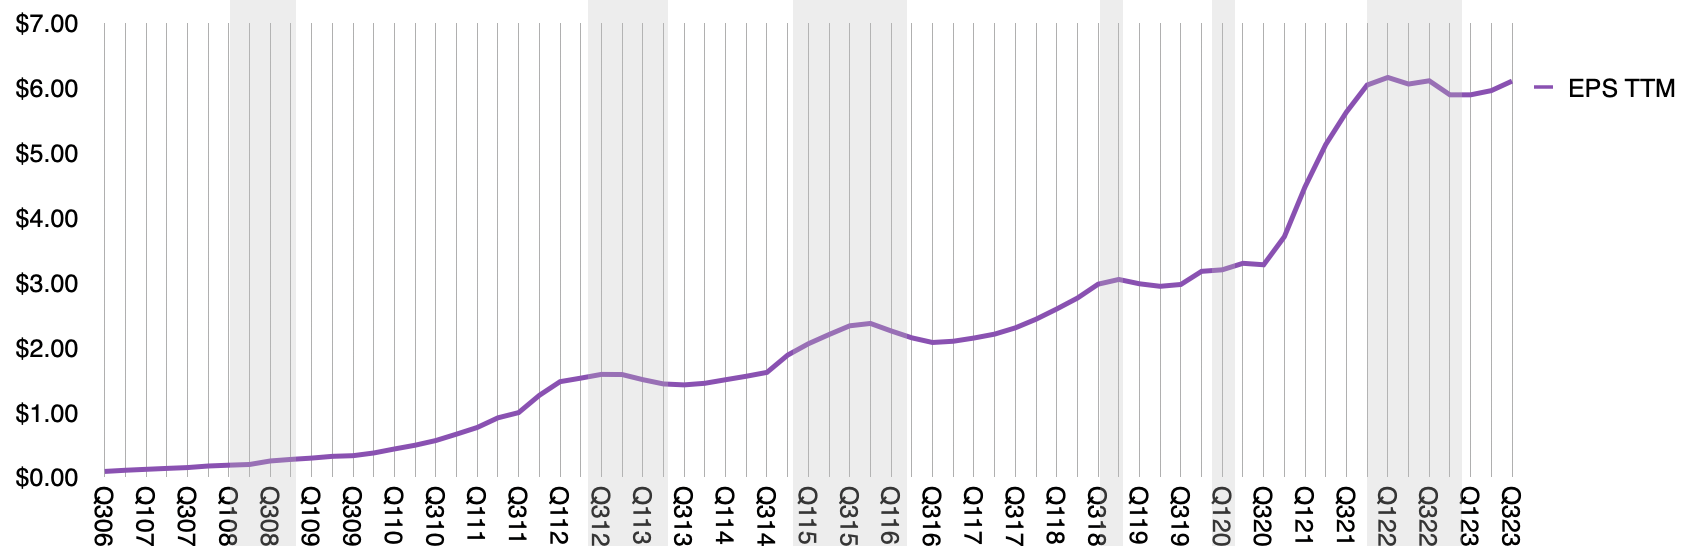
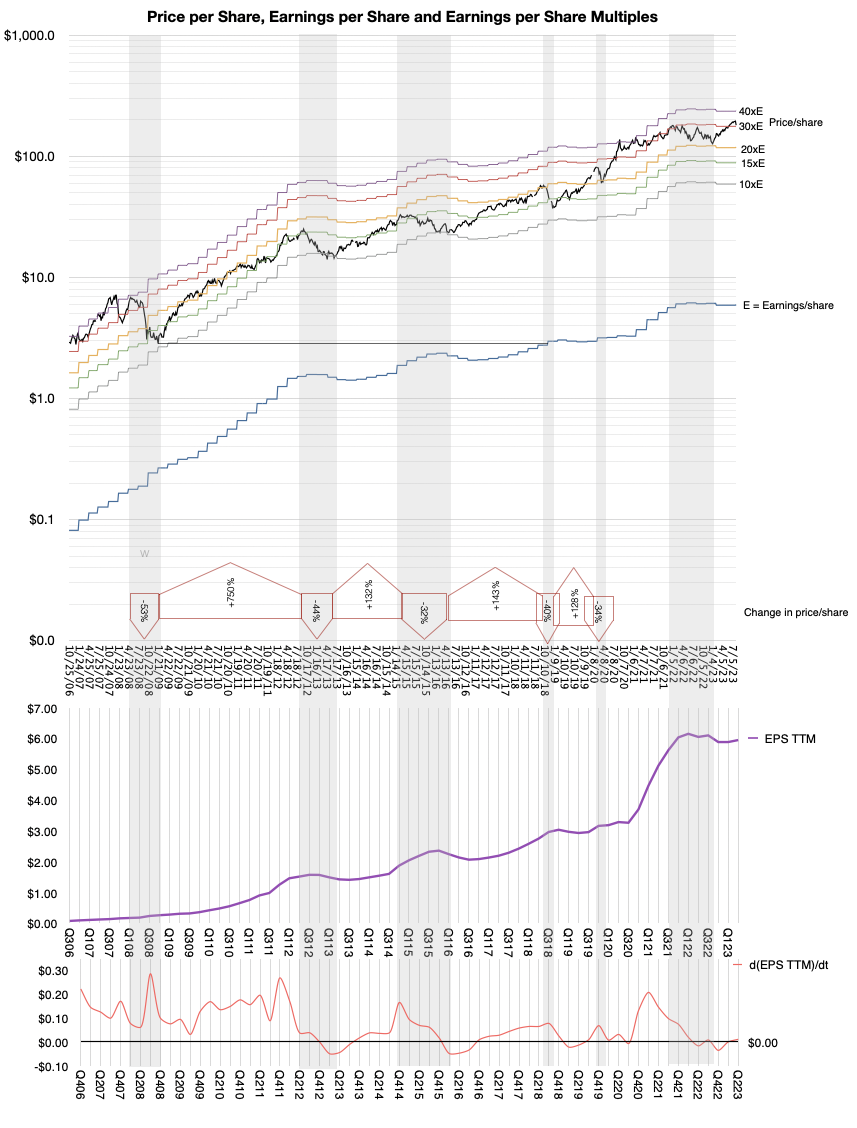
As can be seen in the following graph, my expectation is that the company will return to a pre-Covid growth trajectory (on a TTM EPS basis) after a transient surge and recovery due to the phenomenon of work-from-home and reduced travel. The uncertainty related to Covid is subsiding but macro and geopolitical uncertainties remain and the company continues to provide limited guidance.
Before the iPhone launched in late 2007, Apple was trading consistently at a P/E ratio above 30. Here is a table for the P/E ratio on each Friday's closing price from May to August, 2007. The iPhone launched on June 29, 2007.
Apple's P/E ratio around the iPhone launch
Date
P/E Ratio
5/23/07
31.5
5/30/07
31.6
6/6/07
34.1
6/13/07
33.7
6/20/07
34.6
6/27/07
33.6 (2 days before iPhone launch)
7/11/07
37.2
7/18/07
34.6
7/25/07
34.3
8/1/07
33.3
8/8/07
34.2
8/15/07
30.2
Apple was not super powerful but it was not doomed either. It was a time when the iPod was dominant and the Mac was still alive. iTunes re-wrote the rules of the music industry and debate was raging whether Apple should be considered a media company. Platforms were not its strength but Steve Jobs showed he was still able to distort reality.
These good times did not last. The first year of the iPhone was a period of minimal contribution from the new category with Apple still largely valued on the basis of the iPod. The predictions of failure for the new communications product, especially given its high price, were legendary. It wasn't until 2008 that the iPhone began accelerating and making a meaningful contribution to the bottom line.
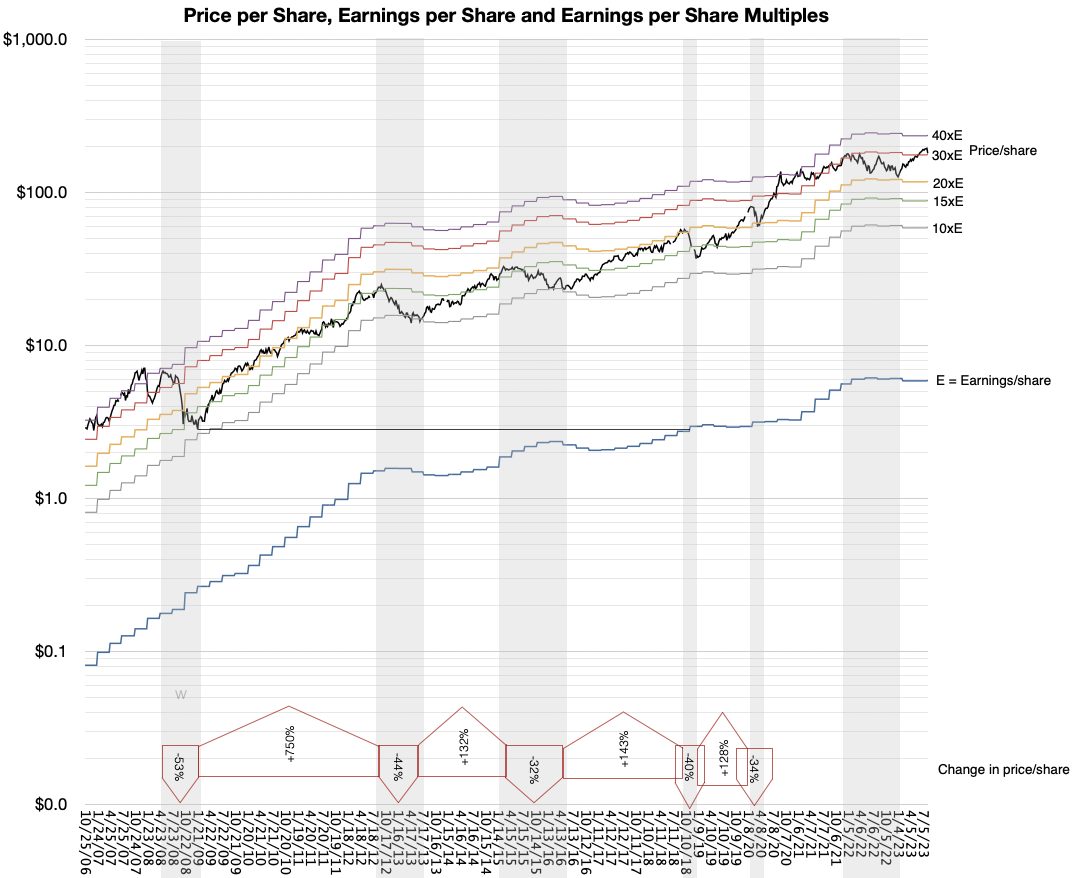
It was then, in late 2008, that Apple's valuation broke. The P/E ratio fell from above 30 to nearly 10. The following graph shows the catastrophic 53% share price collapse coupled to the triple digit surge in earnings which led to the P/E ratio tanking.
[The graph shows earnings per share for the trailing 12 months (blue line) and 10x, 15x, 20x, 30x and 40x that value (colored lines). The share price is the black line. The share prices are sampled every Friday. The graph is notably logarithmic. The grey shaded areas are periods of significant contraction. The percent drops/increases during these periods of contraction/expansion are shown in the annotation arrows near the bottom.]
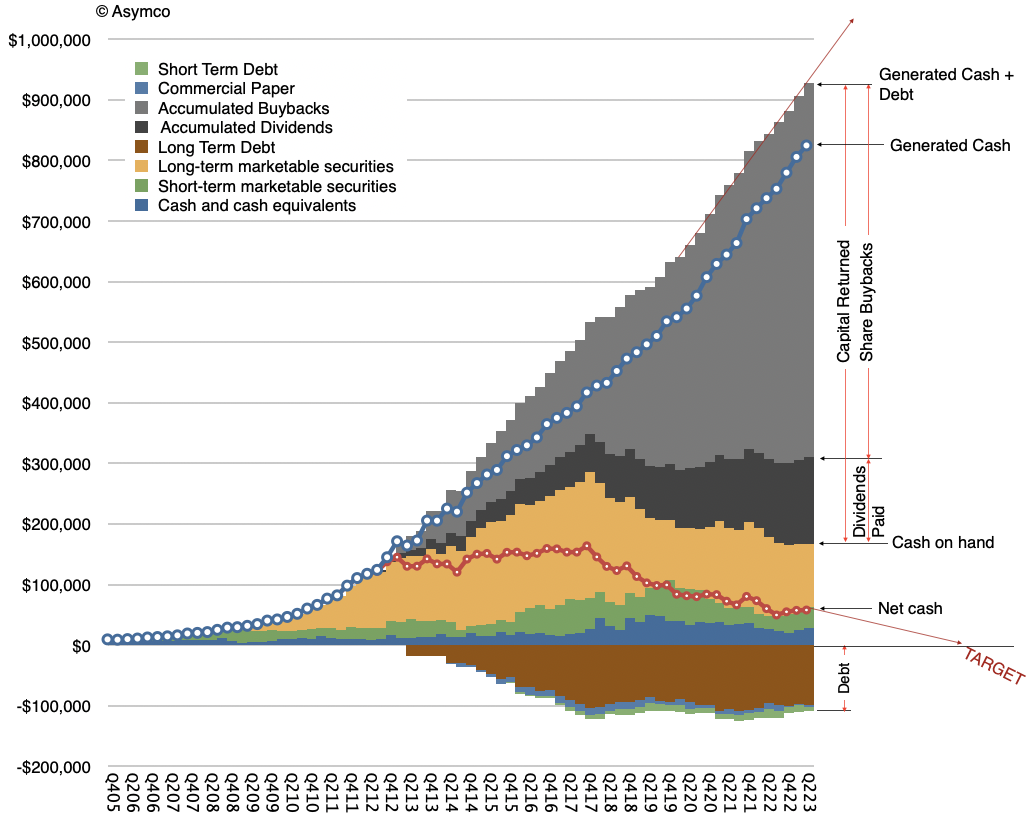
The valuation remained broken for 12 years, between late 2008 and late 2020. This period being, arguably, the most remarkable wealth creation event in history of business. For evidence see the following graph showing the amount of retained earnings returned to shareholders building inexorably toward one trillion dollars. This is not share price appreciation but cash returns. [If you have evidence of a larger wealth-creation event do let me know.]
The creation of $800 billion of shareholder wealth at fire-sale share pricing.
As I explained throughout this period, motivation to dispose of shares which create immense wealth is explained by the fable The Goose That Laid the Golden Eggs but the question some are asking now is whether more wealth can still be created, and if so, can we expect Apple's valuation to collapse accordingly?
I should note that during the long, dark years of wealth creation, other technology companies such as FaceBook, Amazon and Netflix, Google (so-called FAANG) and Microsoft enjoyed far higher multiples than Apple, sometimes 3x higher. This was not seen as abnormal by analysts because those companies were always assumed to have higher growth potential, with a diverse portfolio of opportunities while Apple's growth was perpetually in its past, based on one product.
Paradoxically perhaps, since the Covid-19 pandemic Apple shares have enjoyed P/E ratio roughly equivalent to the other tech companies. For instance, peaking at 42 in January 2021, the P/E ratio has averaged about 27.5 since then. Simultaneously, diversified companies such as FaceBook (now Meta) and Netflix collapsed due to serious business model flaws (based on single sources of income) and Google (now Alphabet) and Amazon have slowed growth and are facing anti-trust scrutiny. Having lost any presence in mobile computing Microsoft has become entrenched in enterprise, finding new businesses in cloud and (possibly) generative AI. As a result of these reversals, the contrast between Apple and the mega-cap cohort has become fuzzy.
So back to the question: does it make sense to price Apple in the 30x P/E or should it go back in the gutter at 10 to 20?
I would argue that the big change in perception hasn't been the surge in earnings during Covid (see graph below). The big change is the realization that Apple is no longer about to go out of business.
How could Apple not be going out of business?
Remember that a P/E ratio in the teens is a clear signal from the market that the company is a questionable "going concern". This is parlance indicating doubt that the company will continue in its present form..
What has changed since 2020 is that even though there were a multitude of crises—from war to pestilence—the eggs kept coming. Perhaps, perhaps, Apple was not doomed after all. In that time it managed to create 1 billion customers. Perhaps having 1 billion customers was a positive outcome. Perhaps counting iPhones during a single quarter was not the only way to value the company. Perhaps having 1 billion satisfied customers made it viable. Perhaps having 1 billion satisfied and loyal customers returning every year was interesting. Perhaps having 1 billion satisfied wealthy customers meant the end is not around the corner. Perhaps having 2 billion active devices in use was sustainable. Perhaps providing services to 1 billion customers using 2 billion devices delivered through 1 billion subscriptions made some sense. Perhaps having all this data in a linear graph made it predictable?
Perhaps. Though Apple provided updates on these figures regularly, the questions everyone asked were still on unit shipments (which Apple stopped providing.) While Services grew at double digits and 70% margins the questions from analysts on conference calls persist on the iPhone and currency or production "headwinds". Perceptions take time to change. They are still changing.
Maybe at this point it's time to agree that Apple's end will not come through being easily replaced by the competition (first Windows then Android, etc.) but by having access to its markets restricted. Being the only American company to have cracked the China puzzle, it's surely vulnerable there. And please don't mention India.
Apple is no longer doomed because it's too weak. It's doomed because it's too strong.
It seems that it's not too hard to believe the end is still near.
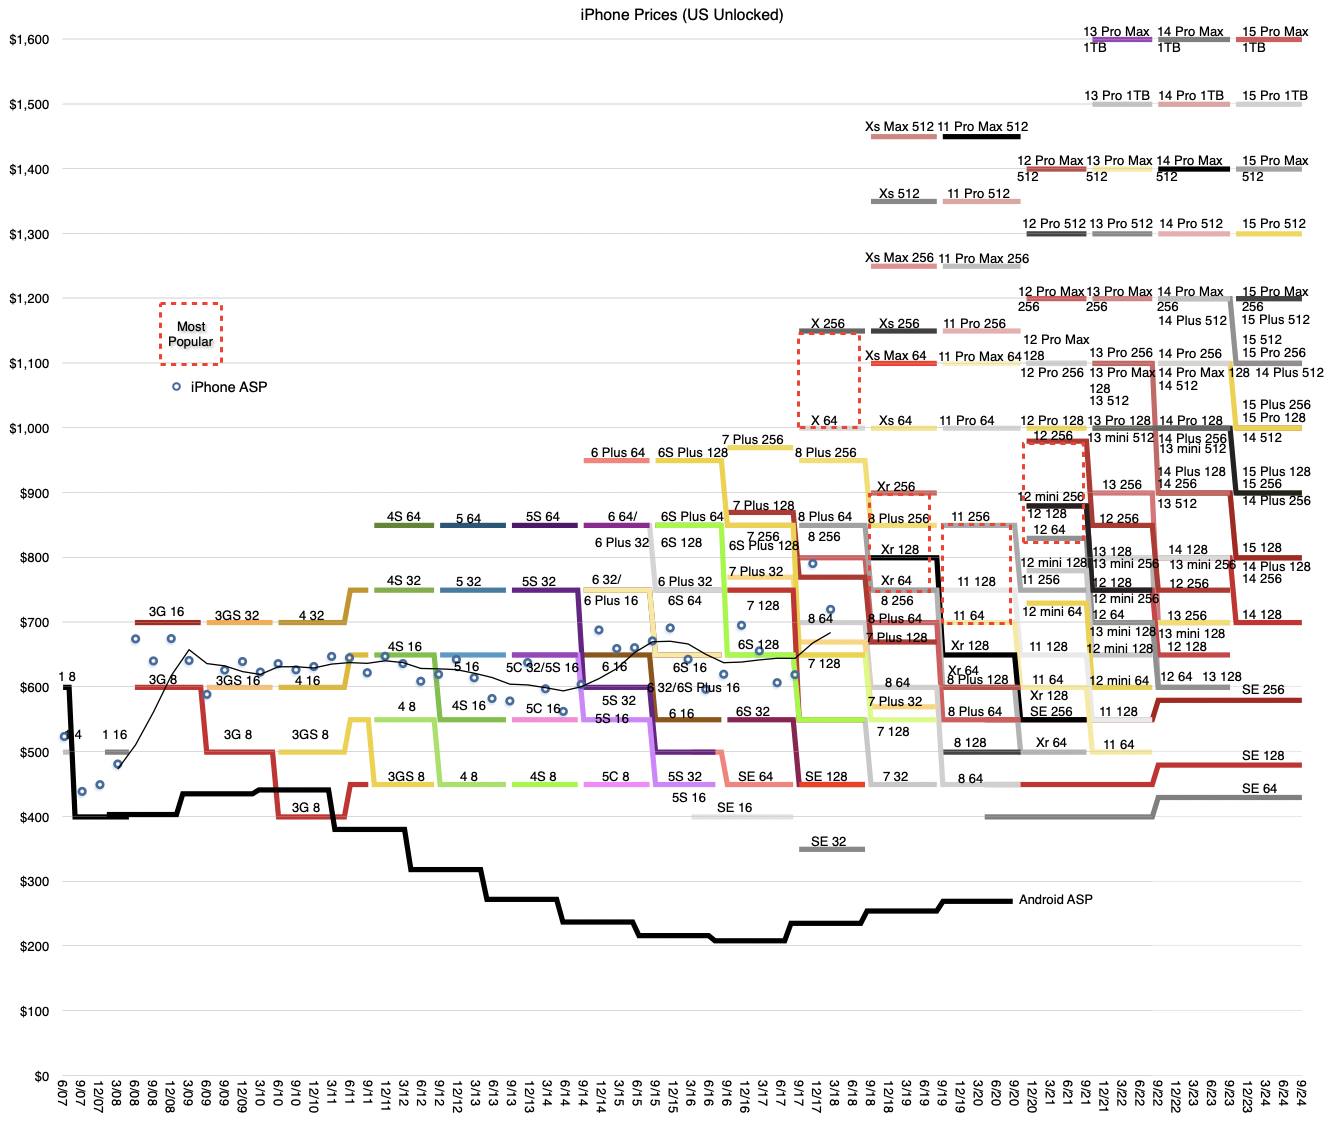
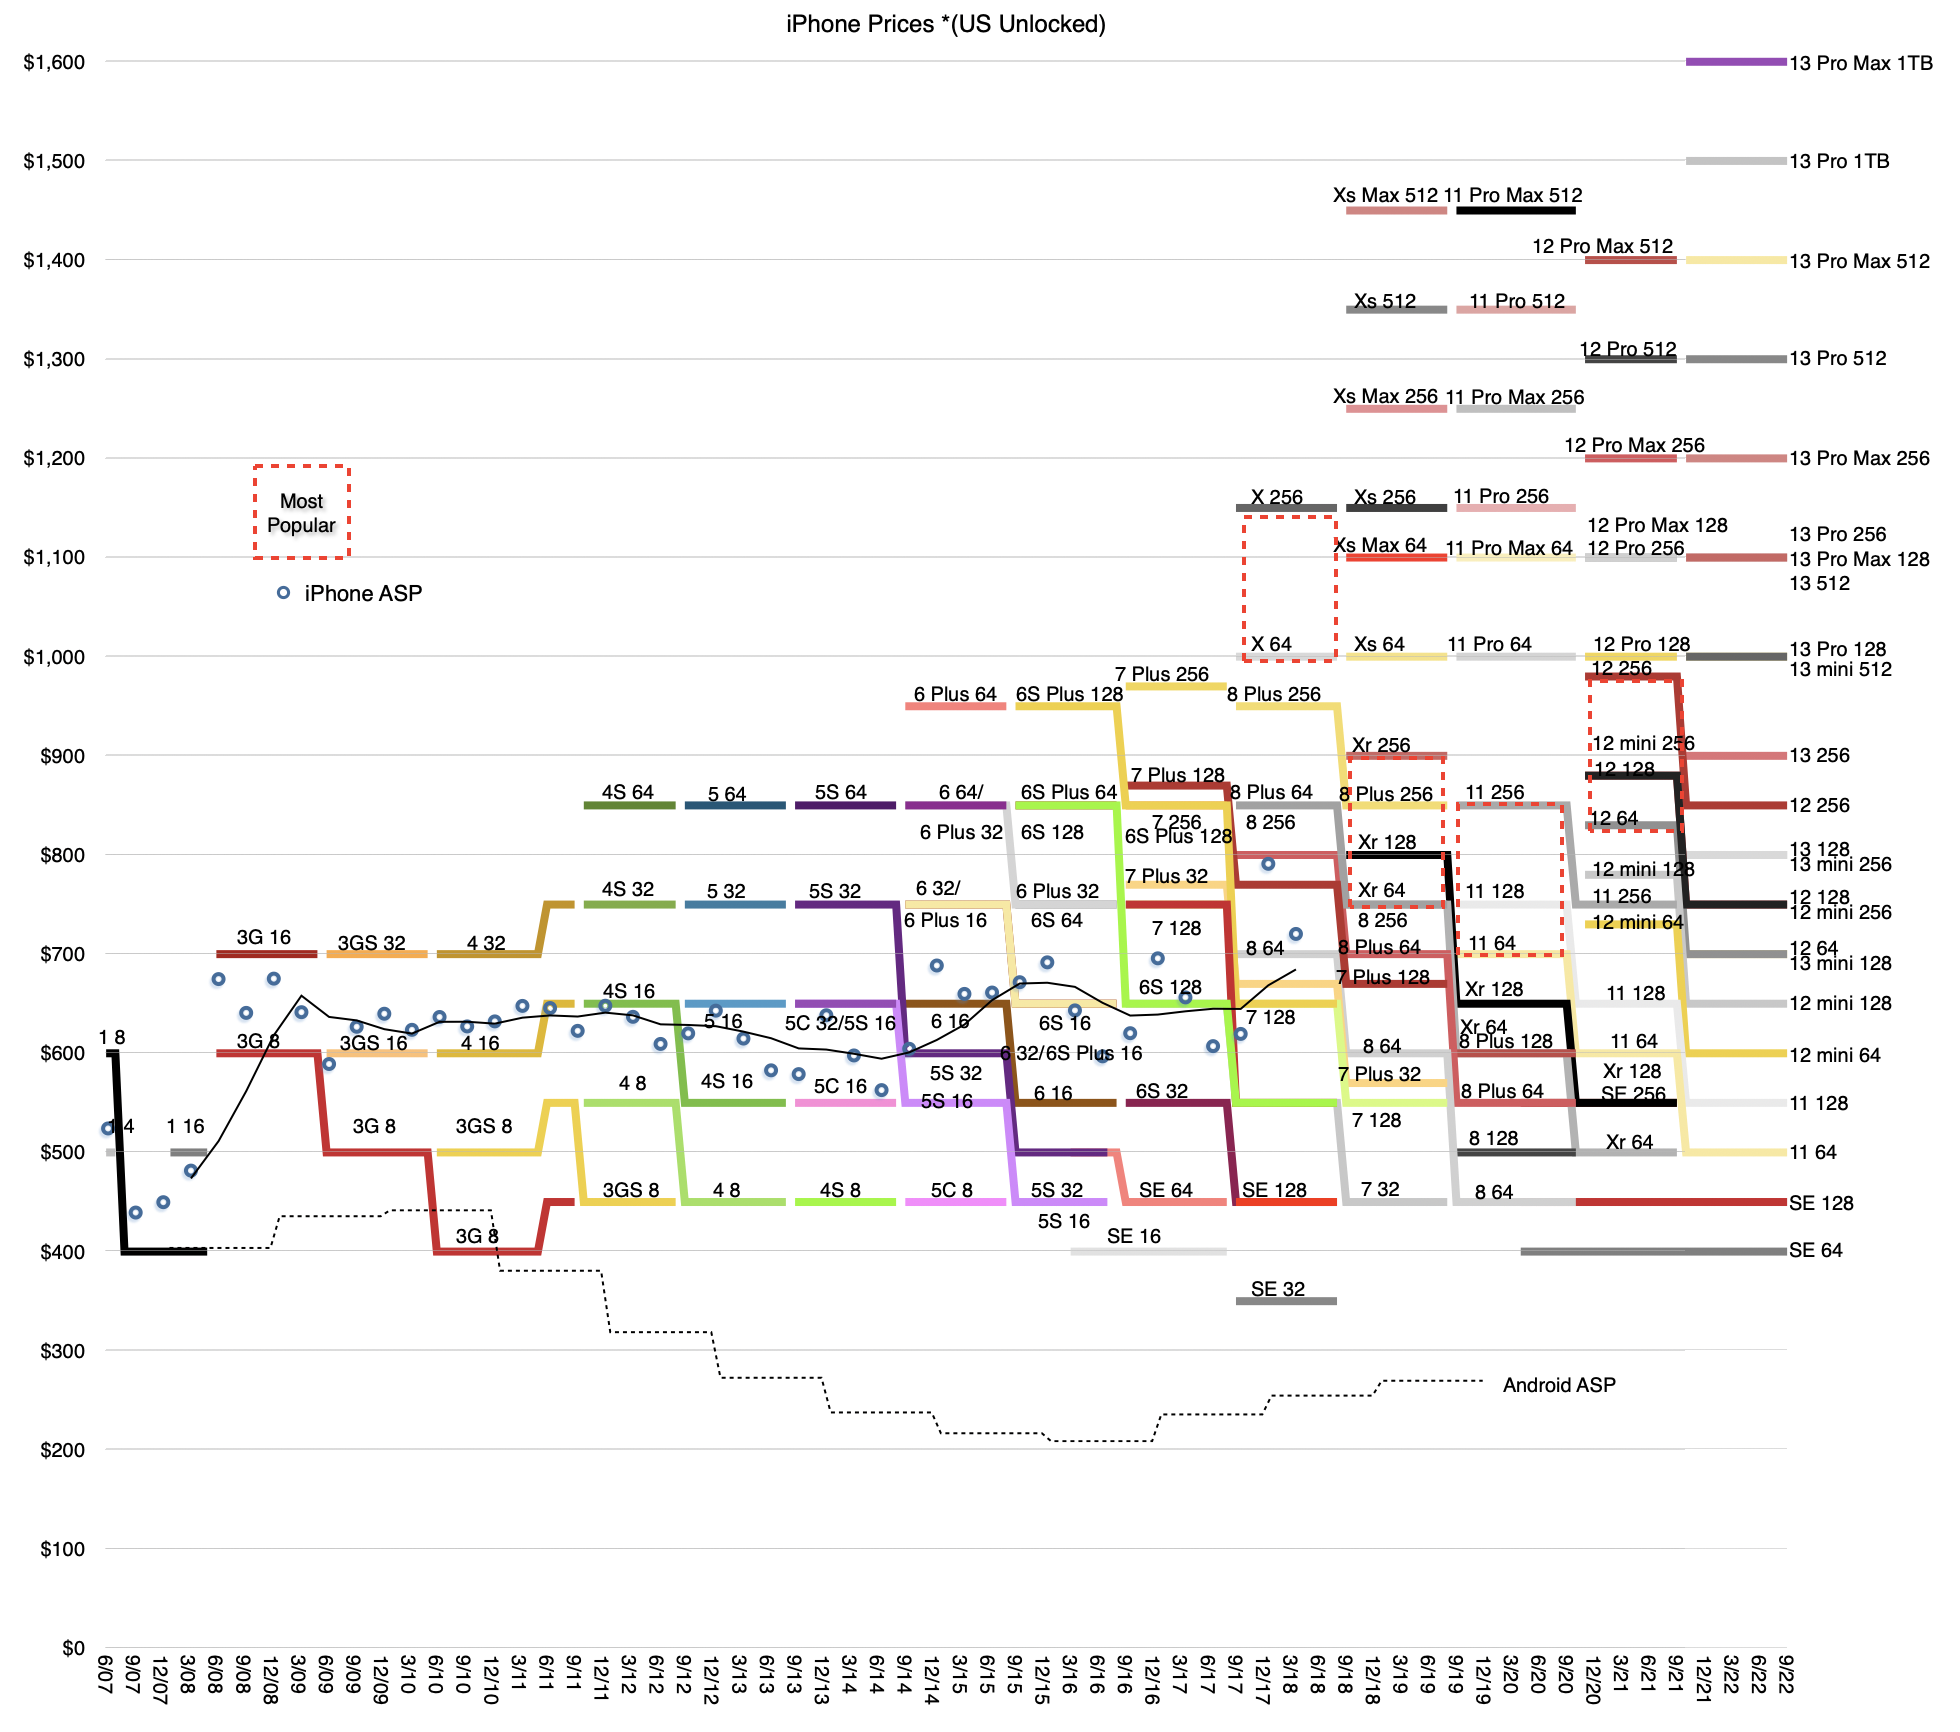
iPhone 15 has just been released and, as usual, all the products in the iPhone line-up have received new prices. The following graph shows the current product line-up (US prices before tax) and the historic price points for all the previous versions of iPhones since inception.
It was amusing before the launch to see reports that the iPhone 15 would see a price increase. If I were a betting man I would have bet against it. The reason is that, as the graph shows, pricing changes are regularly made every three years and the last one was in 2021, two years ago. It would be an extraordinary claim to expect a price increase this year.
Also, as you can see, price increases only occur when there is a new "top-of-the-line" model introduced. This new highest spec, usually, but not only, in memory, justifies the new top of the range. For instance, the top of the range in 2015 was the 6S Plus with 128GB of storage. Three years later is was the Xs Max 512GB. Three years later it was 14 Pro Max 1 TB. In nine years the top memory increased by an order of magnitude but the top size also increased as did the number of cameras. Naturally, the price increased by about $650.
Therefore we can predict with some comfort that the next "highest price" point will be $1699 for the iPhone 16 Pro Max 2TB, or equivalent. The possibility exists that the iPhone 16 Pro will also include a leap higher in optics and have more technological tie-ins with Spatial Computing.
But this highest price point is not necessarily the most common price point. Indeed, we can guess that the most common point is visible in our graph above. The density of product choices increases toward the middle of the range. The highest and lowest price points are populated with one product. The middle price points from $800 to $1,100 are populated with\ three products each. Therefore a good guess is that the $900 is likely most popular and that the average selling price is also very near there.
Note that the average sales price (ASP) has not been available from Apple since 2018. At that time the ASP was $790 (holiday quarter of 2017). A gradual increase to $900 over five years is not unreasonable. In fact, it probably should be higher given inflationary pressures. We can only guess.
We have to understand that Apple does not set pricing in response to competitive pressures, commodity pricing, inflation, currency exchange rates or internal sales or margin targets.
Pricing is sacred and is a decision made based on consumer understanding.
The anecdotes of Steve Jobs preferring certain price points because of their poetic value are legendary. 99c for a song sounds right and looks good. The iPod was priced in lovely, alliterative $100 increments. Same logic applies to services.
Pricing is an art and when you see the spectrum above you also see how the increments nudge the decision process. Pricing is a signal. It's a conversation between seller and buyer containing information that both parties will exchange. On the part of the seller it suggests both the cost of the offering and the value it provides. Buyers are inclined to see if they can stretch to the next higher increment given the increased value proposition. Once their decisions in the collective are tallied, the seller knows well what buyers prefer.
Apple has been having this conversation for decades and it shows.
After the Apple iPhone 15 launch event of September 12, 2023 I was a guest on the Claman Countdown show on FOX Business News (FBN) and here is the video.
In advance of the event I was asked for a few thoughts that might be topics I would like to discuss.
My answer was:
Apple has been pushing hard on imaging in their iPhone evolution. It has also released the Vision Pro that offers so-called Spatial Photos and Video. There is speculation that there will be some linkage at some level with Vision Pro and iPhone imaging. I do wonder if we’ll get hints of possible new optics that can support the Spatial Photography
Remember that Apple hinted at Spatial capabilities with its iPhone Lidar sensor some time ago. Apart from better focus at night, there was little purpose for laser distance measurements in a 2D photo device.
Additional Apple Watch health features are also always interesting. Apple’s efforts in health are hiding in plain sight and point to major value proposition to a large audience that skews older."
Based on this, I'm rather happy to see the support for Spatial Photos and Videos in iPhone 15 Pro. The surprise on the watch was not a new Health feature per se but the Double Tap interaction mode.
Also of interest to me was the Roadside Assistance via Satellite. This will be a very well received feature and many news stories will be written about it.
As I remember it, at least 10 years ago, I began to hear anecdotes from developers who built apps for both iOS and Android about their economics. The story is that they tended to have twice as many users using Android but that iPhone App Store revenues were roughly twice those of Google Play Store. From that I devised a rule of thumb that an iPhone user was about 4 times more valuable than an Android user. Half the users, paying 4 times as much means double the income.
Over the years I came across a lot more data about market development (the diffusion of innovations) and market creation (the innovation process) and applied it to transportation. Along the way I also became more aware that figures of consumption and spending are not normally distributed. That it turns out that the governing function of much of human behavior is log-normal. That is, it is skewed rather than balanced or symmetric around an average. Classic examples are income distribution and the distribution of travel distances.
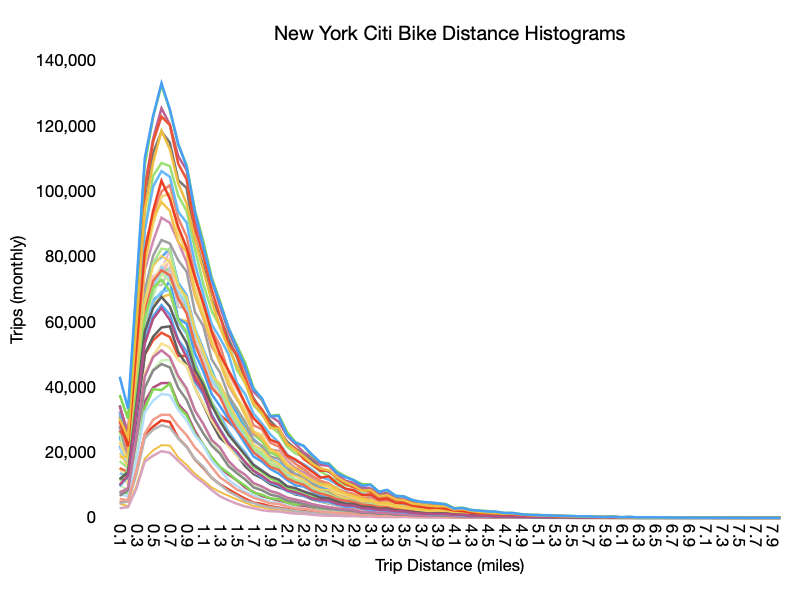
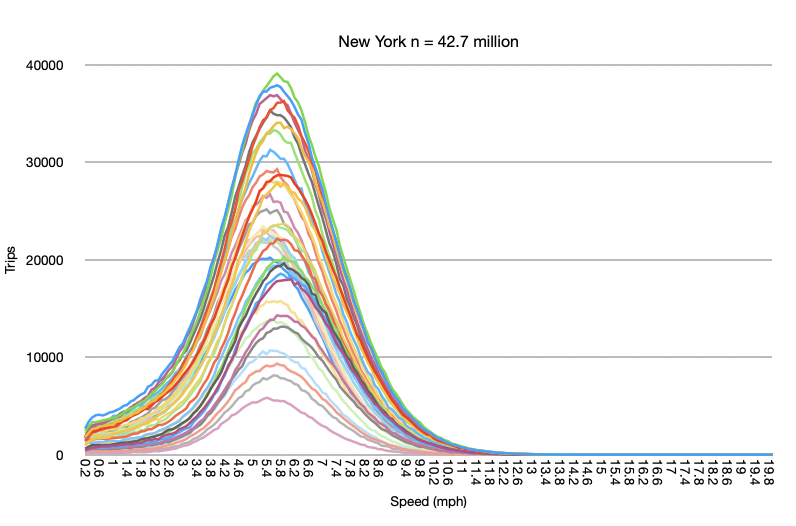
Consider the following diagrams: Trip Distances vs. Trip Speeds for New York Citi Bike travelers (n=42.7 million.)
The different lines represent different time periods spanning the months of the year.
The top graph shows that most trips are short, and the average distance is not the most common distance. The bottom graph shows that the average speed is the most common speed. The top graph is very accurately modeled with the log-normal function. The bottom graph is the classic bell curve of the normal or Gaussian function.
Income is log-normally distributed and so it has to be with services revenues. There must be a definite skew where there is a disproportionate spend by those who have more income. Thus segmenting or, to put it less kindly, discriminating customers properly is super important. Customer quality is just as important, perhaps more so, than quantity.
So let's revisit the question of user quality for online services.
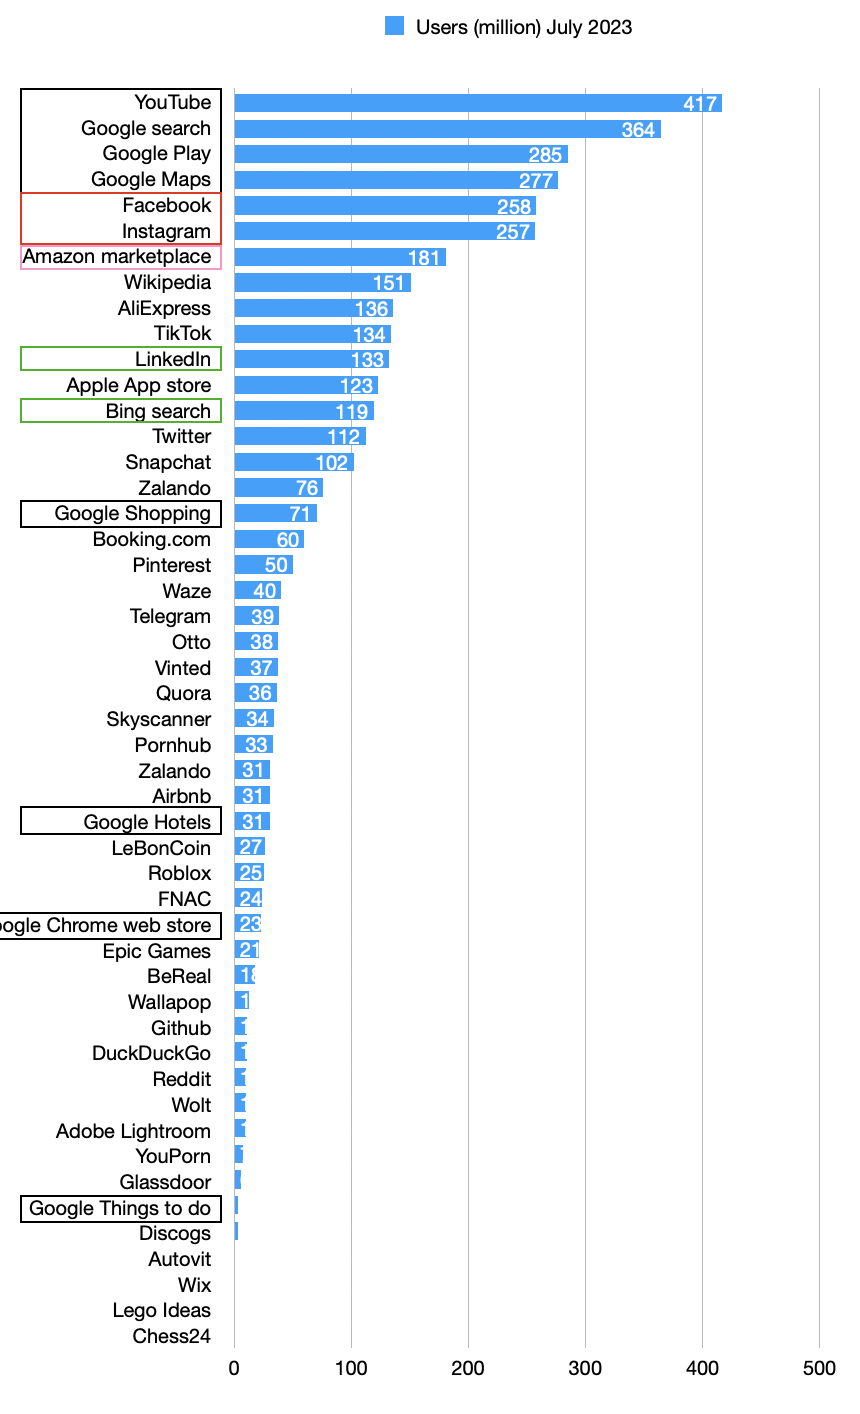
Unlike 10 years ago, there is a lot more data. The EU, for instance requires a report of the number of users on each platform.
The figures I want to focus on are those of Apple App Store and Google Play Store: 123 million and 284.6 million respectively. These are strikingly similar to the ratio of 2x between iOS and Android from my old anecdotes. However, if we look at global data, Apple claims 650 million active App Store users while Google claims 2.5 billion active users. That makes the global ratio closer to 4x Android. However, if we look at the US, the ratio is 167 million iPhone users vs. 144 million Android. In the US, iOS is a majority.
This is explained by income. The wealthier the user base the more iOS seems to be in use.
Now let's look at revenues for the platform stores.
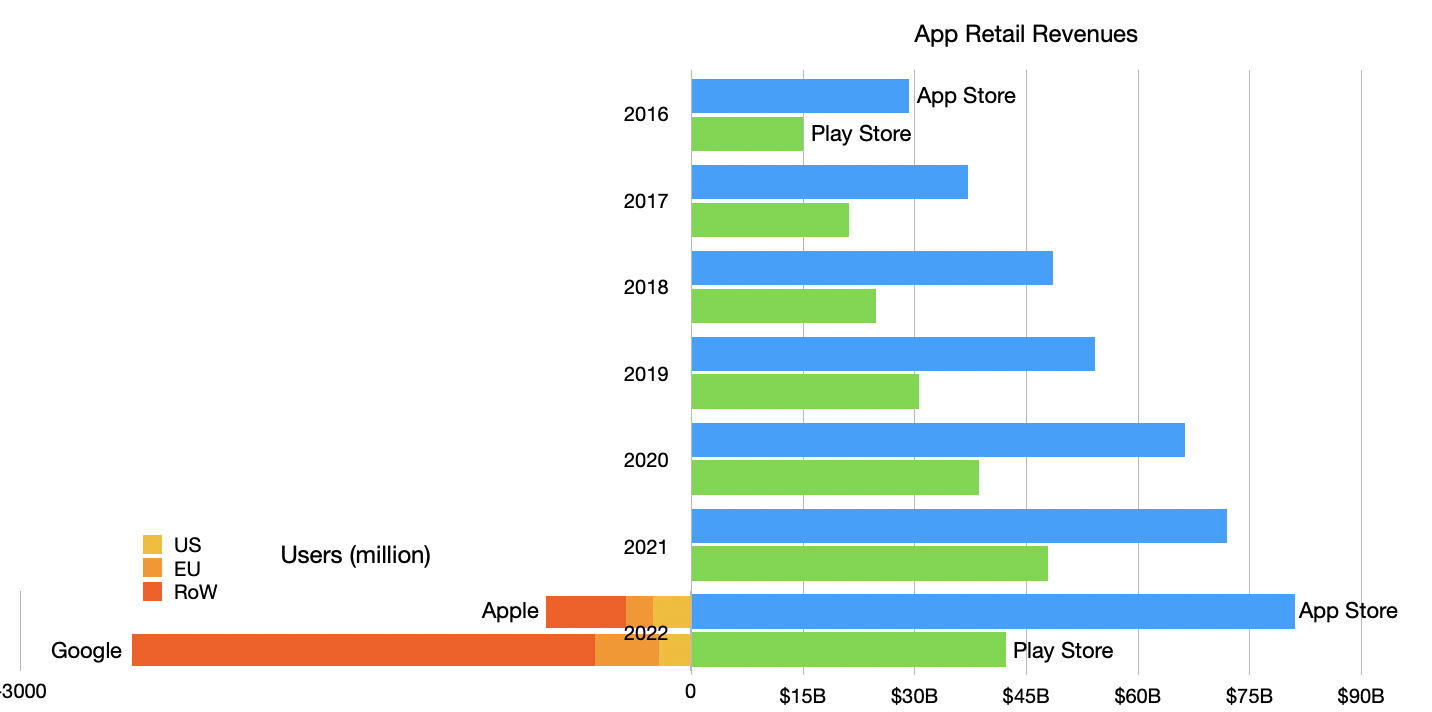
On the right side is the history of retail revenues by year from 2016 to 2022 and split between Apple App Store and Google Play Store. Mirrored on the left is the number of users, also split by store but also by region, but only for 2022. [App Store revenues are my own analysis (with validation against other sources) and include billings not just Apple's own cut. Play Store revenues are from Business of Apps.]
The ratio between revenues has kept remarkably steady, with 2016 revenues at a Apple:Google ratio of 29:15 (1.93) and 2022 at a ratio of 81:42 (1.93).
The global user numbers are, as mentioned, 3.8 to 1.
[Aside: One sanity check on the data is that the 650 million App Store users is about half of my estimate of iPhones in use (1.2 billion). That might be alarming. Why are only 54% of iPhones in use paired with App Store use? However, if we take the sum of both App Store and Play store users (3.15 billion) and compare it with the total number of global smartphone users (6.92 billion), we discover that 45.5% of all smartphone users use some store. Adding Chinese Android stores we can see that the ratio of 54% for iOS is somewhat consistent.]
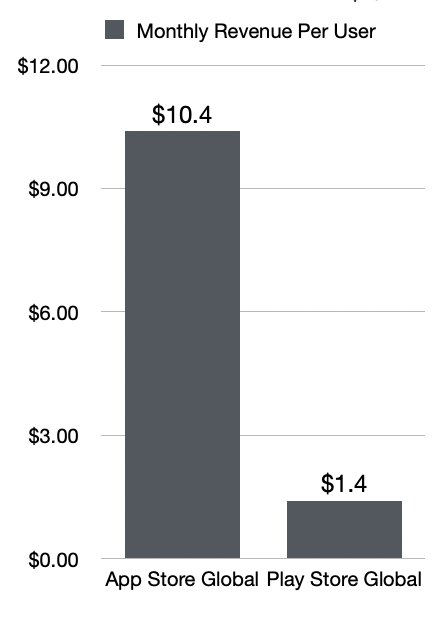
Thus we can compare the app revenue per user of the two platforms by dividing global revenue number by the global user numbers. The results are shown below:
I scaled the spending to a per-month basis.
So the picture becomes clearer. The iPhone customer is 7.4 times more valuable than the Android customer. This is more impressive than the 4x rule I had 10 years ago. The reasons are mainly that my anecdotes were from developers who sold products in the US or EU whereas expansion of smartphones to 7 billion global users has drawn in more lower spending customers.
But Apple's base has also grown to over 1 billion users (650 million store users). This highlights that Apple has effectively grown and discriminated customers effectively. It obtained not just 1 billion customers but the best 1 billion customers.
How to discriminate effectively is the holy grail of marketing. The naïve approach is to keep prices high. But that usually only results in a "luxury" branding and a small base that tends not to grow. The alternative "premium" approach is to offer functionality and multiple tiers and distribution options and financing and merchandising. There is no simple formula.
The bottom line is that Apple's approach is attracting 650 million $10/month app spenders. When we factor in additional subscription services, we get to the juggernaut that is Apple Services. This analysis has shown how difficult it is for anyone to come close to this quality of revenue.
As we look forward to Spatial Computing, the idea of increasing that spend from $10/month for a small glass rectangle in your palm to perhaps $100/month for an immersive 360-degree 3D experience does not sound too crazy.
But only if you can find those customers. I suspect Apple already knows who they are.
If you want to learn more and hear an in-depth discussion on this topic make sure you subscribe to the Asymetric Podcast on Supercast and Apple Podcasts.
The data is finally out. Apple Services and perhaps Apple itself can be quantified and predicted as never before. As we shall see this data changes almost everything we know.
It is even more shocking that this most important data set has been released by Apple itself. (Though it did so in order to comply with regulation, Apple did offer a bit more detail than was required.)
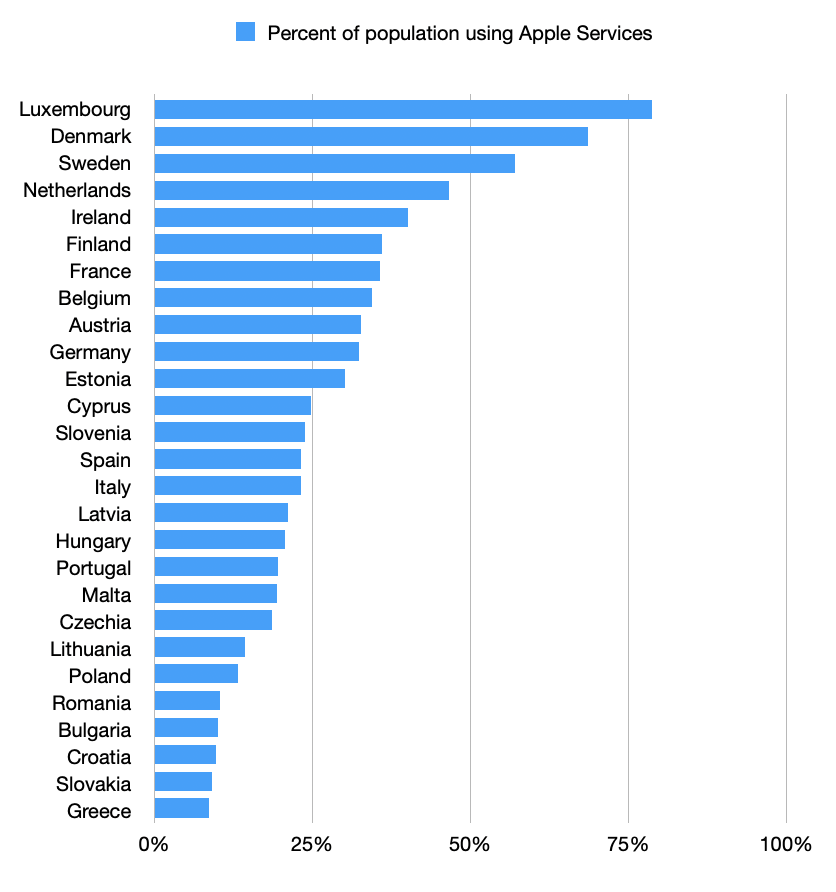
What the data shows is the number of average monthly active recipients in the EU of Apple-provided data services, calculated as an average over the period of the six months to 31 July 2023. This number is 123 million.
In addition, if you follow the link, you can see the number of recipients broken down by Member States. I summarize this data below.
Note that my summary is not that of the absolute numbers of recipients but the percent of population that these numbers represent. Note further that for some of the states with less than 1 million total recipients, estimates had to be generated. These were done in order to complete a total of 123 million. You'll have to trust me that these estimates make sense.
This release of data might be amusing for the ranking we obtain, showing which countries' citizens are more likely Apple fans than others. Seeing, for example, that the nordic countries show more affinity for Apple than the balkans; whatever that implies.
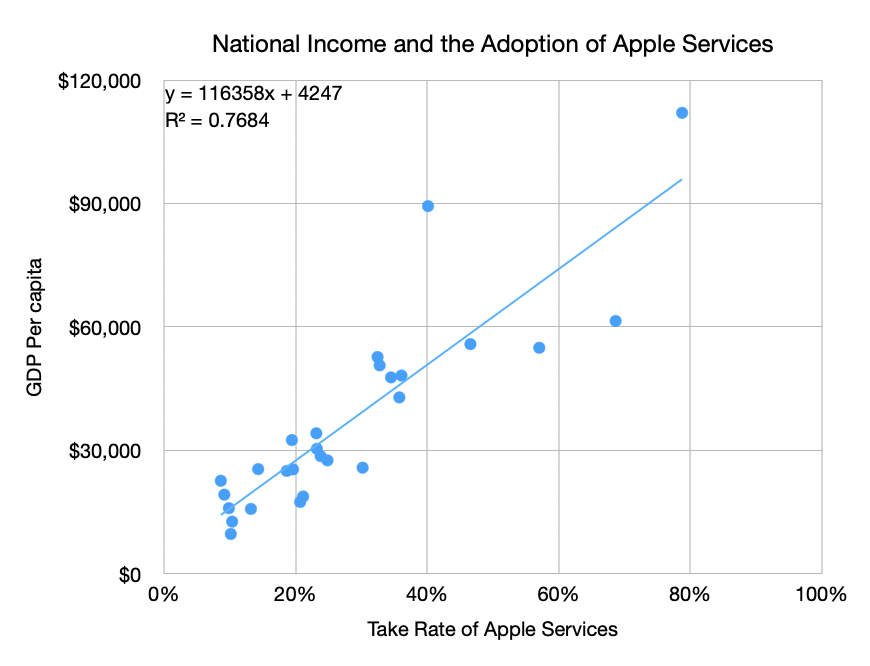
But a geographic categorization is banal. What would be more interesting is to look for a proxy for Apple adoption that is predictive. I know what you're thinking: it's obvious, look at income. More precisely GDP per capita. The data yields the following.
Please keep in mind that some countries might have missing or outdated data, and the values presented here are based on information available up to 2021. Note that there is one outlier. That data point around $90,000 and 40% adoption is Ireland. It's an outlier because the GDP income for Ireland includes the large number of multinational firms based there. That includes Apple, Facebook, Google and LinkedIn, etc. which pull GDP above what would be assumed by GNP.
With Ireland the data fits with the coefficient r-squared of 0.77. Without Ireland it's 0.85. This seems good enough to me to estimate the relationship of Apple Adoption ~= (National Income - 4247)/116,358. The trend line in the graph above shows this relationship.
What are the implications?
First, the ends of the line need to be finessed. 100% Apple Adoption is suggested at income of $116,358/yr/capita. Also, 0% Apple Adoption happens below an income of $4,247/yr/capita. Now both of these are problematic as there are known adopters in countries with income below $4,247/yr (more about this later) and there are countries with income above $116,358 which cannot therefore have more than 100% adoption (or can they? This makes a good trivia question.)
These anomalies should encourage us to look further. What if we apply this formula for countries outside the EU? To answer this, I generated a country set with about 190 entries and applied the pattern seen within the EU country set (n = 27.)
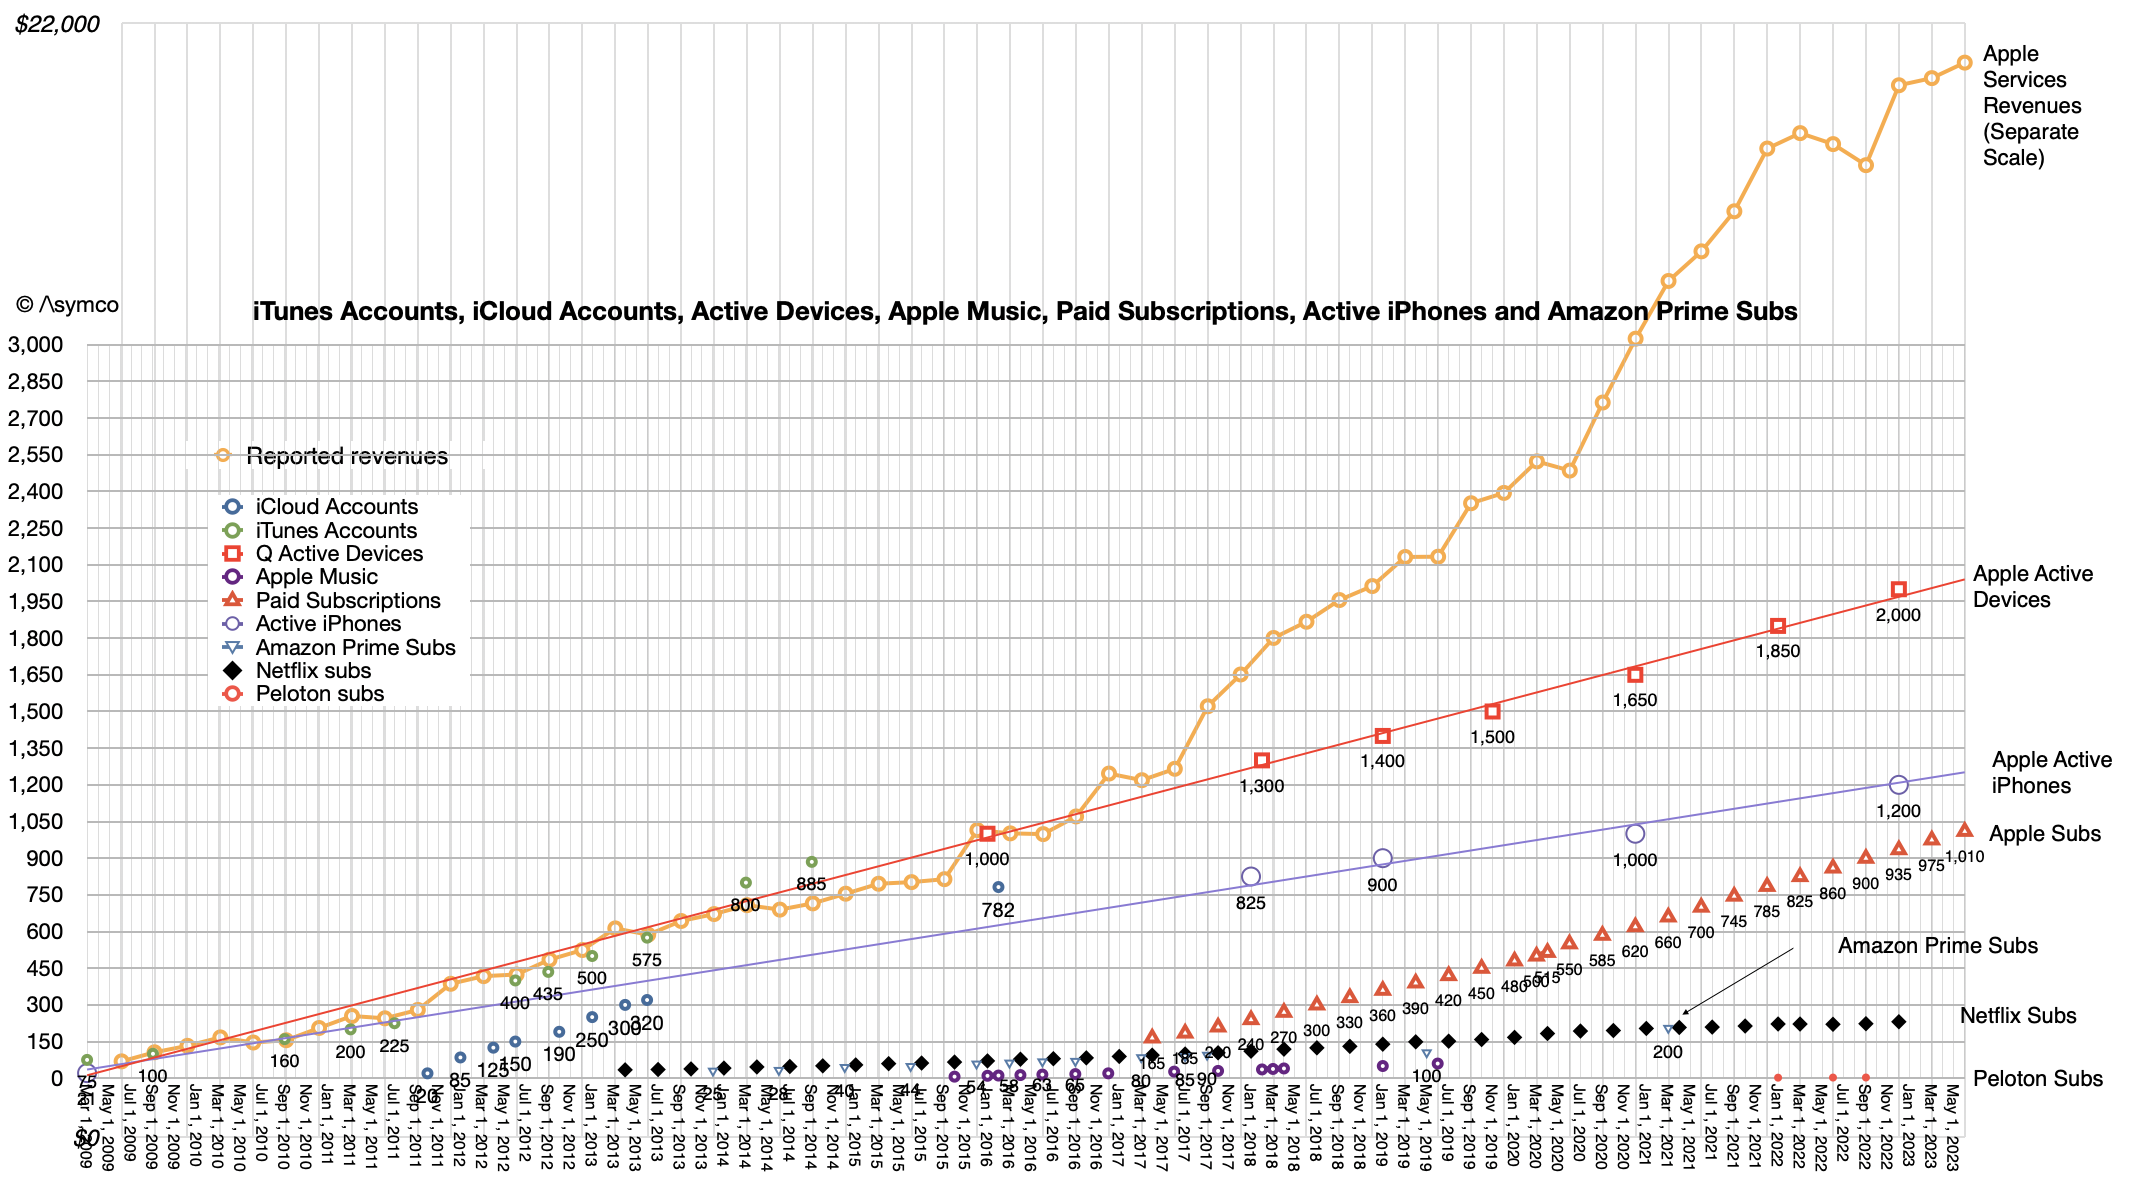
Knowing the GDP per capita for all countries as well as population size, we can estimate the global total of Apple services subscribers to be 560 million individuals. Note that Apple reports 1,010 million total subscriptions but that includes multiple subscriptions per subscriber and subscriptions to services which for Apple only acts as guarantor through the Apple App Store. Overall data on Apple Subscriptions (and other details) is provided below:
Note that we know the total active devices to be over 2 billion and the active iPhones to be about 1.2 billion. This implies that about half of iPhone users have an Apple-owned subscription and that over half of the subscriptions Apple manages are for its own services.
What's more, we can obtain a detailed list of expected Apple Services users for each country. An example would be 5.8 million users in Mexico or 1.7 million in New Zealand. [I could furnish this on a country-level in a newsletter, if anybody is interested please let me know.]
It also allows us to understand the potential for countries which currently are below the model's threshold of income. That list consists of 88 countries with a combined population of over 4 billion. They will join the Apple ecosystem, it's only a matter of time. Can we predict this? I believe so. Stay tuned.
The story of Apple Services is only getting more important but also more detailed in terms of data and analysis. Readers of this blog have been well prepared for what happened and Apple has followed through with gross margin data and now with some limited country-level data.
As we move into the era of spatial computing, services will only matter more and it's imperative that observers of the company stay on top of the data with solid modeling.
Just recently, the 2 billionth iPhone was sold. Unlike the 1 billionth, there was no announcement, no celebration. Partly this is because Apple stopped reporting unit shipments, but partly it's because it's not as interesting to talk about 2 billion as it is about 1 billion. There is a desensitizing when numbers get that big. What happens after you achieve the status of the most popular and valuable product of all time? How much more better can the world absorb?
Before we answer, let's reflect on how it's going. The iPhone is doing better than ever.
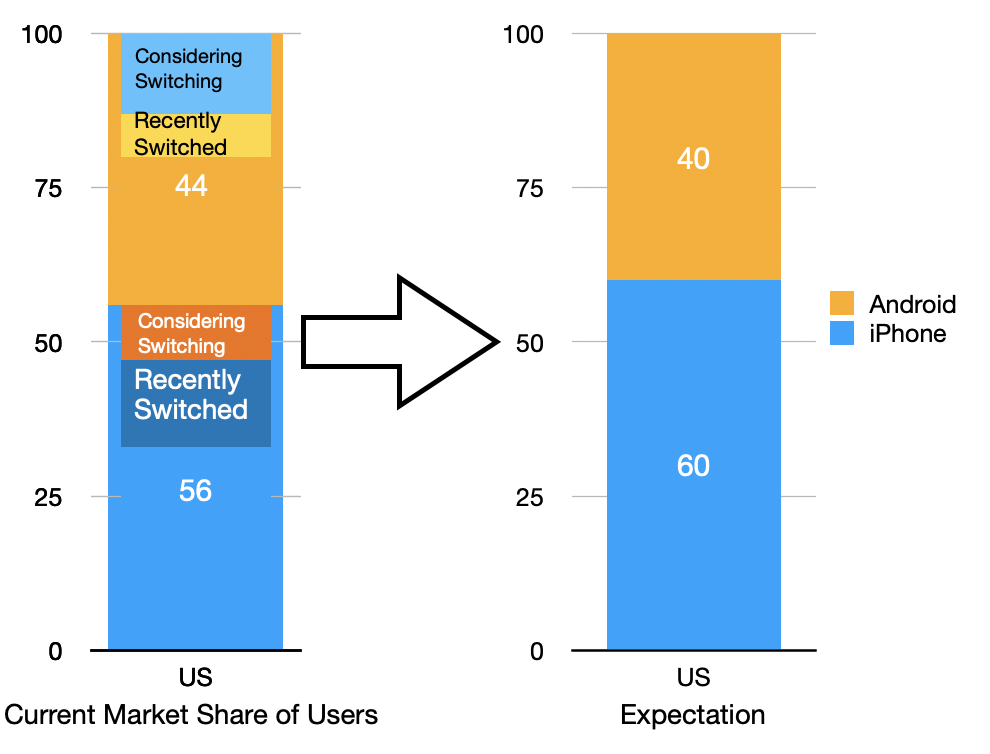
There are more than 1 billion iPhone users. The total number of users has been rising steadily. iPhone users make up about 26% of all smartphone users (3.8 billion is the current estimate). The share of users in the US is about 60% (or soon will be.) The share in UK is close to 50%. All these share numbers are higher than ever. Over 14% of US and 10% of UK survey respondents have switched to an iPhone in the past two years. The following graph shows how churn is boosting iPhone market share in terms of users.
Source: Piplsay
There are more iPhone configurations. As the following graph shows the spread of phone price points is wider than ever. Reaching $1600, the range still starts at $399 in the US (excluding taxes.) The total range (number of lines in each year) is increasing also, now 24 mainly due to the addition of a 1TB storage option. NB: There are now two iPhone minis (12 and 13) and one SE bringing up the rear.
Carrier incentives are picking up again. There are tremendous trade-ins and incentives for financing new iPhones which is bound to create retail traffic. Also with the opening of more economies, there is likely to be a surge in shopping. Bear in mind that around 400 million users have iPhones older than 3 years. Trade-in values are as high as $1000. Which leads to...
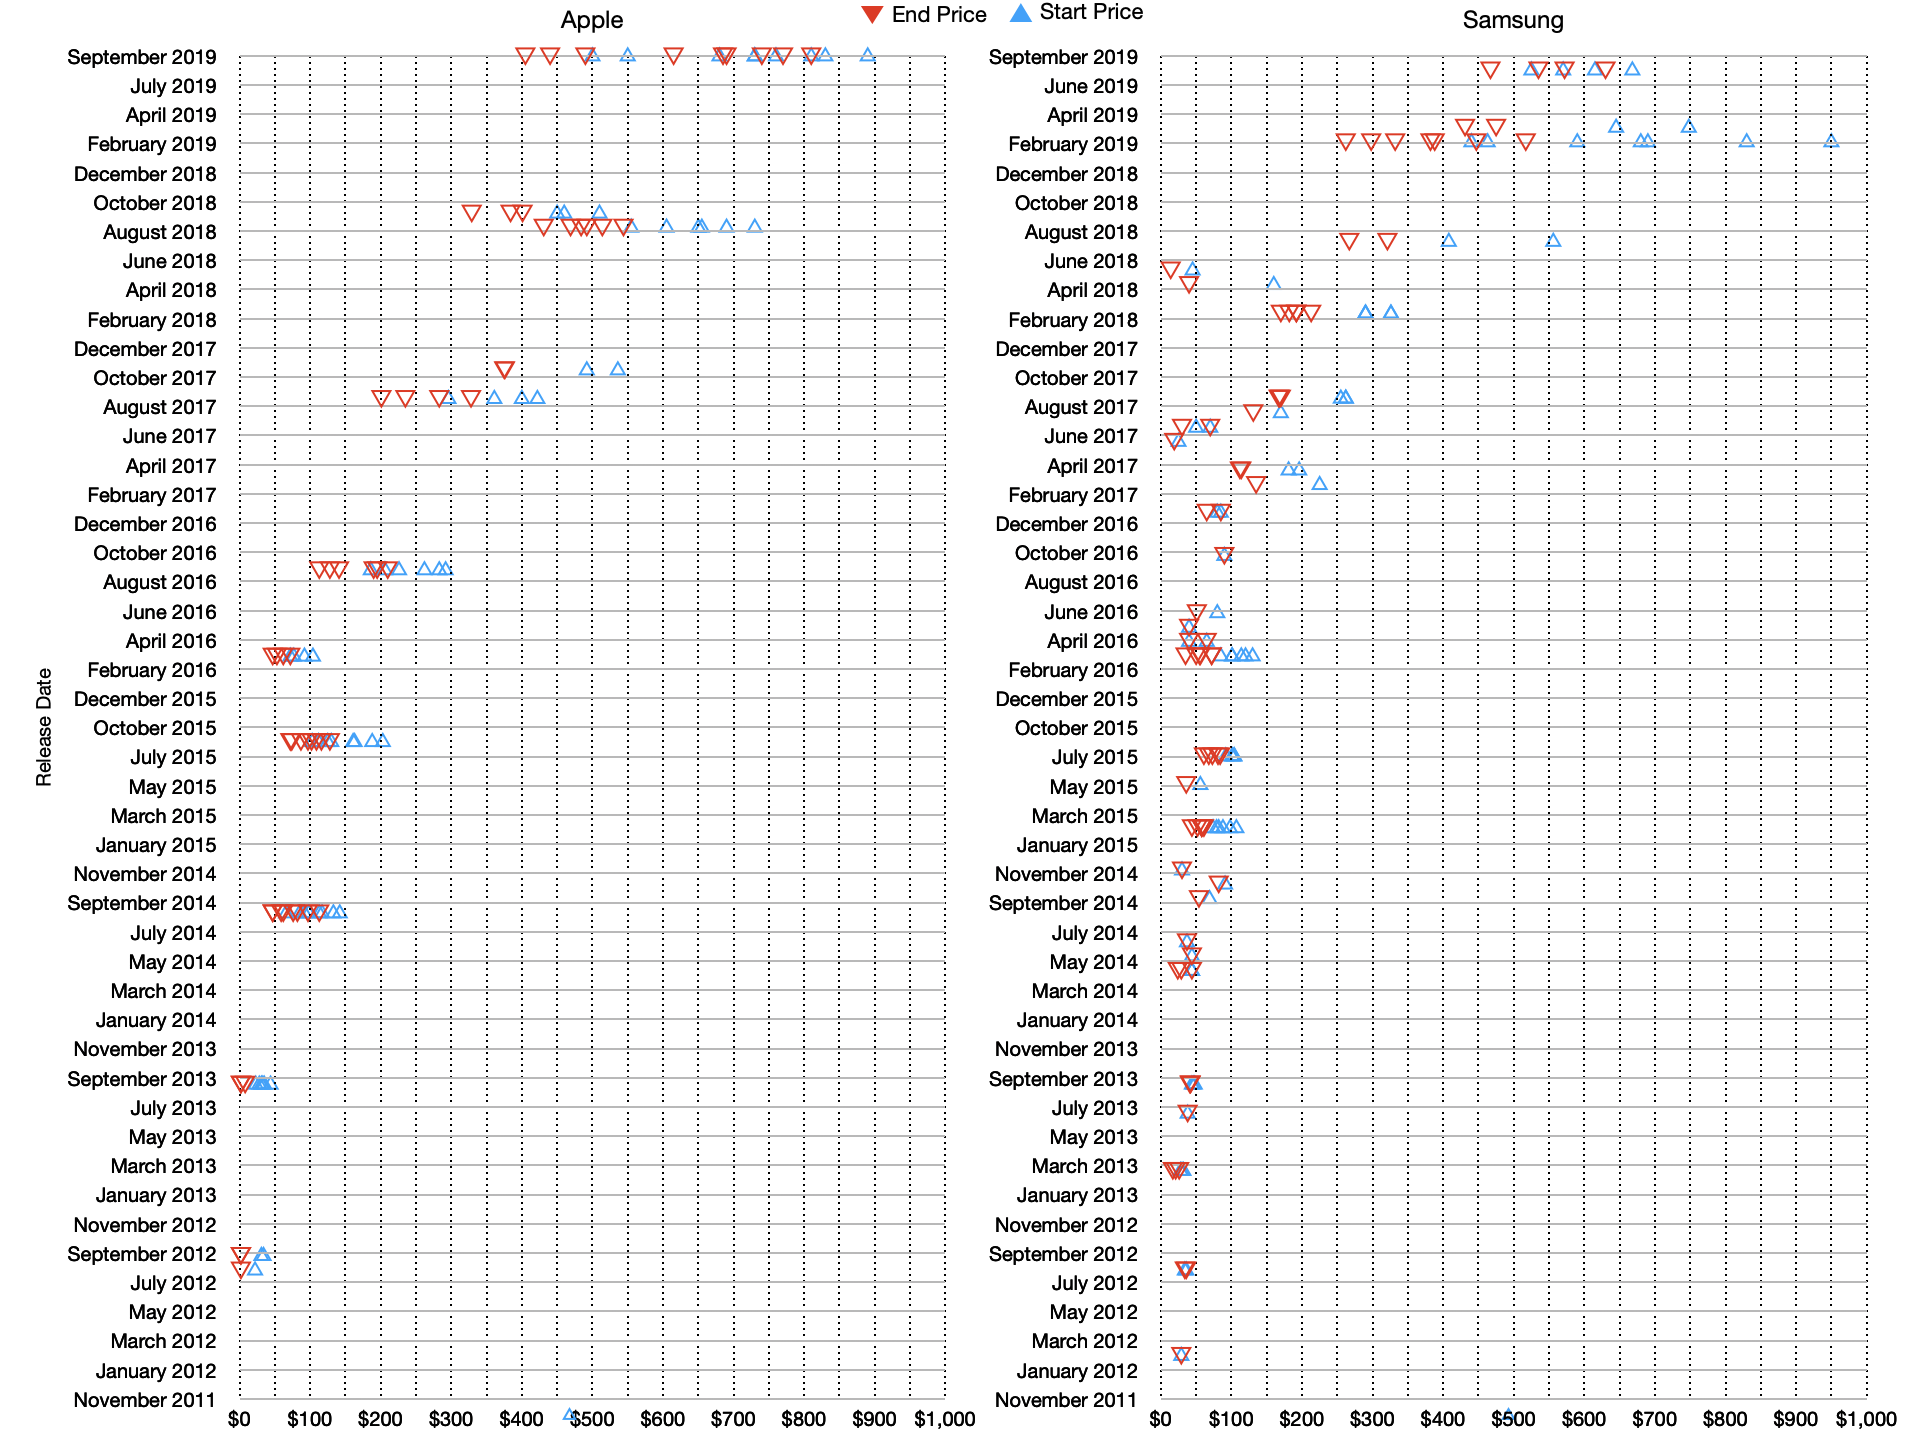
A thriving secondary market. The used smartphone market is dominated by iPhones and this drops the floor for entry into the iPhone ecosystem to essentially $0. The following graph shows price drops across 2019 for Apple and Samsung smartphones (for various models by date of initial release).
Most importantly, the specification of the iPhone continues to push the boundaries of what consumers demand from a phone. The camera performance for the latest iPhone 13 enables a set of new behaviors beyond the selfie, the snapshot or 10 second video. Apple is putting cinematographic power in the hands of amateurs. It's not so much about replacing professionals but enabling amateurs to look better to each other. Be sure to listen to the latest Asymetric podcast to hear from John J. Connor, accomplished film industry camera operator and cinematographer on the power of iPhone cameras.
The new cameras are for the new generation of YouTube, Instagram and TikTok influencers. Ordinary people with extraordinary tools can do extraordinary work.
The latest iPhone 13 is, in my opinion, the most important iPhone ever. It creates the perception of what a phone should be and it sets up the trajectory for demand that did not yet exist. It's facile to think that the utility of an ok older phone is good enough. That assumes that we are satisfied with ok messaging and ok apps. With ok photos and ok video. With no wide angles, no nightmode and no macro photos. What the iPhone has shown however is that the demand for performance can be nudged up.
We did not ask for rack focus, post-production focus (!), night mode, macro photography and portrait bokeh. But once we have these features we begin, ever so slowly, to use them and then we start demanding them. Conversely it seems that what people mostly ask for—that is what the critics ask for—are extrapolations of existing features. The "faster horse" dilemma.
What makes the iPhone and perhaps Apple special is that it seems to deliver things that nobody asks for but then everybody wants while eschewing overshooting a performance dimension that a few demand but most won't use.
The tragedy of overservice and disruption is that if you don't shift the definition of performance eventually you run out of demand at the top of the performance curve. That opens you up to "good enough" competition from below. Instead you need to re-define the notion of performance: compete on a new basis, reset expectations. That the iPhone can find new dimensions of performance and hence demand is effectively a solution to the innovator's dilemma.
The last quarter of 2020 was a remarkable quarter for Apple. Every line in the income statement increased by double digits. Net sales up 21%, iPhone sales up 17%, Mac sales up 21%, iPad up 41%, Services up 24% and Earnings Per Share up 30%. This had not happened in over 10 years. The last time being the first quarter of 2010.
Take a look at the table below which color-codes each line based on the rate of growth. The darker the green the faster the growth (blue being above 100%).
A shockingly good performance is made all the more remarkable by its happening in a time of uncertainty. The company has refused (rightly) to issue guidance as long as a pandemic is raging world-wide. The disruptions in supply chains, demand and changes in behaviors due to new limitations on mobility and interactions between people are unprecedented and consequences are still to be estimated.
The growth surely, you say, is precisely because of this disruption. The "work and study from home" and lockdowns have forced people to buy more technology. Phones, Laptops, tablets are not just tools but lifelines for a society denied other forms of contact.
But this was not at all obvious at the beginning of the crisis. The months leading to pandemic caused the share prices of most equities to fall, and tech was not immune. Apple's shares fell in March 2020 to $57/share. I heard comments suggesting that Apple would collapse as a business with unemployment reaching 25% and nobody willing to pay for luxuries like iPhones.
The crisis has proven that technology is not a luxury but a necessity, and technology that works better is far more valuable than technology that works barely. Spending on better machines has increased.
Some of that is of course helped by stimulus programs but growth was not only in countries which gave out cash. The growth for Apple was in all regions of the world, breaking new records even in poorer countries.
Far more likely, the economic fuel for Apple's growth came from disposable income being unspent on other high-ticket items like dining, vacations and entertainment. Much cash sloshing around the economy surely ended up in an Apple cash register.
But this is all old news. The question into 2021 is what will this year look like. The first quarter already ended and the data is dribbling in: Apple has 1 billion customers, 88% of US teens have an iPhone, 70% have AirPods, China is growing at crazy rates, Foxconn reporting 40% growth, production of next generation iPhone chips starting early (May), etc.
There does not seem to be a let-up in growth, despite some component shortages postponing some non-iPhone product introductions. Apple's cautious comments 3 months ago are probably moot now.
We are providing some directional insights assuming that COVID-related impacts of our business do not worsen from our current assumptions for the quarter. For total company revenue, we believe growth will accelerate on a year-over-year basis and in aggregate, follow typical seasonality on a sequential basis.
At the product category level, keep in mind two items: First, during the March quarter last year, we saw elevated activity in our digital services as lockdowns occurred around the world, so our services business faces a tougher year-over-year comparison; second, we believe the year-over-year growth in the Wearables, Home and Accessories category will decelerate compared to Q1.
As you know, we were chasing demand on AirPods last year as we expanded channel inventory from Q1 to Q2. This year, we plan to decrease AirPods channel inventory as is typical after the holiday quarter. We expect gross margin to be similar to the December quarter.
We expect opex to be between $10.7 billion and $10.9 billion. We expect OI&E to be up around $50 million and our tax rate to be around 17%.
Luca Maestri
Given this, I am tentatively projecting top line growth of 15% (vs. 1% a year ago and 21% last quarter) and EPS growth of 11% (vs. 3.8% year ago and 25.6% last quarter.) A goldilocks quarter.
Five years ago I used the Cook Doctrine (put forward 12 years ago) to assess the possibility of Apple's entry in the car market. That doctrine states, among other things:
We believe that we need to own and control the primary technologies behind the products we make, and participate only in markets where we can make a significant contribution.
Tim Cook
I concluded that it was not a question of if, but of how and to what degree Apple could make a significant contribution. How in terms of control of the technology and to what degree in terms of significance of contribution.
It was a tough call five years ago and it's still a tough call today. Arguably the failure of initial efforts to meet the Cook doctrine have caused resets and reboots and pivots which means no entry is visible in the near future.
But there is another effort that Apple has undertaken in the automotive space which might be indicative of their intentions and capabilities.
This is an effort that hardly gets mentioned and was dismissed as immaterial a long time ago but I would argue it has made a contribution. It's also unique for Apple in being a licensed software technology made available to hundreds of licensees and extending a software and services strategy to non-Apple hardware.
I am speaking, of course, of CarPlay.
CarPlay was announced almost exactly 6 years ago. It implements a unique division of labor between the iPhone and the on-board hardware. A division that keeps most of the computation and data on the phone but displays and allows inputs through the car. As a result it can evolve with new versions of iOS while keeping car inputs and outputs functional even when they age well beyond the lifespan of several iPhone generations.
It can be argued that CarPlay is a necessary "connector" for the iPhone for that one hour a day that many iPhone users spend in their cars. It is effectively a better way to control the iPhone and have it be the "brains" of the infotainment system. In that regard it's very similar to Apple TV: controlling the "dumb" TV without having to be a screen. The difference here is that CarPlay does not need an Apple remote.
But how is this significant? It improves things, sure. It improves most in-car experiences related to making calls, music, navigation, calendar, messaging, podcasts and news. It also seems to have traction.
The measure of any product introduction should be adoption and in that regard CarPlay could also be seen as significant in its departure from the Apple play book.
Because the adopters are not users but carmakers, the decision to deploy it depends on it being licensed and put into cars that are produced and made available. Quite a different set of hurdles, these are the "orifices" that Steve Jobs famously riled against.
One of the aspects of adoption by institutions vs. adoption by consumers is that whereas consumers are influenced by an early adopter calculus followed by the observation and imitation of others, for institutions there is a long delay with indecision followed by a rush to do adopt in unison with competitors. In other words, the adoption curve for consumers is a continuous gradual uptake whereas for institutions it's a flat line followed by near-vertical step function.
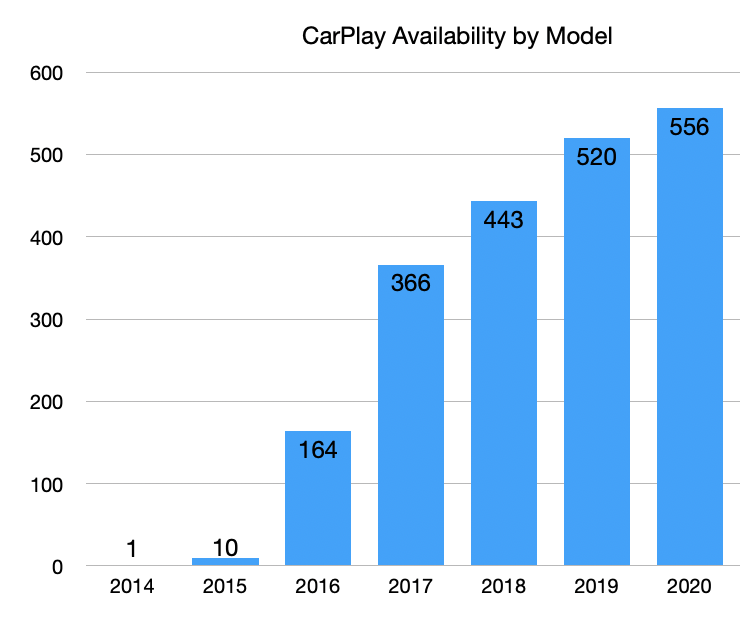
We can see this with the following graph showing the number of car models supporting CarPlay for the model years they represent.
2014 and 2015 were very tepid but 2016 and 2017 saw huge leaps in adoption. Since then there has been a steady filling out of support. At this point in time about 600 car models support CarPlay which is very nearly all the models available in the US market and a substantial number for the markets where the iPhone is widely used.
So is CarPlay significant and can it provide control? On the control side the answer is a tentative yes. CarPlay creates an iOS bubble in the car and it sustains the iPhone ecosystem with no incursions by alternatives likely. [Android Auto which seems to have a similar degree of adoption does the same for Android but there is no "pull" of switchers from one to the other.] Anecdotally, CarPlay support has become a hygiene issue with carmakers. Having it offers few advantages but not having it may repel users.
On the significance question, the answer should be "it depends". The support seems substantial but it's hard to assess market share of models as a complete list of car models available is not easily obtained. Apple has effectively injected software in a lot of cars and done so relatively quickly. By licensing it has amplified its reach much in the way Microsoft did with Windows and the Intel PC in the 90s. The speed is remarkable because everything in the car industry happens very slowly.
More than 1000 licensed car models in 4 years. This is quite a feat.
But the software touches only a fragment of the car. Infotainment is important, perhaps more than anything else the user perceives about the car experience. But it has not changed what the car is. It has not made driving safer nor more productive or more efficient.
Messaging and calling and mapping/navigation notwithstanding, significance needs to be measured in more important terms. The iPhone is significant precisely because an iPhone is not a Phone. The Apple Watch is significant because it's not a Watch. AirPods are significant because they are not just acoustics.
CarPlay would be significant if it made the car something it isn't and not keep the car being what it is. We know it should be something else and that is what we are all waiting for.
IN a recent release, Apple reported that "more than 90% of stores in the US, 85% of stores in the UK, and 99% of stores in Australia accept Apple Pay." This is encouraging but a very small view for the global Apple Pay picture. How can we assess where Apple Pay is and how do we even measure success? My expectation six years ago was that Apple Pay would be a "$1 billion business" by 2020. Now that 2020 has ended, how was my six year prediction?
I always recommend counting customers rather than (or before) dollars so let's begin with that. According to one source Apple pay users worldwide reached 507 million by September 2020. This is about 50% of iPhone users and therefore a decent adoption rate (starting as it did six years ago.) The data shows a growth rate of about 66 million in 2020 but a deceleration from 150 million the previous year. This data is obtained through surveys as there is no reporting from any participants.
There is a smattering of other samples about transaction volumes, mostly behind pay walls, but the overall story of adoption is typical: an s-curve where we are either at the point of inflection or slightly after it. If we are half-way then perhaps saturation will occur in another six years.
More concerning is the distribution of these users. A lot of the data that is collected on mobile and online payments (and mobile wallets) is US only. Historically the US was a good place to measure technology adoption as the US was usually the leader. The automobile, PC and many other consumer technologies saw their market defined by the US.
But not so much anymore. The digital mobile phone broke the rule. Today mobile payments is breaking it again. Note that although the iPhone is over-represented in the US (as share of all phones) Apple Pay point-of-sale support is under-represented in the US.
According to one survey, in mid 2018, there were an estimated 38 million Apple Pay users within the United States, and 215 million outside (5.5 times more!) Outside the US mobile payments are nearly 100% accepted by default but in the US the support is patchy and characterized by active intervention to deny.
I've used Apple Pay everywhere in Europe without friction. From vending machines to highway tolls to drive-throughs, public transit and parking meters. I can recall one failure to do so in the last six months (a state-owned gas station).
The same cannot be said of the US. Where at WalMart and Home Depot there is the capability of support but an incomprehensible refusal to do so. One rumor about why Home Depot denies it is because they were hacked once and are paranoid about any technology. Walmart may be spiteful due to margin/cost, valuing a few basis points over customer satisfaction, convenience, hygiene and employee productivity. These holdouts are the laggards. Perhaps there is some pride in denying their customers a basic convenience but there certainly isn't profit in it.
It gets even weirder when it comes to banks. In the US almost all banks immediately supported Apple Pay as an extension of their bank cards. In Europe the banks became the holdouts, rolling out support slowly and perversely.
So when you consider the dependencies of Apple Pay:
Sufficient number of users with iPhones/Watches (check)
Support from Banks (great in US, spotty outside)
Willingness of retailers to accept (sluggish in US, perfect outside)
Availability of points-of-sale equipment (universal by now
It's an impressive achievement.
My expectation six years ago was that Apple Pay would be a "$1 billion business" by 2020. This was based on a take rate of 15 basis points ($15/$10,000 in transactional value). Juniper Research, which regularly examines payment transaction markets, now expects that Apple will see global Apple Pay transactions of $686 billion by 2024.
At that 15 basis point rate it amounts to $1.03 billion. Thus this particular research suggests that I was off by 4 years, making the $1 billion pay day a 10 year target rather than six.
But maybe that is no fault of Apple's. The transaction volume is also equivalent to 52% of the proximity mobile payment market. Half the addressable payment market is a pretty good market share for a company holding 25% of the smartphone user base.