Asymco

Asymmetric Intelligence

iPhone

  1. Inventive Teens

    Research · 23 comments

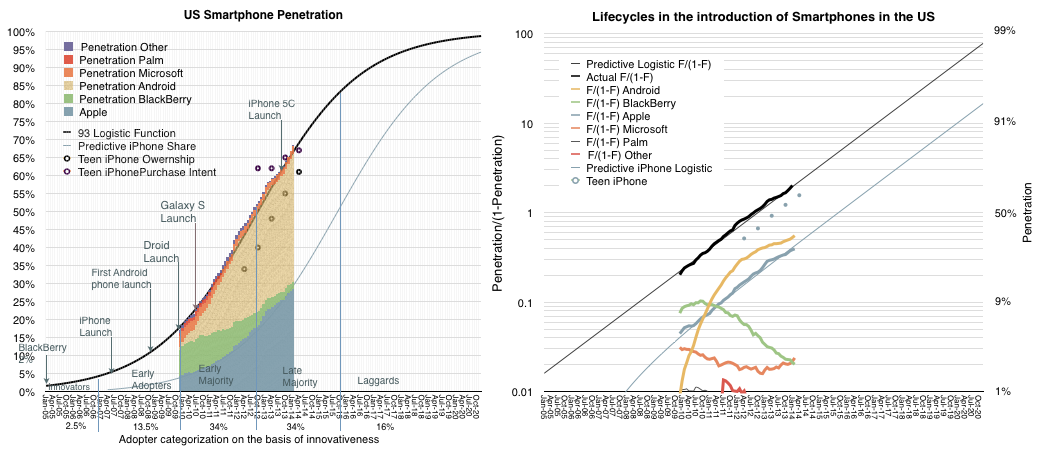
    Philip Elmer-DeWitt cited Piper Jaffray's latest Teen Survey on Device Ownership where ~7,500 teens in the US are asked about their device ownership. This type of data is similar to the method comScore uses to measure penetration smartphones in the US making the two data sets comparable.

    The combined data is shown the following graphs.
    Screen Shot 2014-04-10 at 4-10-3.07.04 PM

    One graph is the penetration data and the other is the ratio of penetration to unpenetrated on a log scale. The PJC Teen Survey data is shown as dots on both graphs. In the spring of 2012 the difference between teen iPhone ownership and overall population iPhone ownership was 20 percentage points. In the fall 2012 it was 22 points. In spring 2013 it was 25 points. The spread increased to 30 points in the fall of 2013.

    This implies that the latest sample (April 2014) should have at least a 31 point lead on what comScore will report in another two months. ((comScore reports data during the first week of a month for a period ending one month earlier. So the April release covers a sampling period ending February)) In other words current iPhone penetration in the US is probably 30%. This assumes of course that the relationship between teens and overall population has not changed. But there is consistency in the pattern of iPhone growth for over 50 months.

    In addition, the purchase intent data is showing that there is growing interest and that interest reflects demand which has been largely met by a purchase decision.

    Teens are leading adoption in this particular sector because the device is very well suited to the jobs that they need to do, mainly social interaction. It's no coincidence that the audiences for the fastest-rising services (SnapChat, WhatsApp, Vine, YouTube, Instagram) consist mainly of teens. They also lead adoption in FaceBook, iTunes, MySpace, etc. In that regard teens are an early indicator of mainstream behavior.

    Teens taught the world new habits throughout the 20th century ((An entertaining review of the contribution (and invention) of teenagers in the 20th century can be enjoyed in James May's 20th Century Episode 5)) and they certainly seem to be teaching us in the present.
  2. A margin of error

    Research · 142 comments

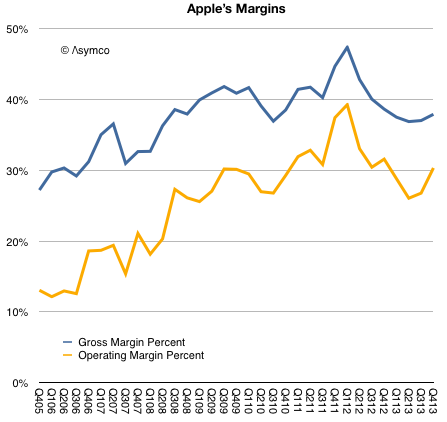
    Prior to Apple's earnings report I read at least one article suggesting that the most important indicator to watch was Apple's margin. I suppose this was due to a recent decline in margins from a peak gross margin of 47.4% in Q1 2012 to 36.7%.

    As the graph below shows, margins began to recover by Q3 2013 and are nearly on par with year-ago levels.

    Screen Shot 2014-02-12 at 10.32.50 AM

    The guidance for the present quarter is a gross margin between 37% and 38%. This would imply a flat q/q GM line (blue line above.)

    This is not quite catastrophic.

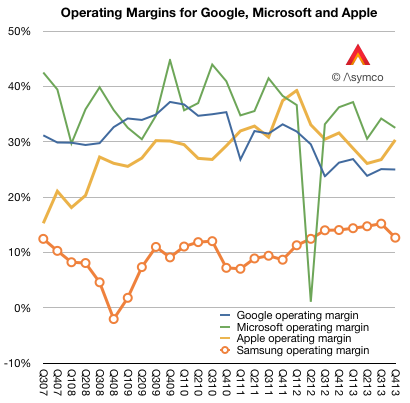
    To better understand margins, it helps to compare them with other companies. When Apple reached that peak of near 50% gross margin I noted that such a level was higher than Microsoft's and Google's. The irony being that Apple was nominally an (implied) low-margin hardware company while Microsoft was an (implied) high-margin software company and Google was an (implied) high-margin internet services company.

    Here is the picture with the last two years added:

    Screen Shot 2014-02-12 at 10.02.17 AM

    In the last two years Apple's margins have declined but so have Google's. And although Microsoft's fell, they fell less than Apple's and thus overtook it to remain slightly more profitable (32.5% vs. 30.3%) into Q4.

    I also added Samsung Electronics' operating margin. ((As a large conglomerate, Samsung will have a lower blended average. Separating the Telecom group's operating profit shows a 16.14% divisional operating margin.))

    So although Apple stabilized, it did so at an extraordinarily high level, well out of band for a hardware company. Thus the question remains: Are Apple's margins a fluke? Is the recent rise of margins to levels far above those of a comparable hardware company and into the realm of software and services sustainable?

    The simple answer is to assume that the iPhone and iPad, which make the bulk of revenues and which explain much of the rise, enjoyed a temporary buzz which allowed them to be priced at a premium but as that buzz wore off, the pricing and margins would decline. This is common with fads and fashions.

    But the situation is far more nuanced. If the margins were due to mere novelty, the effect should not have persisted over so many years. Pricing data shows that the iPhone remains exceptionally valuable and that the iPad, excluding line extensions, has also held the line on pricing.

    The missing piece in the puzzle is that the iPhone and iPad and iPod touch and Apple TV are pieces of an inter-dependent network of assets. The iTunes stores, Apple's services and Apple Retail are easily ignored because they are not "profit centers" but I believe they are a key component to the sustainment of these margins.

    In other words, the iPhone and iPad enjoy margins not just because they are new and well designed. But also because they form part of a ecosystem. The key word is 'system'. The user buys into a system not just what the device embodies.

    This is why I've always said that the iOS product businesses should be thought of as "hardware as a service". The inspiration comes from the notion of "software as a service" which posits the idea that software purchases should be thought of as services and thus recurring revenues.

    iOS devices are part of a service matrix: the user experience in the stores, the after-sales support (including the easily ignored Applecare), the broadband supplied through operator service (which is part of a trillion dollars of value), the apps and content that can be purchased (which add up to a mountain of money), the network effects of iMessage and iCloud and now iRadio and Match and Siri.

    These services attachments are well understood as great business models and underpin some of the most celebrated businesses to emerge in the last decade including Google, Amazon, Facebook, Box, Dropbox, Windows Live, etc.

    It's curious therefore that whereas these other businesses are highly valued as services, in the case when the service is a component within a larger system, the value is missed. In an integrated context the connection between services and high margins is not understood. The reason may be the absence of robust systems analysis and a preference for the facile explanation.

  3. Apple's Growth Scorecard

    Research · 89 comments

    Apple revenues grew at the rate of about 6% in Q4, while earnings grew at 5%. These were improvements over Q3 and Q2 but the rate of top line growth is has not been this low since 2009. The bottom line is also slower than it's been for the entire "epoch" or era of the iPhone.

    The components of sales growth are shown in the following table:

    Screen Shot 2014-02-05 at 12.05.10 PM

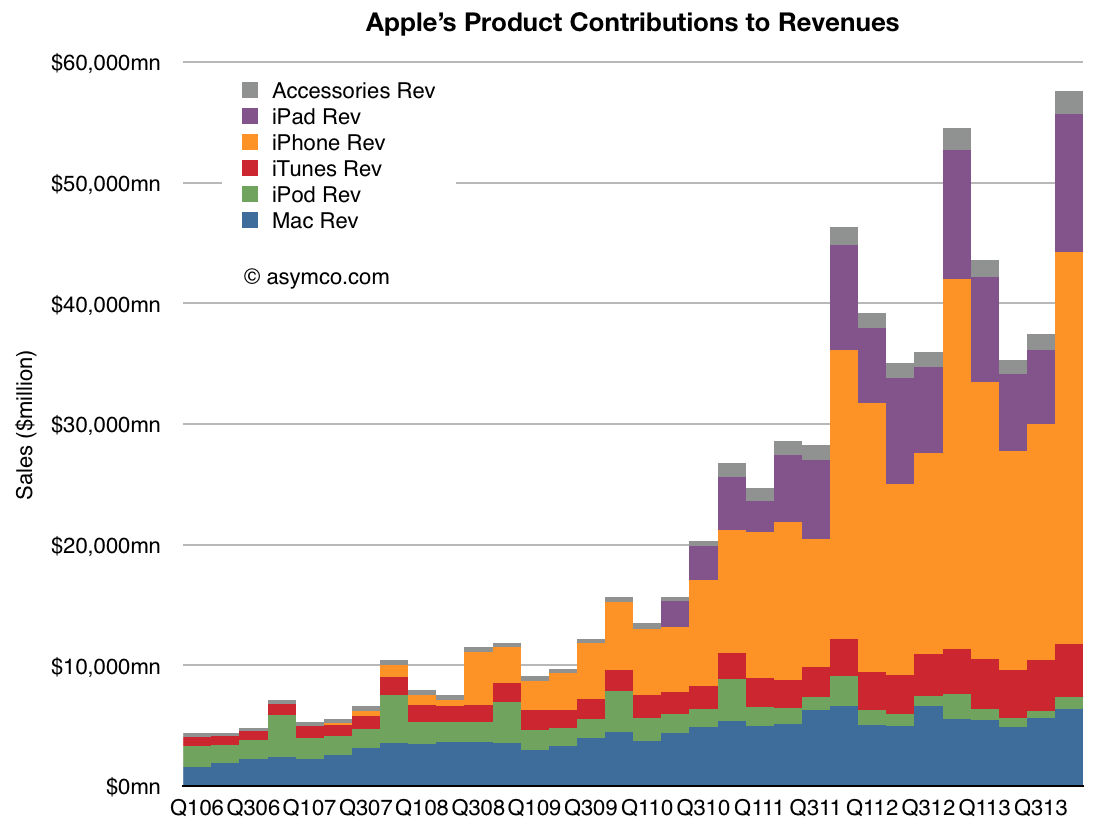
    The company delivered performance inline with its own guidance so there should not have been surprises in the top and bottom lines. However, the disappointment might be in the low growth for iPhone (at 6%) and iPad (at 7%). The Mac and iTunes grew at moderate rates (16% and 19% respectively) while the iPod continued its decline with -55% growth and Accessories remained fairly flat.

    As the graph below shows, the iPhone and iPad are the bulk of the business so their performance is a large part of what is observed.

    Screen Shot 2014-02-05 at 12.31.53 PM

    The speed with which products are introduced and scaled is phenomenal so it is more important than ever to see beyond the trajectory of existing products into the pattern of the introduction of new product categories.

    Markets are effective in anticipating the path of a technology as it ascends into the hands of users, especially if it is destined for ubiquity. But markets are completely incapable of anticipating the emergence of new technologies.

    In this regard markets are a reflection of common sense rather than uncommon wisdom.


  4. Apple Fourth Quarter Estimates

    Research · 56 comments

    As Philip Elmer-DeWitt is still interested in my estimates I provided the following:

    Revenues ($B) 57.8
    EPS ($) 14 (908m shares)
    iPhone (units) 56.4 million
    iPod (units) 7.6 million
    Mac (units) 4.14 million
    iPad (units) 26.5 million
    iTunes/Software/Services ($) 4.2B
    Accessories ($) 2.2B
    GM% (percentage) 37.1%

    I arrived at these estimates without looking at anyone else's (except for Apple's own published guidance). Soon after sending them I noticed that Daniel Tello published his own.

    In the same format as above, I quote them for comparison. Please visit his post for additional detail.

    Revenues ($B) 59.0
    EPS ($) 14.92 (895m shares)
    iPhone (units) 56 million
    iPod (units) 9 million
    Mac (units) 4.65 million
    iPad (units) 25.5 million
    iTunes/Software/Services ($) 4.3B
    Accessories ($) 1.8B
    GM% (percentage) 37.8%

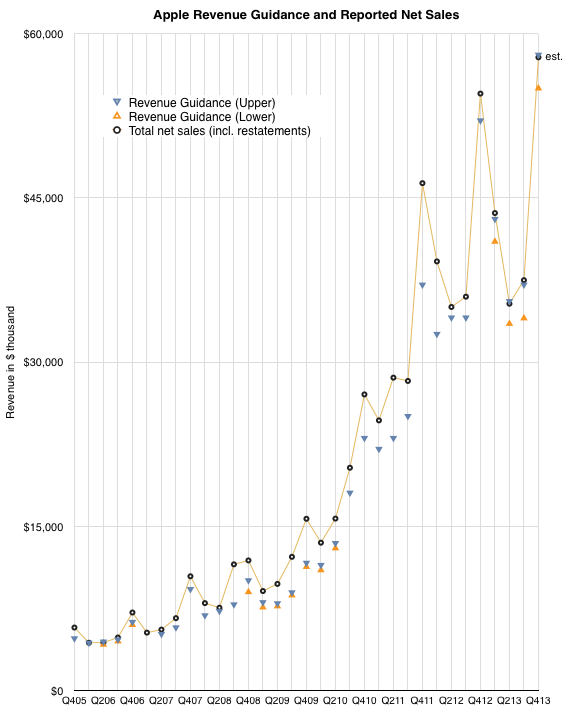
    The graph below shows the history of revenue guidance vs. revenue reported. The last quarter shows my estimate for net sales.

    Screen Shot 2014-01-15 at 1-15-4.06.58 PM

    Note that the company achieved at or slightly above its upper guidance ever since they started offering a range for guidance (i.e. since Q1 2013). My estimate for sales is therefore very near the top of guidance. The figures for units earnings and margins all result from this assumption.

  5. The China Mobile iPhone MOQ

    Research · 38 comments

    "BEIJING and CUPERTINO, California—December 22, 2013—Apple® and China Mobile today announced they have entered into a multi-year agreement to bring iPhone® to the world's largest mobile network. As part of the agreement, iPhone 5s and iPhone 5c will be available from China Mobile's expansive network of retail stores as well as Apple retail stores across mainland China beginning on Friday, January 17, 2014.

    China Mobile & Apple Bring iPhone to China Mobile’s 4G & 3G Networks on January 17, 2014 - Yahoo Finance

    January 17 seems to be an auspicious date. ((January 17 is a lucky day in Chinese numerology: 1+7=8 is a multiple of number 8, which is the most auspicious number.  Joe Zou @zzbar via Twitter))

    Precisely a year prior to that date, on January 17, 2013, I wrote The iPhone MOQ.

    Within that post I showed the activation rates for US operators as a percent of total users. Figures ranged from 10% to 19% by year or operators. I further assumed the figures would be toward the high end of that in Japan based on statements by the president of NTT DoCoMo.

    The last phrase I used was:

    "The MOQ figure as percent of subs for China Mobile would also be an interesting point of debate."

    My assumption would be that CM would start at a base significantly lower than the US or Japan. I would not be surprised to see an MOQ of 4% of user base for 2014. In the press release above China Mobile states that they serve 760 million customers. That implies a minimum order of about 30 million iPhones.

    In the absence of any other data it's best to be conservative.

  6. How many Americans will be using an iPhone when the US smartphone market saturates?

    Research · 201 comments

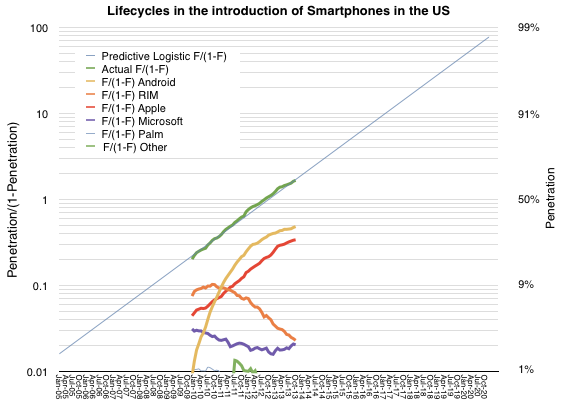
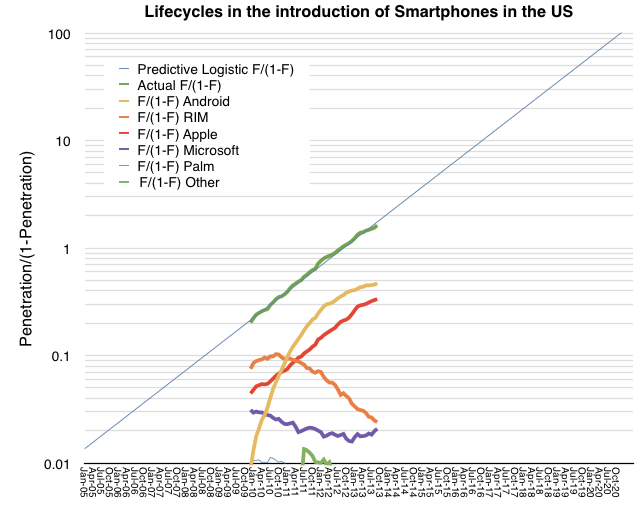
    As previously noted, the US smartphone market has followed an almost perfectly logistic growth. The measured data (via comScore, in green below) follows a predictive logistic function (thin blue whose formula is discussed here).

    Screen Shot 2013-12-13 at 12-13-11.30.54 AM

    The other notable market observation is how closely the iPhone follows the same pattern as the market. The red line representing the iPhone above is almost perfectly parallel to the green and blue lines which represent the overall market. The reason for this seems to be that consumers are absorbing the product in similar way to how they are absorbing the technology. ((Note that this pattern of adoption has happened even though the product has been at least partially unavailable to the entire market until quite recently.)) The "learning model" which underpins logistic models could offer clues as to the cause. It suggests that there is a direct communication that happens between the product and the consumer.

    Incidentally, the reason other platforms do not follow this pattern is that they are not communicating value with the consumer but with manufacturers or distributors of the product. These alternative communications could create faster or slower growth than the overall market as they are not subject to the same large population imitation/learning models.

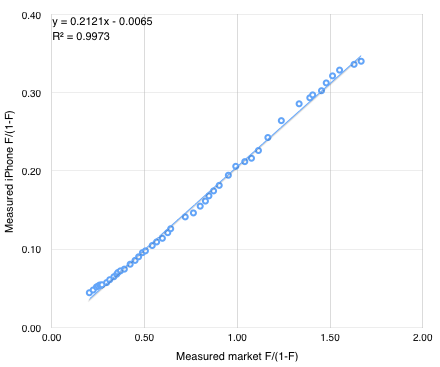
    If we believe that the iPhone can be modeled behaviorally then it may be possible to forecast its growth. One can simply draw a line extending the existing red segment above and read the F/(1-F) figure at any point in time. Solving for F results in a measure of penetration and hence number of users (if population is known.)

    An alternative is to use the following formula derived from the linear interpolation of the two measured market shares. iPhone market share is y/(1+y) where y=0.21x and x = F/(1-F) and F is the expected market penetration of smartphones.

    Screen Shot 2013-12-13 at 12-13-11.29.59 AM

    So if F = 91%, x = 10, y = 2.11 and therefore the iPhone market share =  68%.

    We also know from the plot of the market that F = .91 is reached around February 2017. So we can suggest that at 90% penetration (approximately saturation) the iPhone will have 68% market share of users in the US. Forecasting the addressable market (US population aged older than 13) at about 266 million that implies 180 million US users of the iPhone by early 2017.

  7. When will the migration from PCs be complete?

    Research · 129 comments

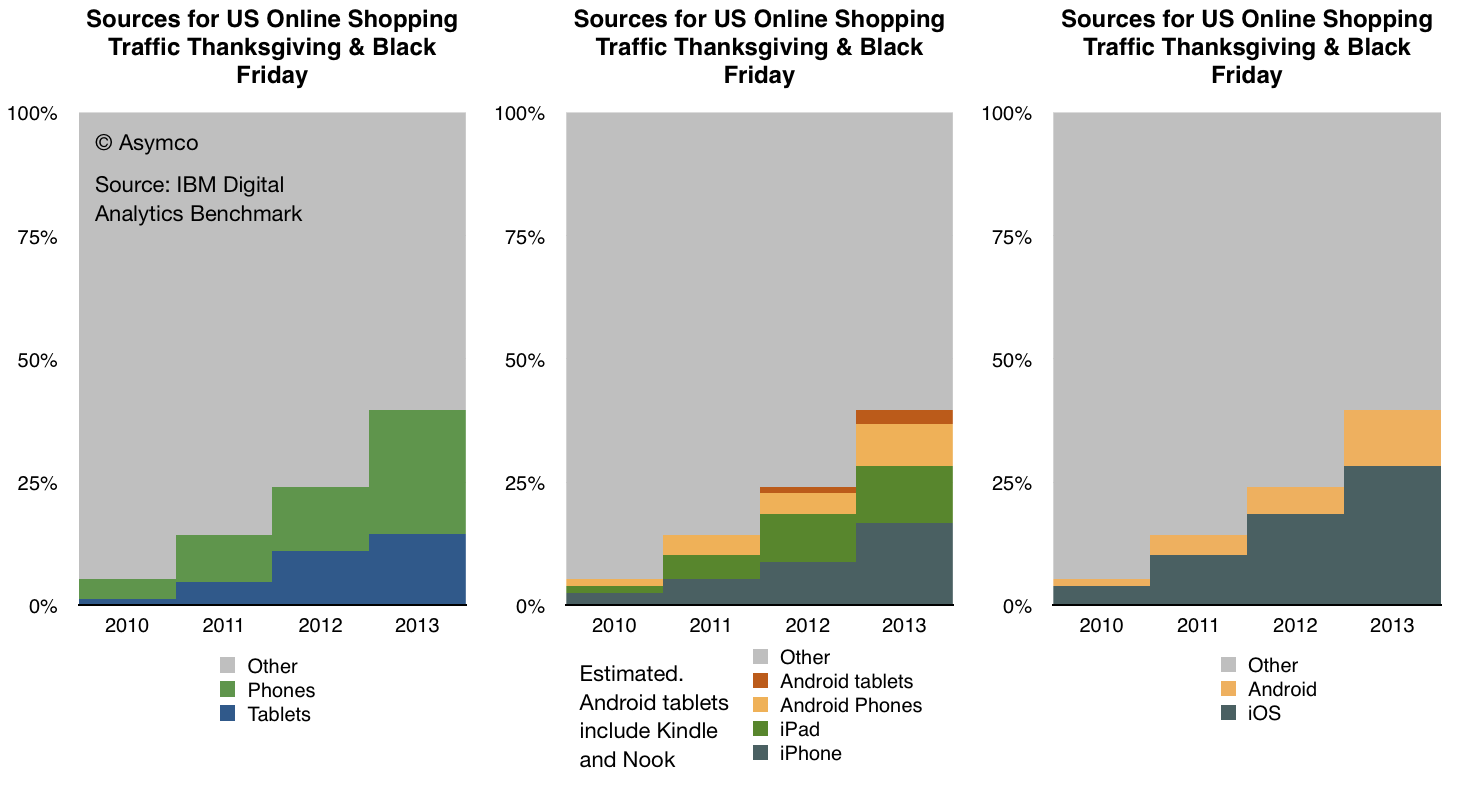
    IBM Digital Analytics Benchmark (report is here) has published, for the fourth year in a row, US online shopping traffic data with a split between mobile and fixed online traffic. It reveals a pattern of consumer behavior which is quite startling: people seem to prefer to shop using mobile devices.

    The data is shown below:

    Screen Shot 2013-12-02 at 12-2-6.45.34 AM

    In terms of sources of traffic, mobile devices (including tablets) have increased from about 5% of all online traffic to 40% in four years. Last year the volume was 24% implying that 16 points of share were gained in one year. If that is extrapolated to next year then more than half of holiday shopping traffic in 2014 will be on mobile devices.

    Put another way, next year less than half of users will hire a PC for the job of online shopping.

    If this conversion from PC-based shopping to device-based shopping follows a logistic substitution curve then the conversion to devices will probably be 90% complete in another 5 years or by 2018 or 2019. I see no reason why this particular job to be done (shopping) should not be considered a proxy for other jobs as well. Therefore it's not a stretch to imagine that the transition to post-PC consumption will also be practically completed by 2020.

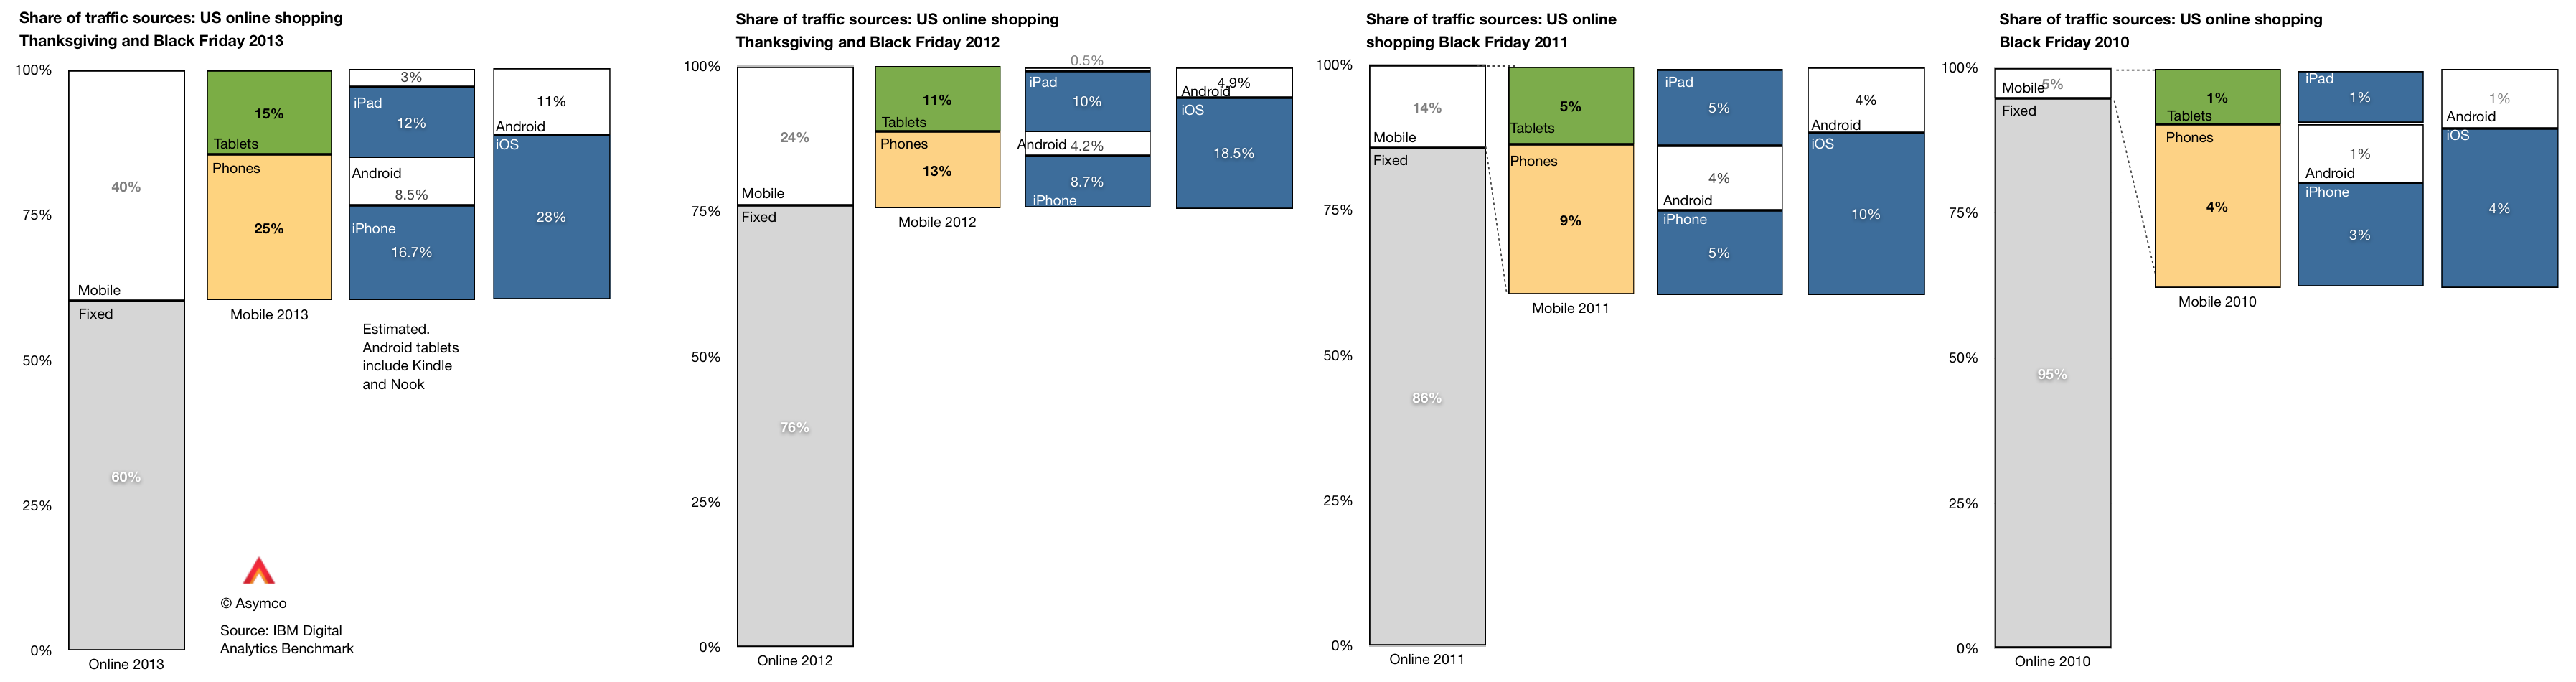
    Within the data there is also a significant amount of detail beyond the mobile/non-mobile split in behavior. There is a distinction drawn between tablet and phone traffic and a further distinction between Android and iOS devices. ((The split between Android and iOS for tablets and phones was not published for 2013 but I extrapolated from previous years and assumed that 80% of tablet traffic was sourced from iPads vs 88% in 2012 and 99% in 2011. Note also that non-iPad traffic is assumed to be Android but that includes the Kindle and Nook products which are using partial and unsanctioned versions of Google's Android.))

    This more detailed view of the traffic is shown in the following diagram:

    Screen Shot 2013-12-02 at 12-2-7.00.20 AM

    A few observations:

    • The pattern of slowing tablet growth is likely due to the slowing growth in iPad sales. This itself is due to the lull in product launches as the shift to fall only iPad releases took place in 2012.
    • The consequence is that iPad traffic contribution only increased by 2 percentage points, from 10% in 2012 to 12% in 2013. Compare this with the doubling the previous year (from 5% to 10%).
    • Among phone users, both Android and iOS grew their contributions to traffic by roughly 100%. Android phone traffic increased from 4.2% of all traffic to 8.5% and iPhone traffic increased from 8.7% to 16.7%.

    As we also know the approximate number of phone users for each platform (via comScore) then we can also determine the per user contribution of traffic of each platform. ((Note that this is phones only.))

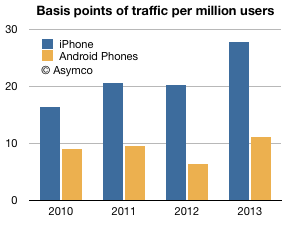
    The measure is "basis points of traffic per million users" and it is the result of taking the traffic data (in percent of total online traffic) and dividing by the population of users of a particular platform. The result is shown below:

    Screen Shot 2013-12-02 at 12-2-3.05.53 PM

    The way to read it would be that each million iPhone users generated about 28 basis points of traffic while each million Android users generated about 11 basis points of traffic.

    A way to compare these audiences would be to define the ratio between traffic usage by platform user. That ratio was

    • 1.83 (iOS:Android) in 2010
    • 2.16 in 2011
    • 3.15 in 2012
    • 2.51 in 2013

    So, as far as phones are concerned, US iPhone users are about 2.5 times more likely to shop online than US Android phone users. The data is reliable: with the US population now over 65% penetrated with smartphones, these populations of users (totaling over 130 million) are vast and representative. As the technology is reaching deep into the late adopter segments the difference in behavior between iOS and Android usage is becoming easier to explain. We have to eliminate quirks of demographics or income or other possible causes.

    The platforms themselves are becoming the last remaining suspects as causes for differences in the behavior of their users.

    It may seem preposterous to suggest that a platform can affect shopping behavior but let's remember that the PC, the subject of this article, is a platform in itself. The migration of usage away from the PC to alternatives can only be explained by the alternatives being superior at the particular job that needs doing. The argument is naturally extendable to each alternative individually.

  8. When will there be one billion iOS devices in use?

    Research · 94 comments

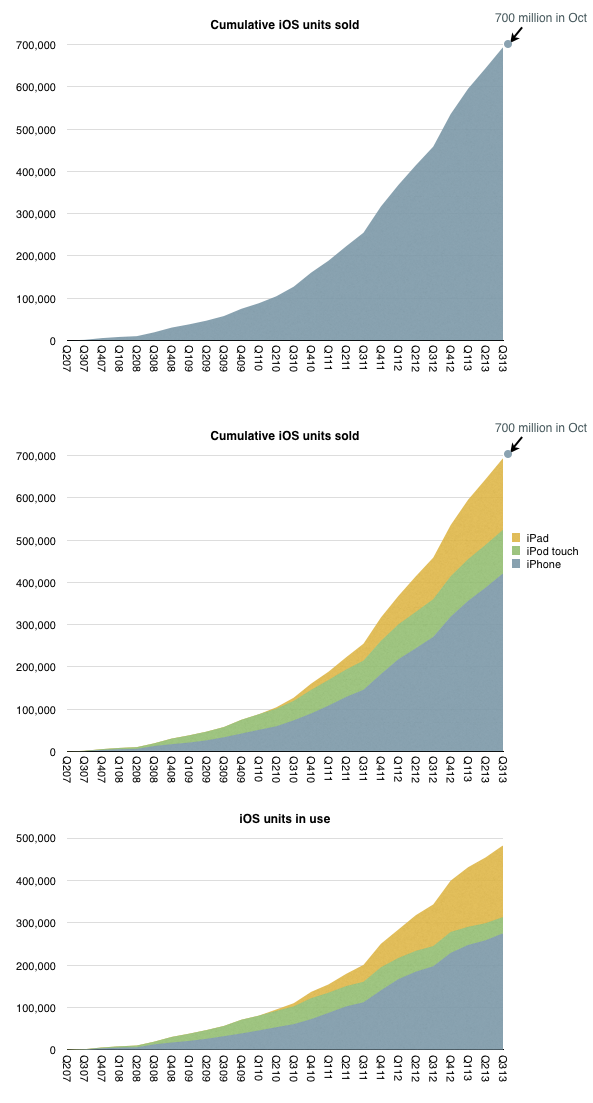
    iOS unit sales crossed over 700 million units last month. That is a significant milestone but the total number of units in use is likely to be lower. My estimate based on device replacement assumptions is that about 500 million are still in use.

    The estimated break-down of units sold and in use by device type is shown below:

    Screen Shot 2013-11-25 at 11-25-2.59.59 PM

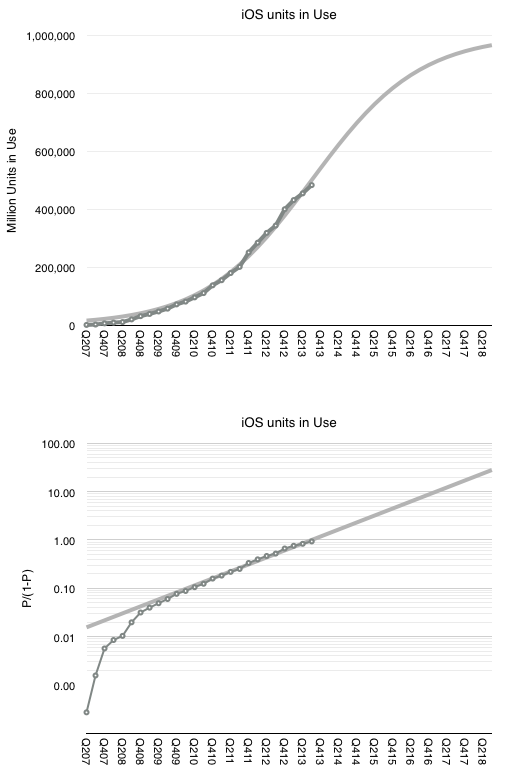
    When I looked at the penetration of iPhones in the US (as a part of smartphones in total) the surprising pattern was that it followed a logistic curve (while other platforms didn't.) If this is indicative of a particular learning process to be observed in the market, then can we extend the logistic growth pattern to iOS overall?

    I tried it with the assumption that at 500 million, iOS is at the half-way point in its growth. This assumption comes from growth being near an inflection point. It could be that iOS might accelerate further in which case peak penetration could be higher than 1 billion, but might take longer to reach.

    The 500 million as 50% penetration point assumption fits the model as shown below.


    Screen Shot 2013-11-25 at 11-25-3.23.10 PM


    The fit is pretty good for the period after the iPhone 3G launched. This assumption would therefore imply (nearly) one billion iOS devices in use by the end of 2018.

    Note that this does not mean one billion iOS users. The attach rate for iOS devices per user could well reach 2 by then placing total user base at 500 million. Note that this size of audience is very nearly the existing total Apple audience already (counting iTunes/iCloud accounts).

    This means that we already have "existence proof" that Apple can reach half-a-billion users. Apple does not need to discover a large new set of non-consumers. The idea of 1 billion iOS devices is simply the projection that each current user could some day use two devices.

  9. What's an Active User worth?

    Research · 86 comments

    Apple has sold 700 million iOS devices. Google claims one billion Android device activations. Microsoft has about 1.5 billion Windows users and Facebook about 1.19 billion. LinkedIn has 259 million users and Twitter has 232 million. Amazon has 215 active account holders and PayPal 137 million.

    Markets place a value on these users implicitly when company shares are priced. For example, Twitter whose users are worth about $110 or FaceBook's $98 and LinkedIn at $93.

    This consistency suggests a universally accepted value per social media user but what is the value of an ecosystem user? Apple, Google, Microsoft and even Amazon aspire to enable ecosystems which should be seen are more valuable than mere communities. Ecosystems enable a higher level of economic activity because they are unbounded by the medium itself. Any number of media can be created. Or so the theory goes.

    If we could determine a value for an ecosystem user we could test it against the going value of a social media user. Fortunately we have enough data to do so.

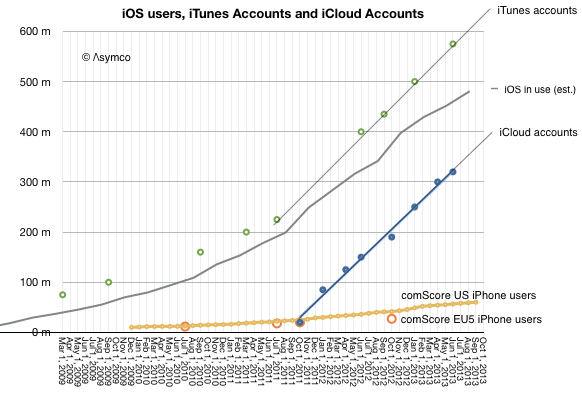
    The total number of iOS devices sold per quarter allows us to measure the install base of device users. With some assumptions regarding the retirement and attrition rate we can get the following history:

    Screen Shot 2013-11-11 at 11-11-11.52.34 AM

    Since the total number of iTunes accounts is updated with some regularity I've added it to the graph. I've also shown on the same graph the total number of iCloud accounts. For calibration, I included survey data showing the number of iPhone users in two regions (US and EU5).

    These combined graphs give us an upper bound of active users (iTunes accounts) and a lower bound (iCloud) calibrating our device-based estimate. The regional iPhone data offers some additional test on growth.

    The result is "about 500 million" ((482 million by my count but with quite a bit of margin of error)) with a growth of about 11 million per month.

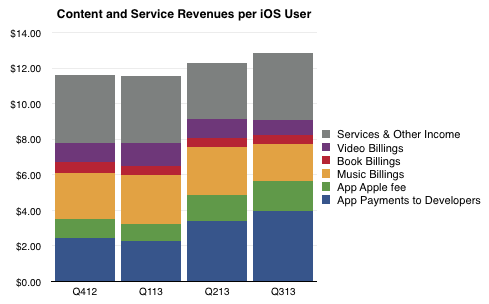
    So if we know with some confidence that there are about 500 million active users as part of the iOS ecosystem, how do we know how much value they generate? The answer is in the consolidated iTunes revenues as reported by Apple: $4.26 billion/quarter. With some attention to the reported media retail and purchases, the following picture of the average iOS user's quarterly spending emerges:

    Screen Shot 2013-11-11 at 11-11-11.50.23 AM

    The bottom line is that in the last 12 months the average iOS user contributed  about $48/yr to the ecosystem via Apple's own properties. They also bought the device and paid for cellular service in most cases. They may also have engaged in quite a bit of browsing and online purchases which fed other ecosystems. But as far as Apple is concerned, it transacted about $48 per user.

    As Twitter revenues last year were $317 million, the Twitter user today generates about $1.36 of revenue per year or one thirty-fifth of what an iOS user generates through iTunes and iCloud alone. And note that the number of iOS users is about twice that of Twitter.

    Of course one could argue that the iOS user's participation is not profitable for Apple. It does obtain massive cash flow from iTunes which finances its fashionable data centers and bandwidth but it does not presume to value itself primarily through this revenue.

    Or at least the market doesn't think so. We don't hear much about how Apple is worth so many dollars per user. ((I suppose the corollary to this is that Apple users are disloyal or fickle or fleeting, and quite contrary to observed behavior.))

    The paradox is that while the device which enables this commerce is where Apple guides the consumer's perception of value, markets discount devices and bid up services. In other words, users continue to pay for the devices which delight them enough to participate in services (especially the monthly billable kind) but markets walk right by these shiny baubles and and shower money on services which have negligible sales and even fewer profits. There must be some serious misdirection going on here. The question is who's being fooled.

  10. The diffusion of iPhones as a learning process

    Research · 50 comments

    All theoretical and empirical diffusion studies agree that an innovation diffuses along a S-shaped trajectory. Indeed, the S-shaped pattern of diffusion appears to be a basic anthropologic phenomenon.

    This observation dates as far back as 1895 when the French sociologist Gabriel Tarde first described the process of social change by an imitative "group-think" mechanism and a S-shaped pattern. ((Tarde was probably influenced by mathematician Pierre François Verhulst who first published the logistic function in 1845)) In 1983 Everett Rogers, developed a more complete four stage model of the innovation decision process consisting of: (1) knowledge, (2) persuasion, (3) decision and implementation, and (4) confirmation.

    Consequently, Rogers divided the population of potential adopters according to their adoption date and categorized them in terms of their standard deviation from the mean adoption date. He presented extensive empirical evidence to suggest a symmetric bell shaped curve for the distribution of adopters over time. This curve matches in shape the first derivative of the logistic growth and substitution curve as shown below. 

    Screen Shot 2013-11-06 at 11-6-1.51.57 PM

    In the graph above I applied the Rogers adopter characterization to the data we have on the adoption of smartphones in the US. The latest data covering September is included.

    The fact that smartphones in the US follow the theory is exciting, but what can we conclude about the adoption of specific platforms? There has been quite a bit of turnover in the leadership of the market in the first half of the time frame given. You can see this more clearly in the following fractional market share transformation.

    Screen Shot 2013-11-06 at 11-6-2.16.03 PM

    Note that, with the exception of the iPhone, if each platform is studied individually, it would not follow a logistic (i.e. linear) pattern even though, as a whole, the technology does.

    This then is the big puzzle: while we might be able to predict how smartphones will diffuse into society, we can't seem to predict how any single firm will fare. This means that an investor cannot make a credible "bet" on the technology ((Indeed investors often get burned when new technologies emerge. While the technology booms, individual firms supplying it often fail. See the history of transportation, communication, computing and energy.)). If they choose a single company as proxy, chances are they will lose. If they bet on a basket of companies then, again, chances are they will lose. There is usually one unforeseeably clear winner.

    Before we get further into the question of picking winners or predicting the future division of share among rivals, we should understand the underlying causes for this pattern of adoption.

    Rogers concluded that the learning behavior of individuals is the underlying cause of the symmetry of the diffusion process.

    At the beginning, when an individual is confronted with a new (learning) situation they make many mistakes. These mistakes are gradually reduced (by learning) over time because more and more information is received and acts as a stimulus. The gain in learning per trial is proportional to the product of the amount already learned and the amount remaining to be learned before the limit of learning is reached.

    Arnulf Grübler ((The Rise and Fall of Infrastructures, Physica-Verlag 1990)) explains:

    This is exactly equivalent to the F(1-F) transformation of the logistic curve. It should be emphasized that these properties of the learning process were found in real learning situations and are confirmed by a large number of laboratory and field experiments. Thus each adoption of an innovation in a social system is equivalent to a learning trial by an individual. Thus, the symmetric diffusion pattern results from the way messages about an innovation are emitted and processed by social learning.

    So these observers of the process assign learning behavior as the cause for adoption of a technology. Can the learning behavior be applied to individual platforms? It's tempting.

    The hypothesis would go as follows: adopters are not only processing messages about the new technology but they are also trying different platforms as they enter and as they upgrade their phones. If we see platform choice as a learning process then if one platform has a natural advantage, it settles into a dominant position as users "learn" of its advantage. Conversely, if no platform has an advantage then platform "churn" repeats as rivals gain/lose positions of leverage in the market.

    The pattern shown so far seems to point to Apple's iPhone having a logistic pattern indicating that it might be benefiting from a learning pattern. The alternative platforms may simply be jockeying for temporary advantage.

    It's an interesting hypothesis. To be developed further we need to answer what any learnable advantage might be. I suspect it has to do with the ability to solve unmet and unarticulated needs. In other words, that the winning product solves a set of "jobs to be done" which are difficult to pin down and are perceived rather than defined.

  11. When will the US reach smartphone saturation?

    Research · 92 comments

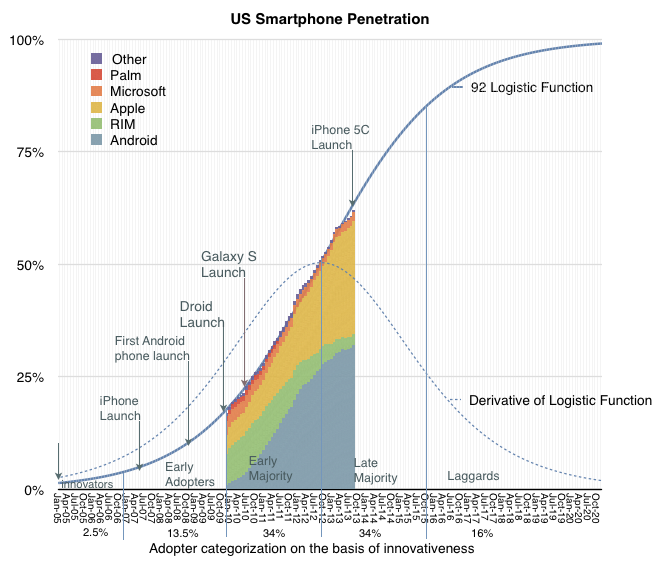
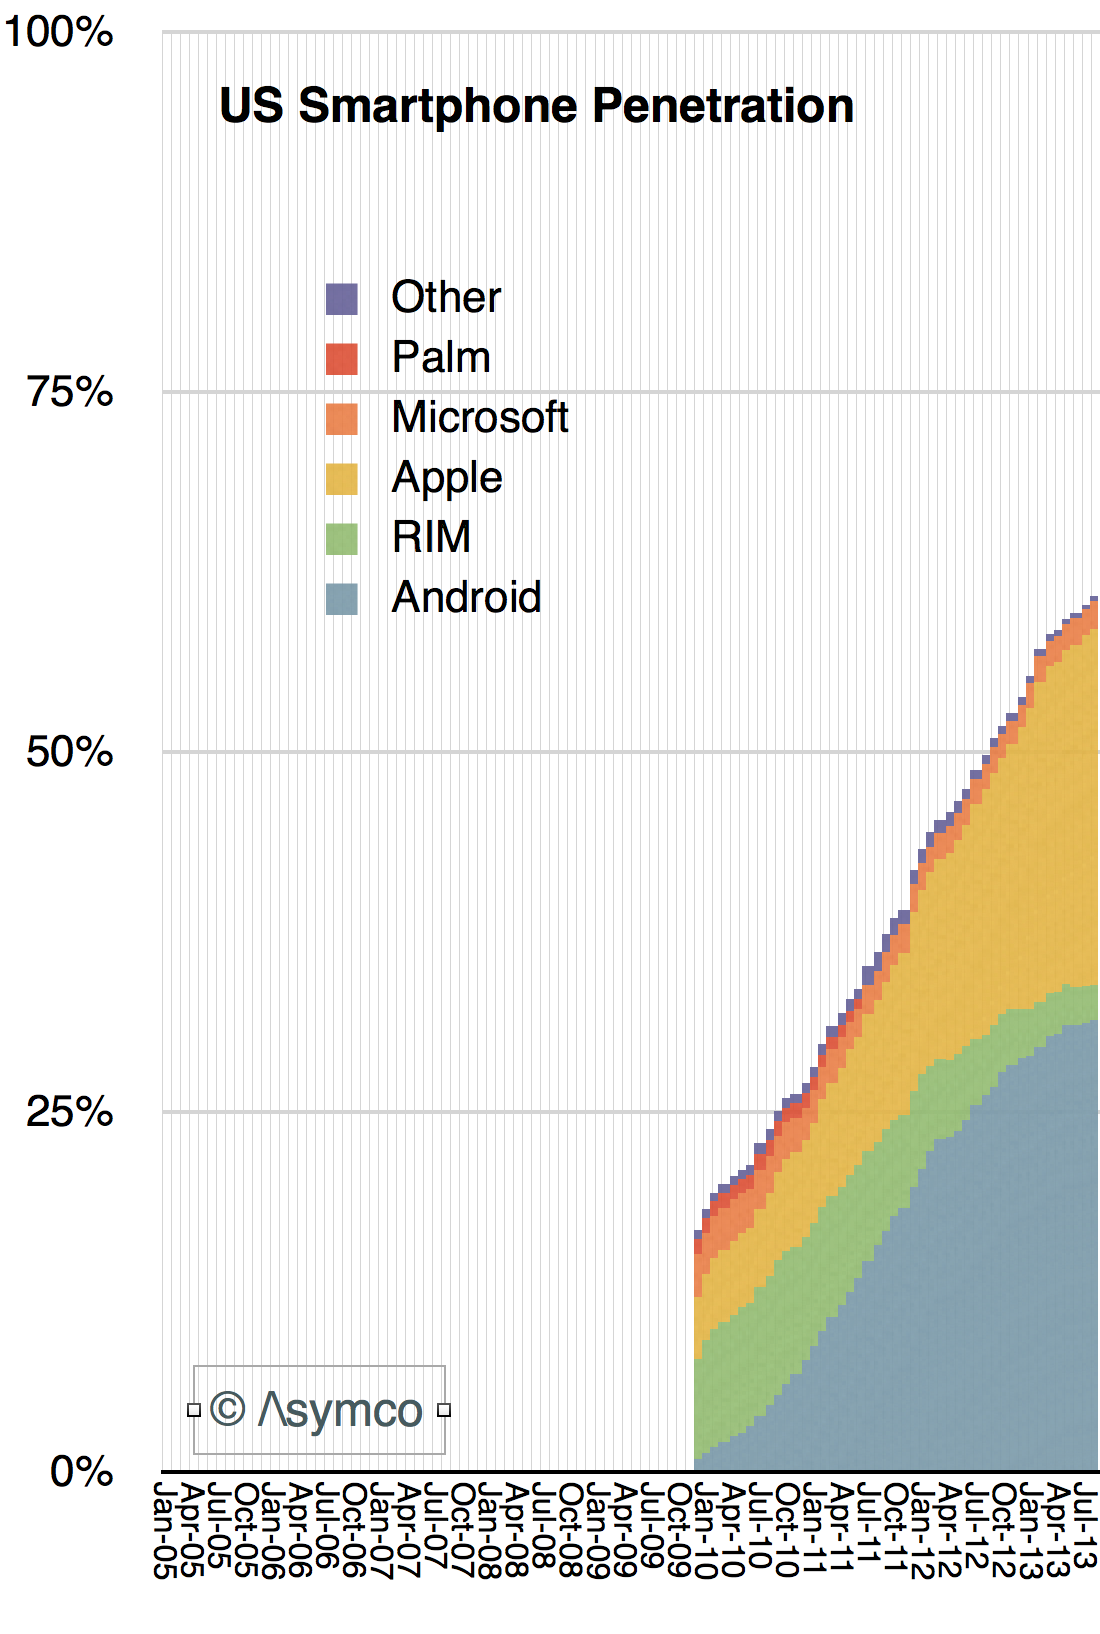
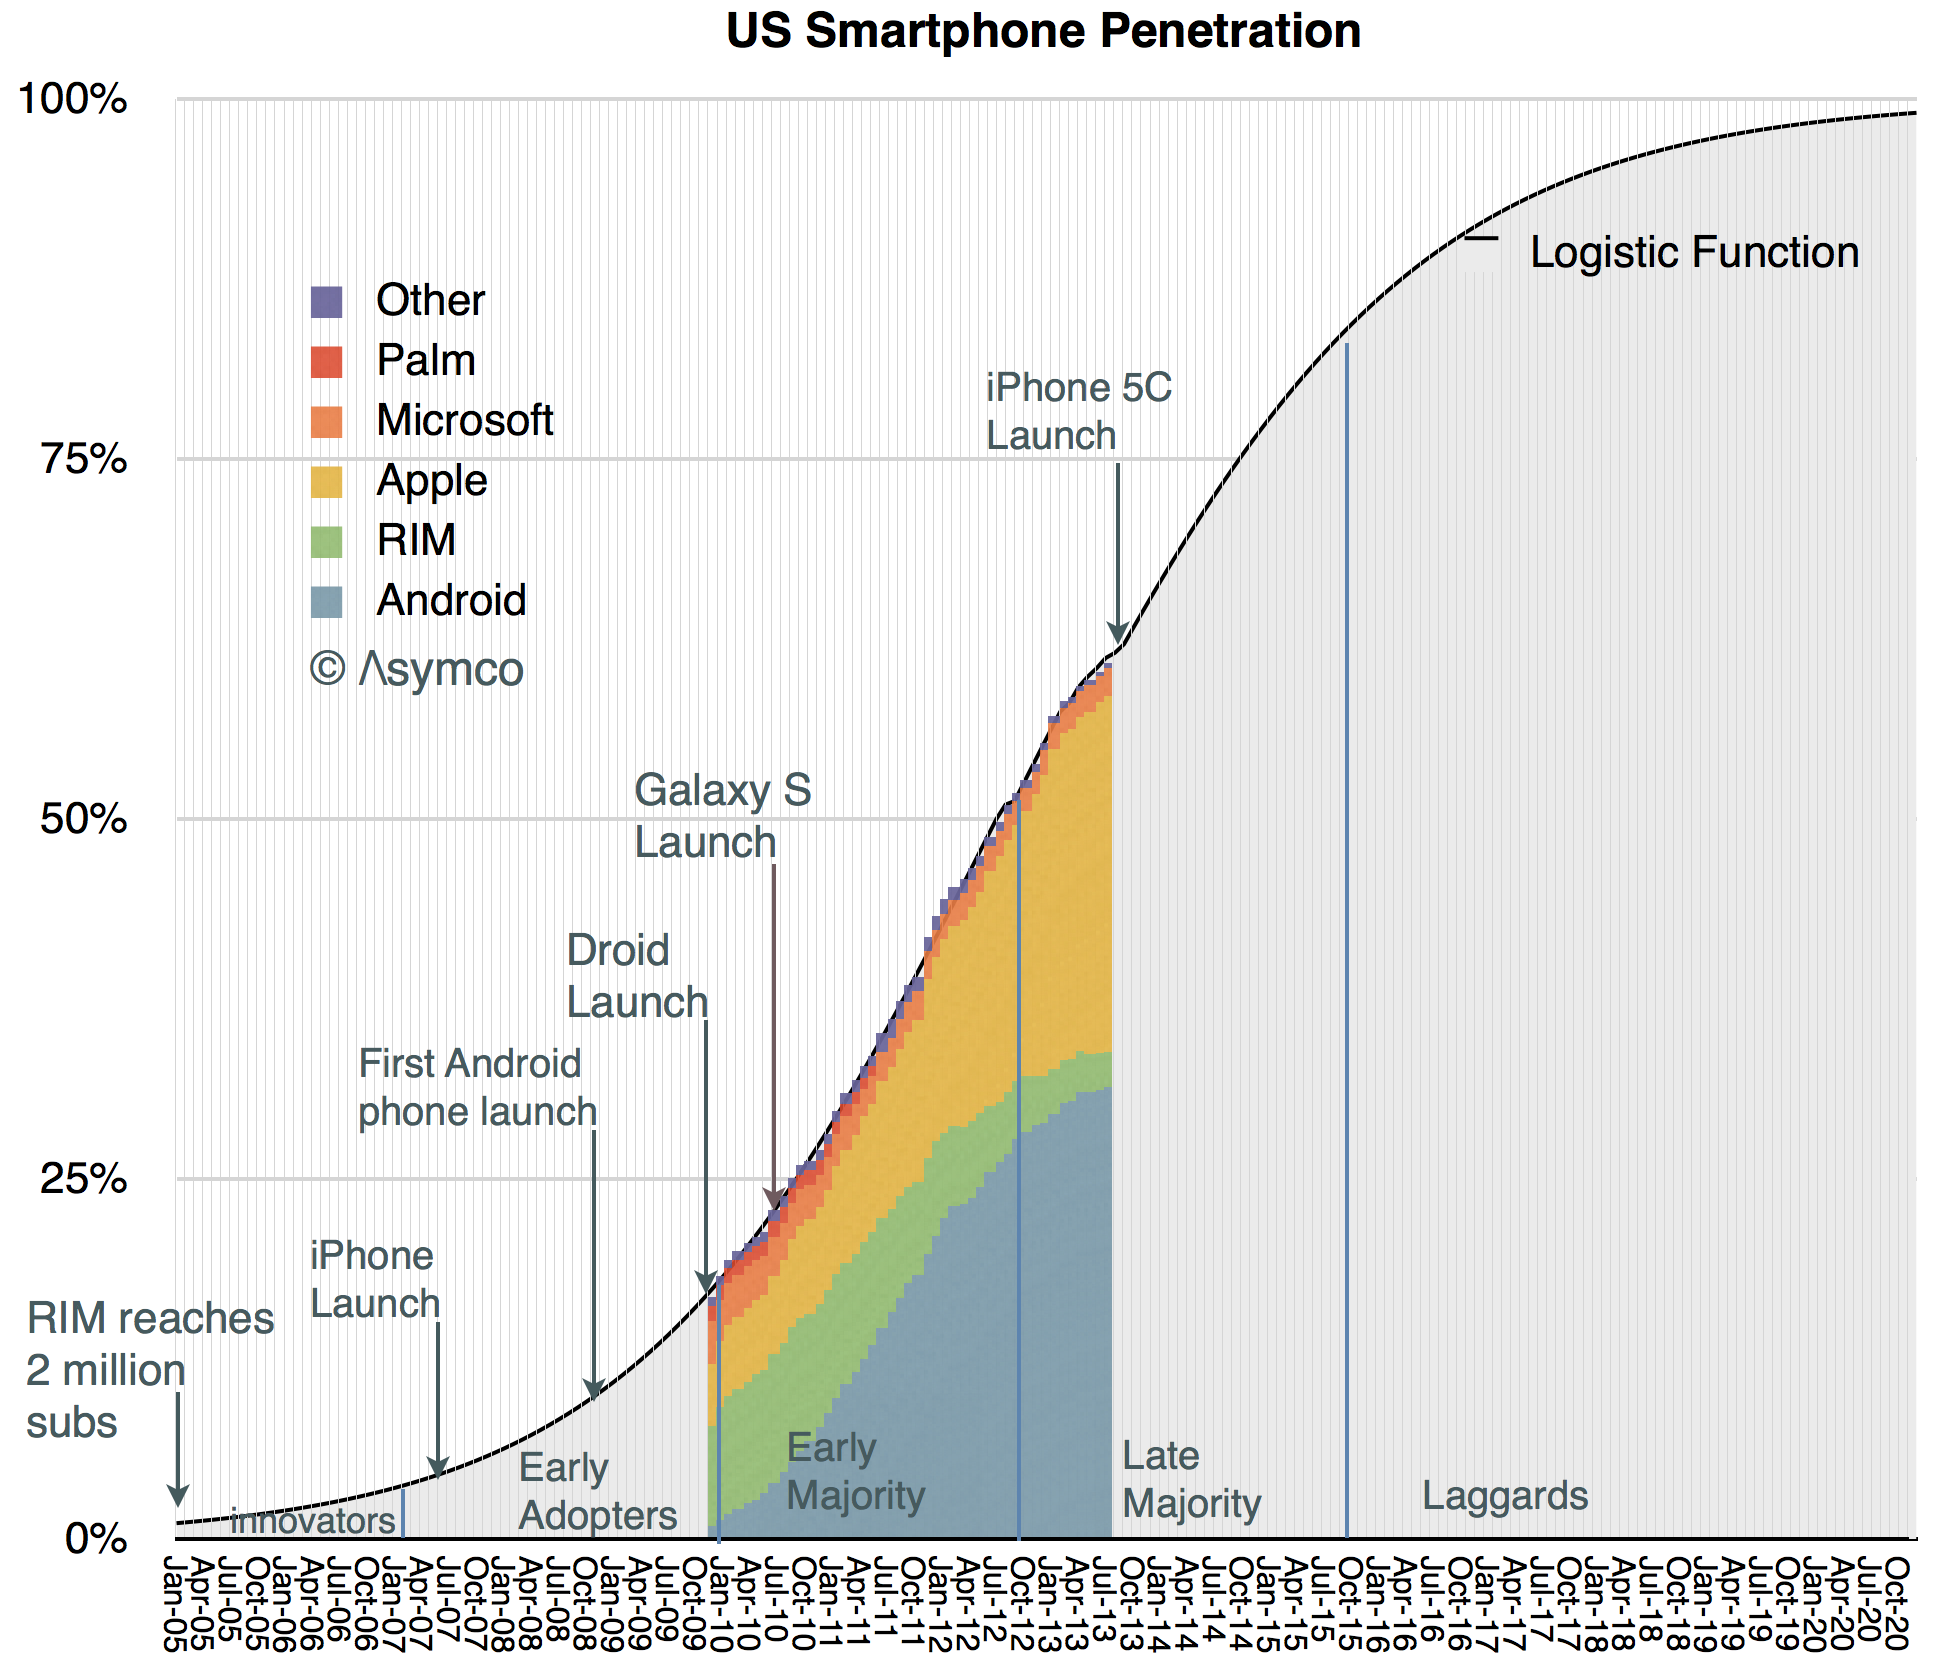
    The latest comScore data places penetration at about 61%, up over 10 percentage points from the same time last year. The 50% last year is itself up nearly 14 percentage points from the same time in 2011. This progress in the diffusion of smartphones is shown the following graph:

    Screen Shot 2013-10-07 at 10-7-5.32.48 PM

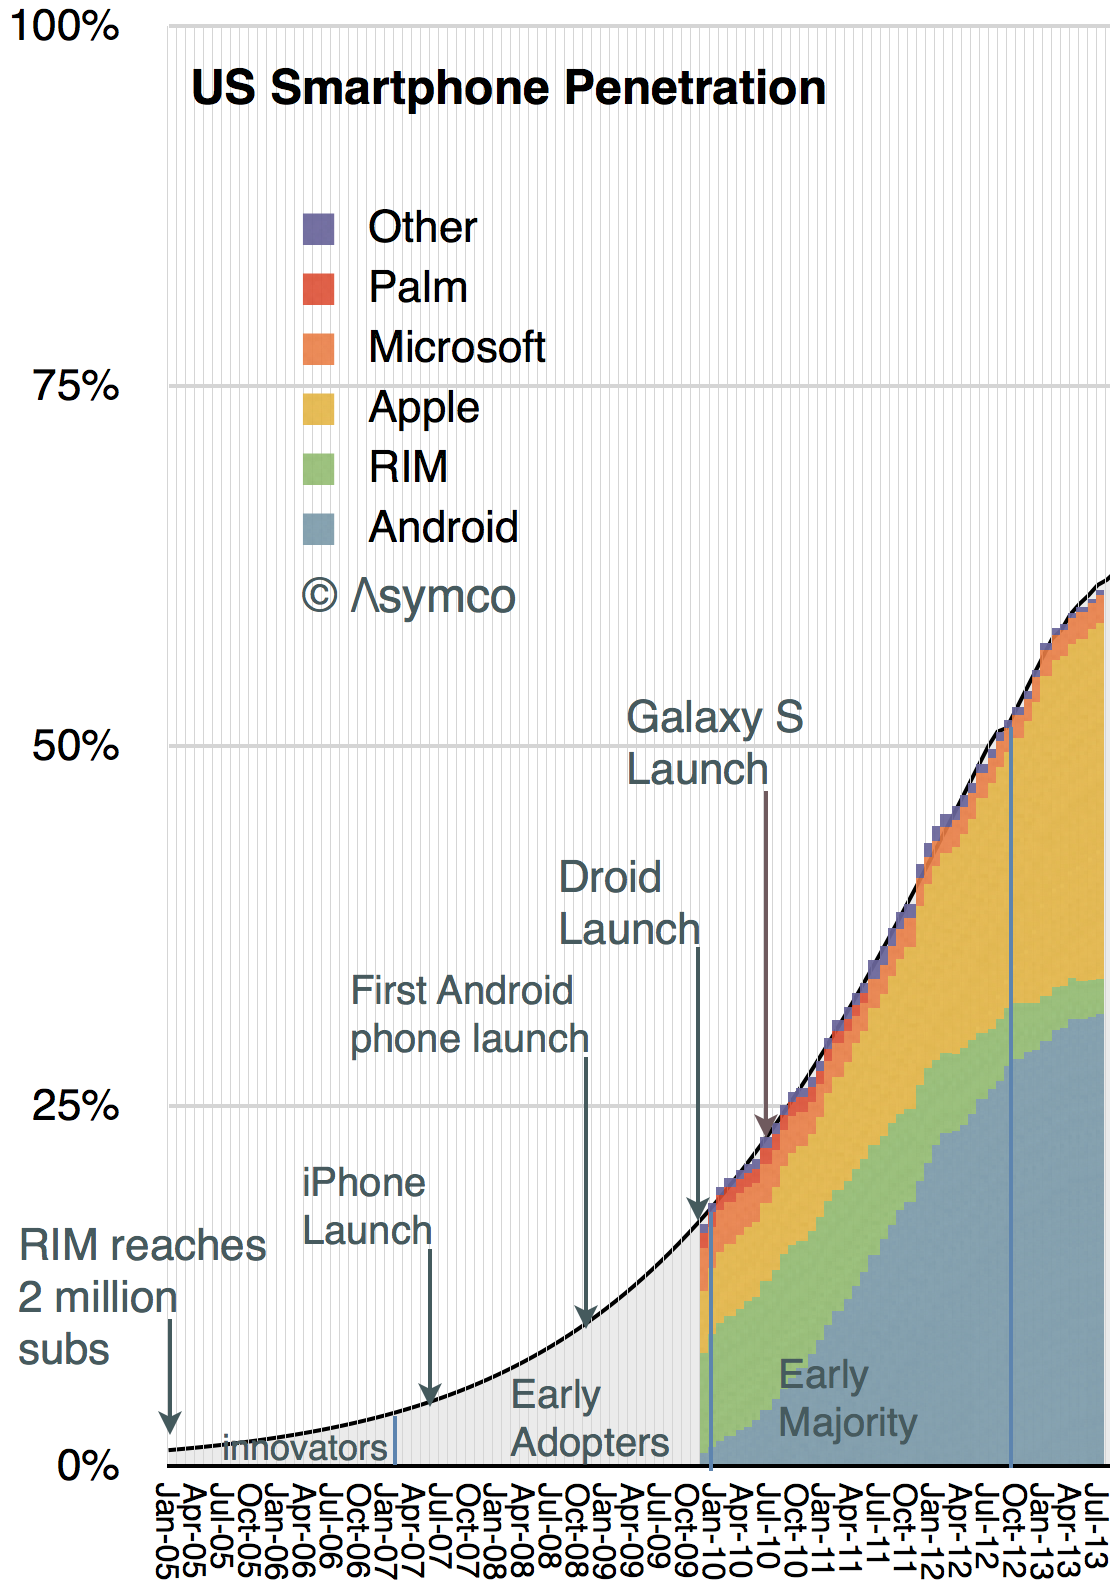
    I set the time frame for the graph to start in 2005 because there was still a market at the time. We can estimate the number of users from data supplied by RIM. They had about 2 million subs in 2005, the majority of whom were in the US.

    Given these data points we can draw a new penetration graph extrapolating to the complete date range.

    Screen Shot 2013-10-07 at 10-7-5.48.56 PM


    I added a few events that mark some of the product launched during this period.

    The penetration curve shown happens to be defined as the "Logistic Function" whose equation is well known:

    render

     p1  is the number of periods (in months) that it took for the market to reach 50% penetration and p2 is an index of which can be adjusted for this market.

    Note that I also identified successive groups of consumers adopting smartphones as defined by Rogers in his Diffusion of Innovations.  This is easily done since the formula for penetration gives us the answer (as the integral):

    • The Innovators (first 2.5% of the market) were recruited by February 2007, one month after the iPhone was announced. They were almost all BlackBerry users
    • The Early Adopters (the 13.5% which followed the innovators) were all using smartphones by the beginning of 2010. They were served mainly by iPhone 3GS and BlackBerries
    • The Early Majority were on board by October 2012, just in time for iPhone 4, Droid, Galaxy.
    • We are now in the Late majority which will run out by November 2015. The iPhone 5S came out about one third of the way through this period.

    The next few years are shown in the following extrapolation. 

    Screen Shot 2013-10-07 at 10-7-6.20.24 PM


    The laggards will adopt smartphones from late 2015 until late 2020.

    As this is the diffusion curve for the US, most other large regions are going to be shifted to the right and the global total can probably be estimated.

    What remains to be done is to estimate the way the platform colors will fill in over this time frame for the US and to do the same analysis on a global level.