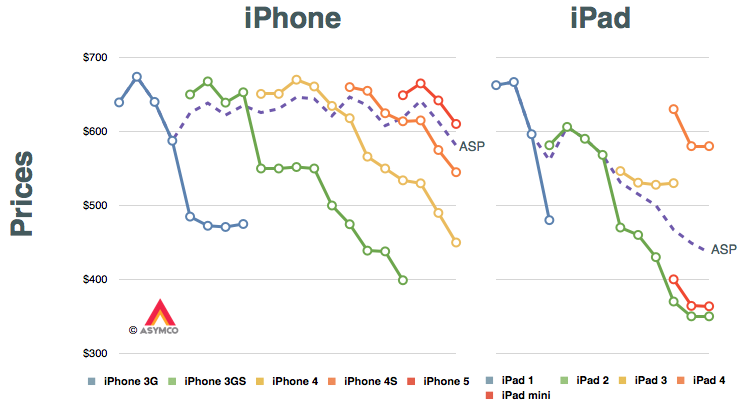
The answer may lie in the way the iPad mini has been marketed. The pattern for iPhone pricing is pretty regular but that for the iPad shows a marked difference. The reason is, of course, that the iPad has already gone through a portfolio broadening. The following graphs tell the story.
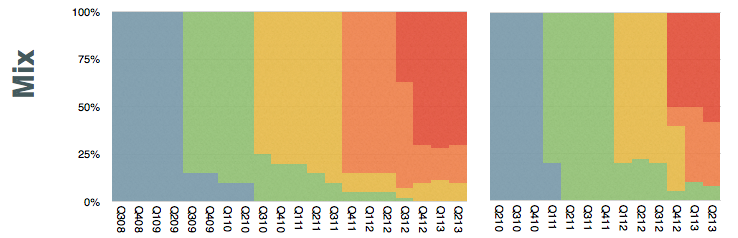
The only data in these graphs that is provided by Apple are the dashed purple lines. They represent the average selling prices (ASP[*]) for the two product lines. I added assumptions about product mix (shown in the lower set of graphs) and thus generated prices for each product variant at a given point in time shown as line graphs.
If you look at the iPad, ignoring the legacy iPad 2 (which I presume sells mostly to educational institutions) the replacement of the iPad 3 was with a "bracketed" portfolio of the higher-priced iPad 4 and the lower-priced iPad mini. Note also that the mini reflects similar pricing to the legacy iPad 2.
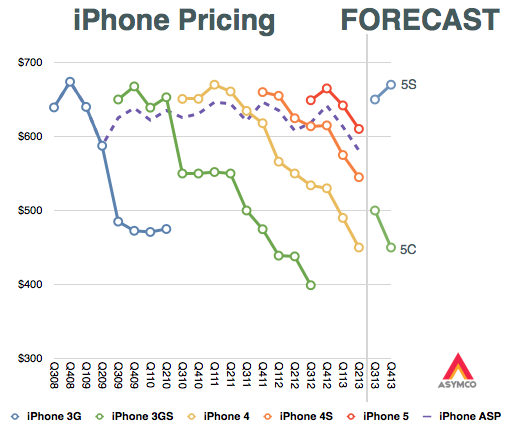
My second assumption is therefore that the 5S and 5C will form a similar bracket as the new iPads did. I also assume that the iPhones 4 and 4S will be retired. This means that the 5C will take up the trajectory of the 4S while the 5S will take up the upper bracket around $650.
The average pricing for the entire portfolio will depend on the mix. This is still highly speculative since we can't predict how the end-user (operator) pricing will be set for the 5C. Aggressive promotion and new market growth might skew the 5C considerably. On the other hand, upgrade promotions might move the 5S in existing markets.
---
Notes:
These prices reflect blended average prices of all SKUs to the channel and do not necessarily reflect prices offered to end-users.
ComScore's latest survey for US smartphone users showed that Android had 52% share of about 142 million users. That amounts to 73.84 million Android devices in use.
ComScore's previous such survey showed that Android had 52.4% of about 141 million users. This amounts to 73.88 million Android devices in use. It also means that Android usage in the US went down for the first time.
The difference is surely within a margin of error so it's not something to declare definitively, but the pattern of Android "peaking" has been evident for some time.
Even though share stopped growing about a year ago, Android continued to gain users as overall smartphone consumption increased. The last few months however have shown a slowing of new smartphone users and therefore we have this first instance of Android appearing to lose usage.
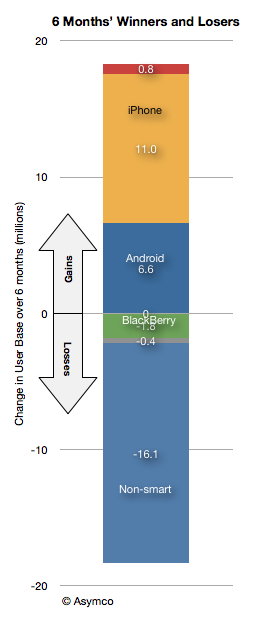
Note that this has not been the case for iPhone as usage over the last six months is up by 11 million users vs. 6.6 million for Android.
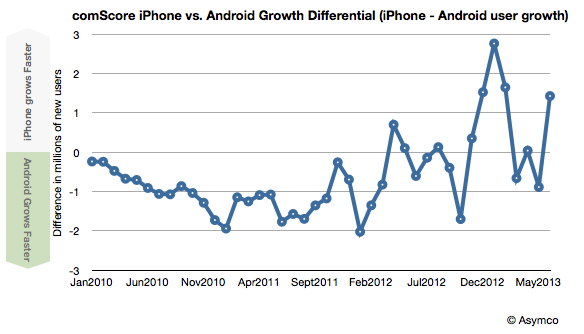
Indeed, iPhone gained more users than Android for the last 6 out of 8 months.
Bill, I think the smartphone market has always been competitive. [Only] the names have been changed.
Tim Cook responding to Bill Shope's question on the competitive landscape, April, 2013.
Indeed, over the years, the companies considered Apple's primary competitor have been many.
In years gone by in the phone market there were RIM and Nokia and Palm and HTC. In the iPod era there was Creative and Sony and innumerable others long forgotten (not to mention the tyranny of DRM).
Even today we struggle to decide whether Apple competes with Google first or Samsung. Or perhaps with the iPad it's with Amazon or Microsoft. Or maybe iTunes is threatened by Netflix or Spotify. The Mac surely competes with HP and Dell and Toshiba. What about iCloud? Clearly it's Dropbox or Google Drive. iWork? Both Office and Google Docs.
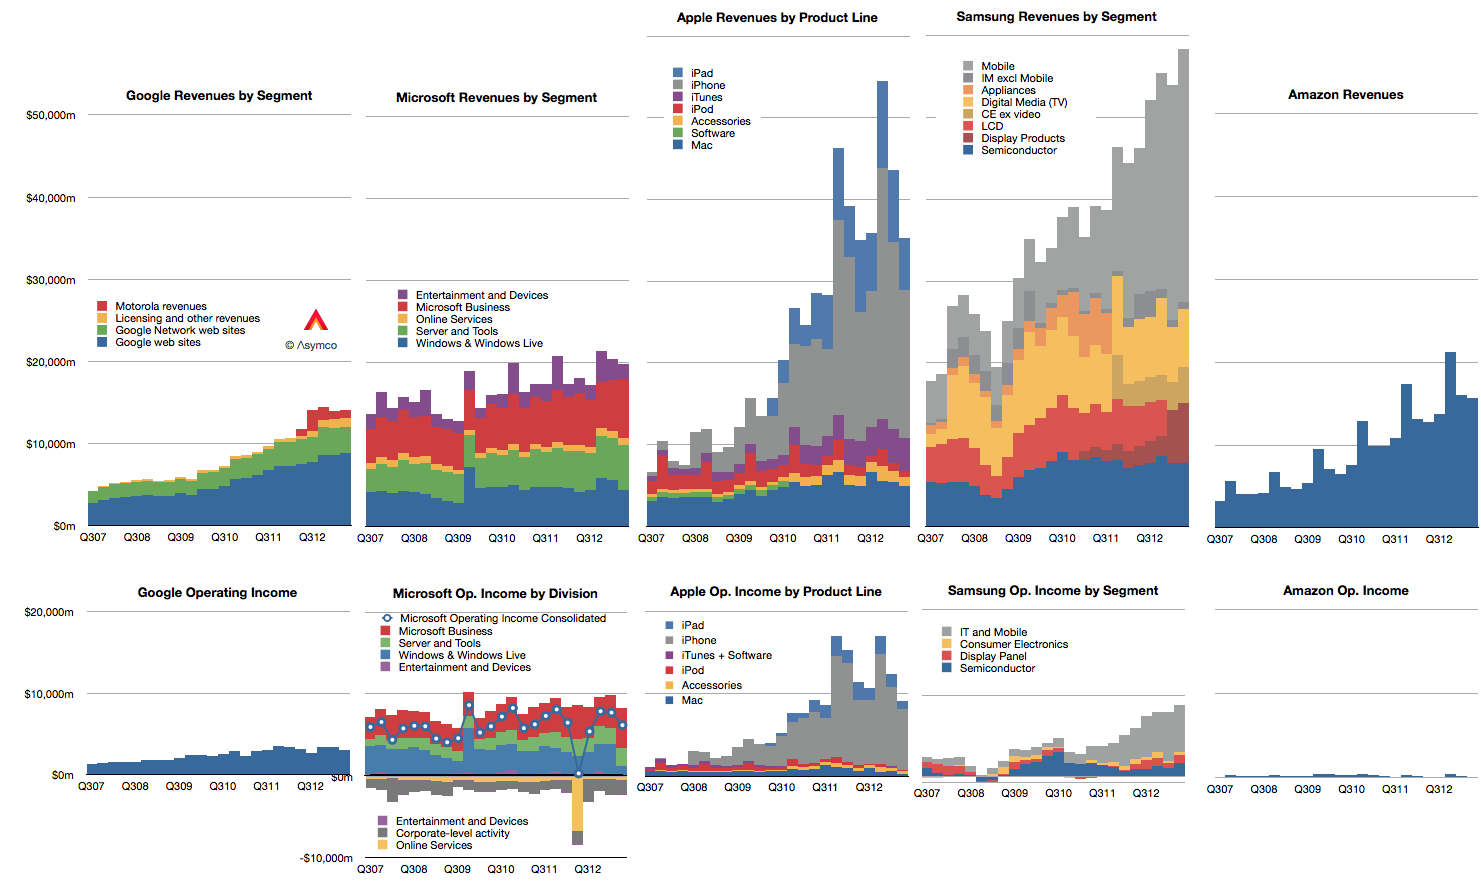
Doing a competitive analysis for Apple is then mostly a struggle of whom to compare it to. So forgive me that I only track the few challengers shown below.
Note also that these companies all may compete with Apple to some degree but they may not compete with each other. Competition, it seems, is not transitive.
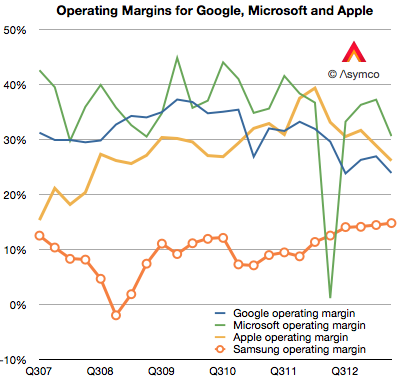
There isn't much that I can observe in the data that hasn't already been observed. Google shows steady but not spectacular growth in revenues with decreasing margins. Microsoft shows even more modest growth in revenues with flat earnings. Apple growth is moderating from near vertical while earnings pause. Samsung has great growth but there is a similar set of doubts about its sustainability and finally, Amazon continues to grow the top line by 20% and has nothing to show for it.
Operating margins have mostly fallen with the exception of Samsung whose increasing reliance on smartphones has led to a modest increase, though not nearly to the level of the others. (Amazon, lacking in profits, cannot be compared.)
In summary there is little change to report.
Except that it's been reported that in the last quarter Samsung managed to "dethrone" Apple from the phone operating profit crown. This is a matter of estimates and for that we need to understand clearly the assumptions.
I estimate that this is not the case. That indeed Apple remains most profitable phone maker by a wide margin.
To estimate operating margins you need to estimate gross margin and the allocation of operating expenses (SG&A and R&D) to a particular "division" or product line. The problem is that Apple does not operate as a divisional organization so its marketing and R&D budgets (i.e. people) are not assigned permanently. You have to move them around based on whatever is being worked on at any given time.
What's more, we need to account for the huge SG&A costs associated with iTunes and Retail. They both consume vast resources which cannot be allocated directly to any product. There are 41,000 people working in retail. Also, some of the expenses for iTunes are overhead and cannot be considered cost of sales. That's also SG&A. Then there's corp research and design (Mansfield and Ive), which are not allocated to any particular product. When you slice out these costs, there is very little to apply to iPhone, etc.
So if (and it's a big, sanctimonious if) you want to cast iPhone out as a separate business unit, it would be wildly profitable. There is a huge gross margin of 46% (this assumes a cost per unit of $316) and only another 5% of sales spent on engineering and marketing leaves a 41% operating margin or $7.4 billion. (Why only 5%? Because there's only 10.8% to allocate and after taking out iTunes, Retail you're really only left with 4.49% for SG&A and 3.3% for R&D or 7.79% so 5% is about two thirds of the operating budget).
If you take all of Samsung's IM division which is PCs, Tablets and phones their operating profit was only $5.6 billion.
You can see the difference in the grey areas of operating profit in the first graph above.
Bear in mind that this is still an artificial comparison. The split of profit between product groups is not only an estimate by the analyst, it would be an estimate for Apple itself since it has only one P/L.
Nokia's Windows (Smart)Phone performance was drowned out last week by Microsoft's big announcement of the Surface inventory write-off. They are pieces of the same puzzle however.
First, a look at Nokia.
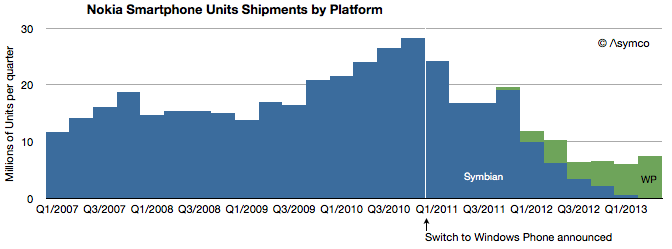
There were 7.4 million Lumia phones sold in Q2 with 0.5 million sold in the US. Although Windows Phones grew sequentially from 5.6 million the previous quarter, and up from 4.0 million in the same quarter last year, total smartphones are down y/y and nearly flat over the last four quarters. This is of course because Symbian phones have finally disappeared from volume shipments. The following graph shows the history of Nokia's smartphone shipments.
Although it's tempting to compare Lumia to iPhone (given the premium positioning in the US) the average price of €157 or $206 shows that Lumia is more adequately compared to Android. This is about a third of what Apple gets for its iPhones.
That's not necessarily a bad thing. Nokia's always had a knack for mass-market phones and certainly that was one reason Microsoft was attracted to them. Presumably, the promise of the relationship was to insert Windows Phone into the Nokia development and distribution pipeline, squeezing out costs and filling up channels.
The problem for the brand has been that although priced at Android levels, volumes are nowhere near and the gap is widening. At current activation rates, Android is selling 16.5x faster than Windows Phone (assuming 90% of Windows Phones are Lumia).
So Nokia's problems become Microsoft's problems. As bad as Nokia seems to be doing with Lumia, it's doing a lot better than Microsoft with hardware. Here the story of the great Surface write-off should give pause. Microsoft announced that it would write off $900 million of Surface. In terms of write-offs this is pretty significant. Compare it with the debacle of the PlayBook write-off when BlackBerry (then known as RIM) wrote off $485 million for tablets it could not sell. Or with Microsoft's own write-off for the Kin which took $240 million out of its shareholder's pockets. The only charge for hardware that I found higher was Microsoft's own Xbox 360 which cost it $1 billion for the "red ring of death".
But this is not an unusual situation at Microsoft. Besides Xbox, Kin and Surface, Microsoft also declared victory in (read: shut down) SPOT watches, the Smart Display, Tablet PCs and the Zune. This is why when I heard about the Surface I asked who would be Microsoft's Tim Cook.
By the way, $900 million write-off could amount to over 3 million devices, more if Microsoft is assuming some residual value in the inventory. Misjudging demand to such a degree that more units are disposed of than sold implies a basic failure of understanding of hardware businesses.
Which brings up the question of what Microsoft will do. They are likely to double down on hardware (also signaled by their re-org) simply because in a device world (read: post-PC) the economics of licensing Windows and Office are evaporating. The price points of EULAs simply don't hold and there are good enough alternatives in use by the hundreds of millions of iOS and Android devices out there already. By withholding Office from iOS and Android, Microsoft has shown a billion people that they can live without it and they already knew they could live without Windows.
So rather than fight, Microsoft chose to switch. Switching from software to hardware, however, is proving very hard. I'm sure quite a bit harder than management thought.
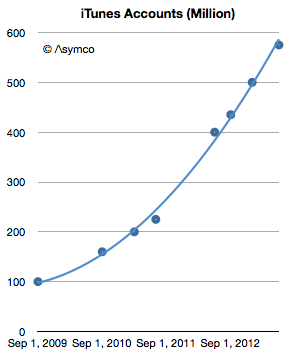
This week Apple announced that iTunes has 575 million accounts. This is the 8th update (that I know of) over the last four years. The history of this data is shown in the following graph.
The number of accounts has increased by almost a factor of six since late 2009. It amounts to an account growth rate of about 500,000/day or 44% compounded annually. Not bad, but along with this increase what happened to revenues per user?
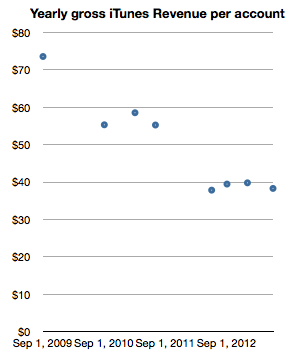
Looking at iTunes revenue (gross) reveals a picture of revenues/account, shown below:
This can be read as: "Each of the current 575 million accounts generates about half the revenue of the 100 million accounts of 2009." One would expect such a decline as an user base expands and this approximate 50% decline in revenues per account seems reasonable for a six-fold base increase. In absolute terms the graph shows that an iTunes account generates about $3.2/month in transactions.[1] Put another way, during the last year, an average of $40/yr of economic value is generated by every iTunes account.
Stretching further, one could also use the 575 million iTunes accounts as a proxy for "the Apple customer base". The assumption would be that iTunes accounts are attached to some Apple product, be it an iPhone, iPod or Mac. As a bounds check, a total of 865 million Apple devices (which interact with iTunes) have been sold since 2007. Assuming 575 million users does not seem to be a contradiction.
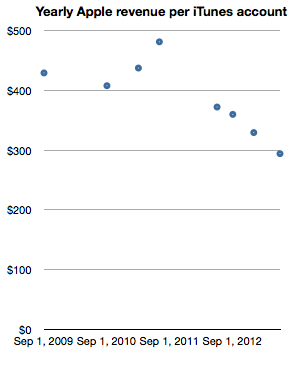
The logic deployed would be that it's unlikely for a consumer to have an iTunes account without owning or using an Apple product. If we take this leap in logic then it would make sense to measure Apple (not just iTunes) revenues per iTunes account. In order to smooth out seasonality I took trailing twelve months' average quarterly revenues and measured the following company revenues per iTunes account.
Note again the reduction in revenue per "customer" as the base grows. The reduction is less pronounced however, with about one third lower spending for a sextupling of the base. One can read this graph as "Three years ago an Apple customer used to spend $400/yr on Apple products but as the number of users increased six-fold the spending decreased to about $300/yr per customer."
The practice of valuing a company by the rate of spending of its customer base is not uncommon, especially when the customer base is relatively loyal. Apple emphasized the importance of customer satisfaction (and, implicitly, loyalty) during its WWDC presentation. It was singled out as the most important metric they track. So perhaps valuing Apple itself on the basis of repeat purchase behavior should be considered.
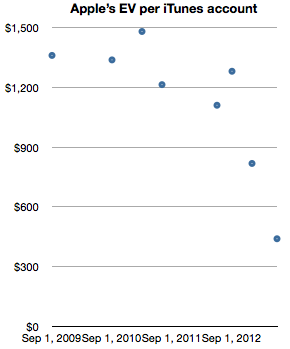
When framing the value of of the company itself as a function of users (in the form of iTunes accounts) we get the following graph.
The graph measures the Enterprise Value (i.e. Market cap minus cash) on a per-customer (i.e. iTunes account) basis.
It shows that for a number of years—from 2009 until late 2012—Apple's users were valued (implicitly by the stock market) as likely to create a net present value of about $1200 in earnings. The current value is about a third of that, or $440 in earnings. Today's expectation is therefore that each current customer will buy the equivalent of 1.8 iPhones. And nothing more, ever. A few months ago it was expected that each customer would buy three times as much.
Although the rate of spending of each customer is decreasing, the number of new customers is increasing more rapidly. As this is happening the company's equity is being priced such that an Apple user is considered less than half as valuable as she used to be—from 3.2x revenues to 1.5x revenues. This change in user value has been quite abrupt, happening only within the last nine months. What could justify a drop in user value would be a drop in customer satisfaction or loyalty. So far, I have seen no evidence of this happening.
--
Notes:
Note that these revenues include App Store, Music Store, TV Shows, Movies, iBookstore, Mac App store, and Services (including iCloud). Some of this revenue is not reported as part of Apple's statement of operations since some content is treated with an agency model.
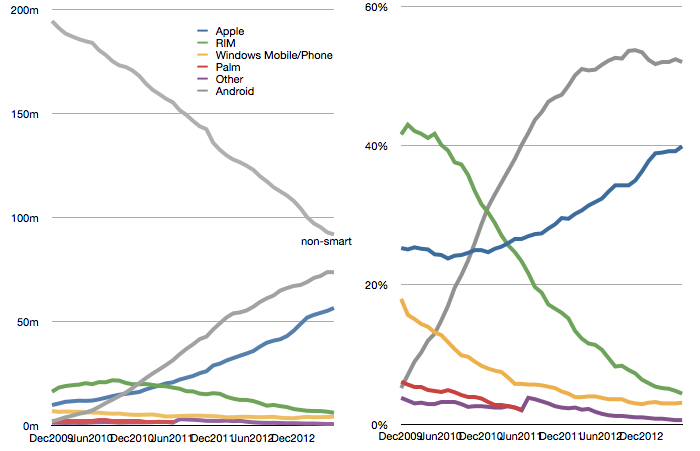
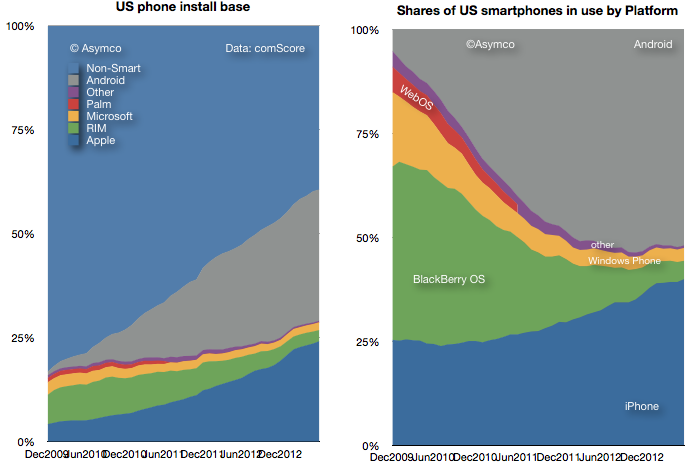
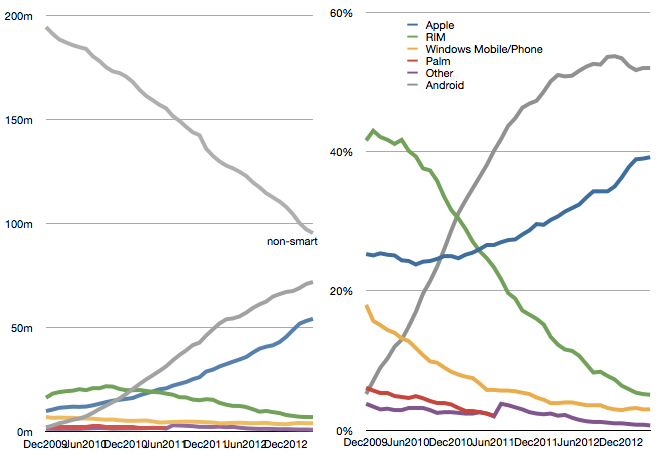
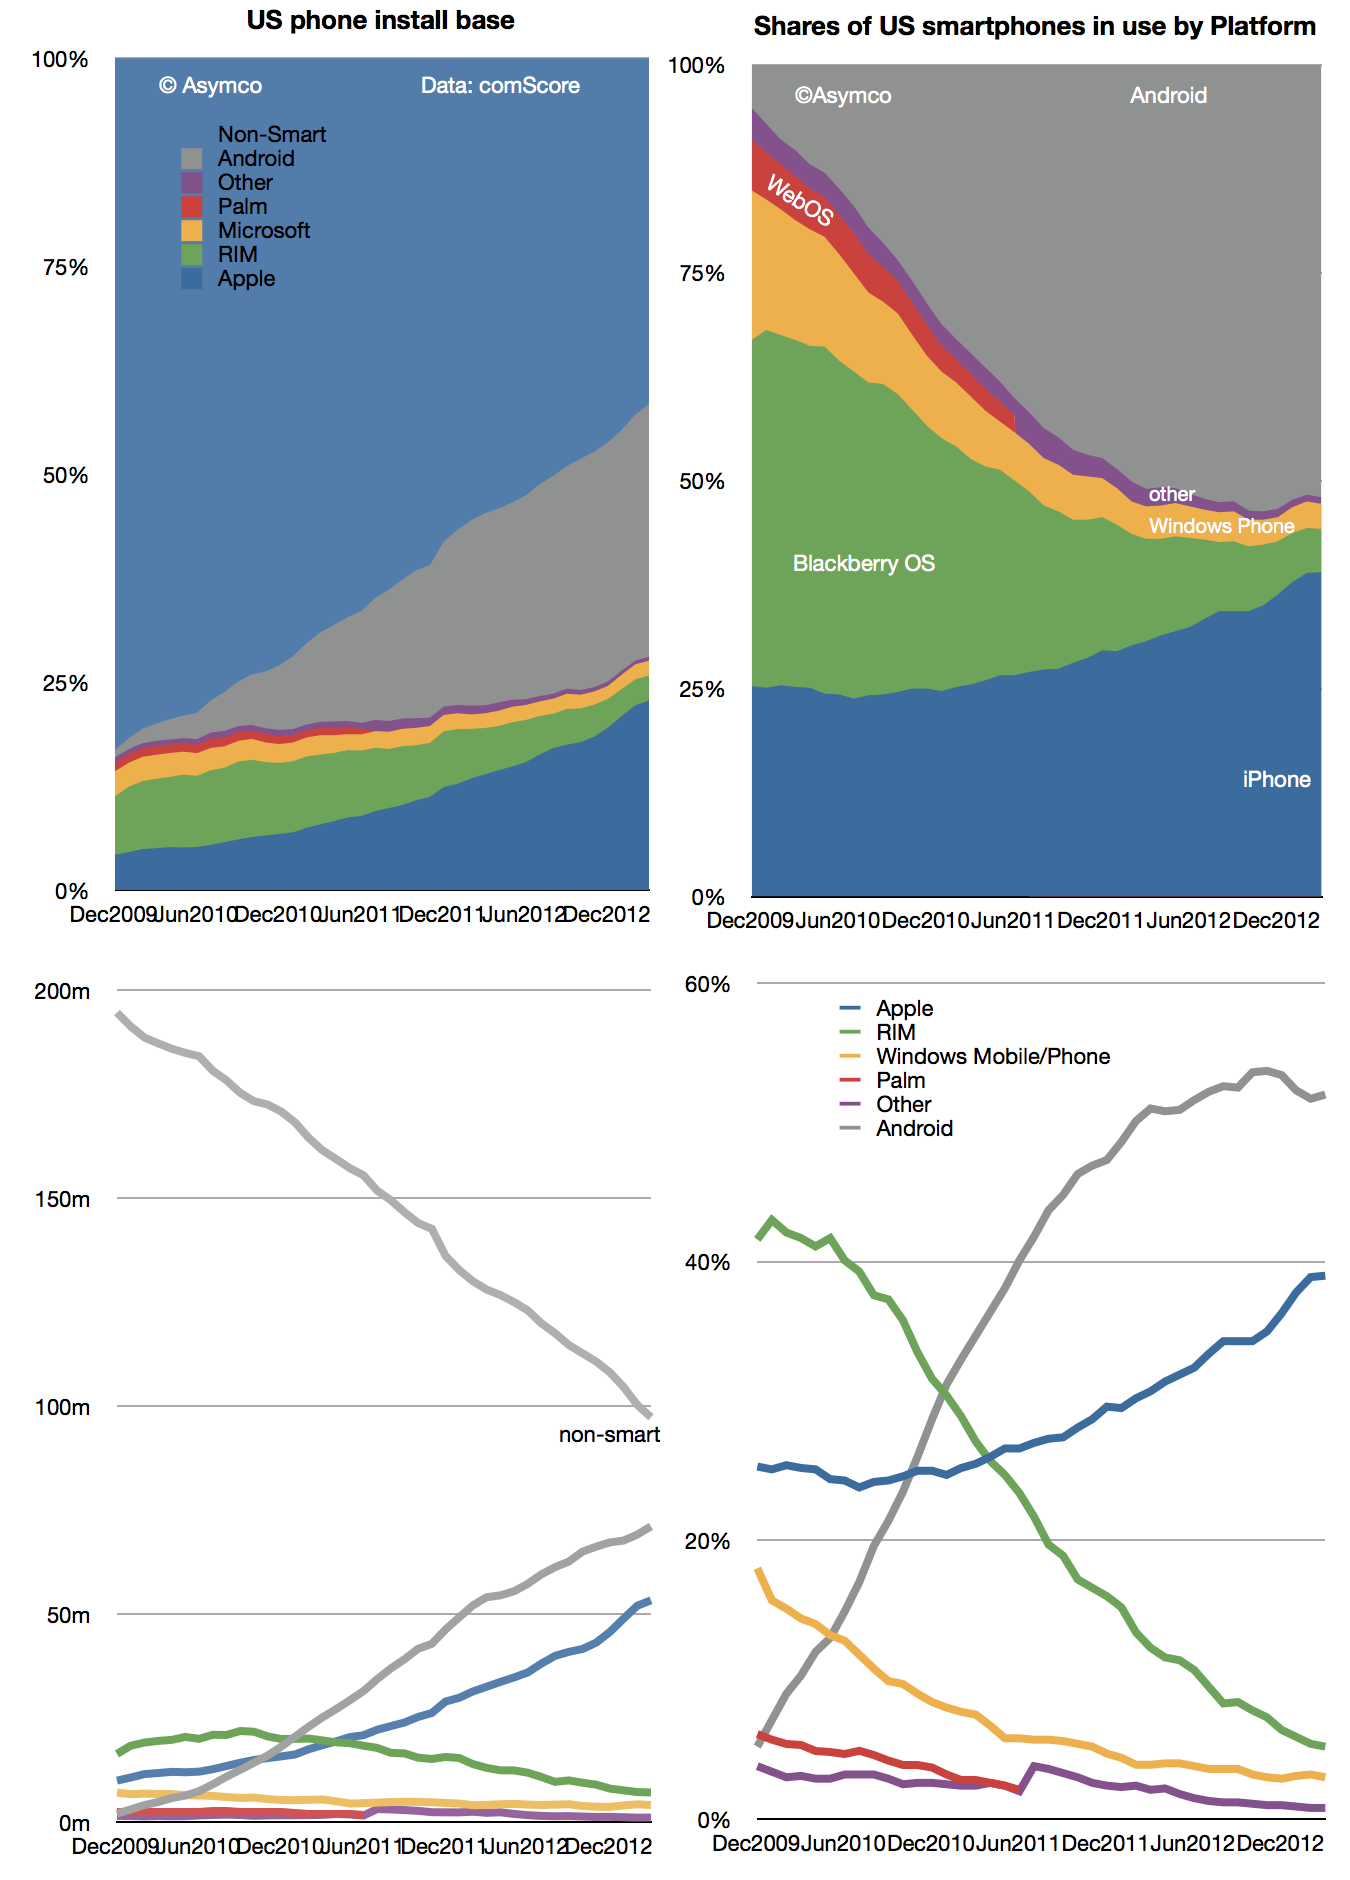
The latest comScore US smartphone install base data is in and there are few surprises. iPhone has reached a new record high penetration (39.2%) and user base (54.3 million). Android has reached a new high in user base (72 million) but share at 52% is below the peak reached in November 2012.
This pattern of gradual iPhone share gain in the US has been consistent for over two years even while Android has catapulted into an overall lead. The surprising thing is how Android seems to have peaked in share. There are still 95 million non-smartphone users and there seems to be headroom for growth even though the other platforms have been tapped out. But it does not seem that Android phones have any particular advantage over iPhone. My hypothesis remains that as price is taken out as a differentiation, the adoption of iOS is slightly higher than Android.
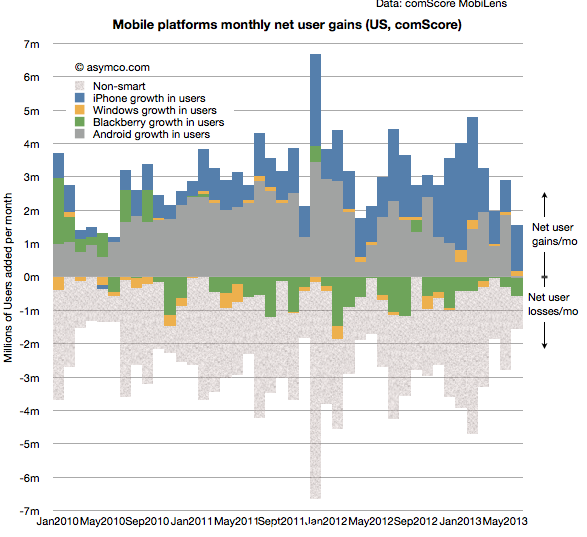
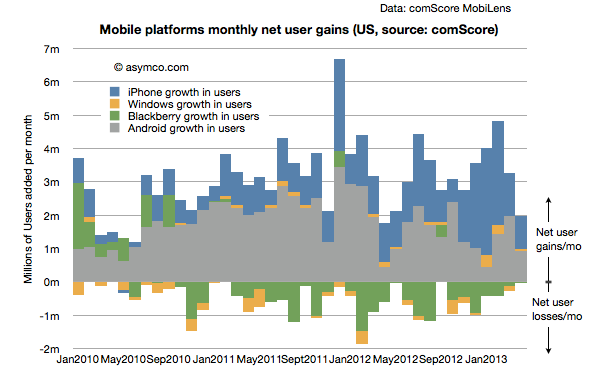
Another measure of market performance is the implied net platform user gains which is shown below:
It shows that iOS added more users in the last few months than Android.
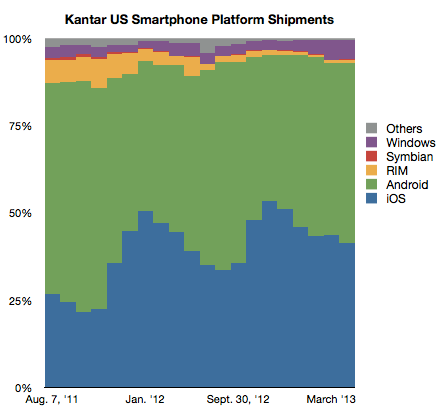
The problem is that Kantar Worldpanel measures shipments and their share data shows a seemingly different picture.
In their data Android is shown as selling more units during January through April while Apple sold more during October through December. Of course we don't have the absolute number of units so can't see the effect of higher holiday overall sales volume. Nevertheless, the balance of growth seems to be disproportionately in favor of Android relative to the data from comScore.
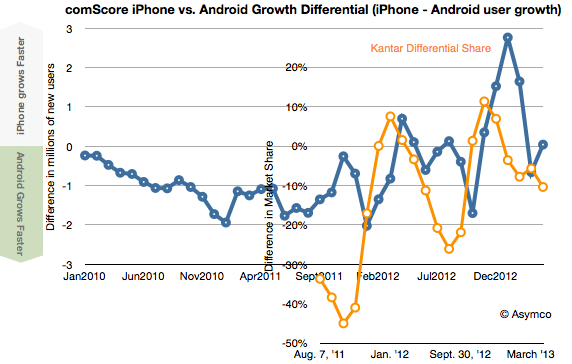
To look at the situation more closely I measured the differential in user adds for comScore and the differential in market share for Kantar's data. Then I overlaid the two differentials so that months are matching, as shown below:
There is a similarity to the frequency of oscillation with comScore data showing a delay (as would be expected since their data is sampling over a three month period). However, we are still facing a vertical offset where there is apparently more growth bias for iPhone in the comScore data.
Possible factors which might be explanatory:
Methodologies used. comScore data excludes ages below 13 and non-personal devices (business expensed phones.)
Replacement sales are invisible in comScore data since the user base does not change when phones are replaced (and old ones are discarded.)
Missing data from Kantar. Given their survey methods it's possible that their panels miss some market segments.
Tim Cook was asked the first question (on the iPhone portfolio). His answer is paraphrased here:
We haven't so far. That doesn't shut off the future. Why? It takes a lot of really hard work to do a phone right when you manage the hardware and software and services in it. We've chosen to put our energy on doing that right. We haven't been focused on working multiple lines.
Think about the evolution of the iPod over time. The shuffle didn't have the same functionality as other products. It was a really good product, but it played a different role — it was great for some customers it was strikingly different than other iPods. The mini played a different role than the classic did. If you remember when we brought out the mini people said we'd never sell any. It was too expensive and had too little storage. The mini proved that people want something lighter, thinner, smaller. My only point is that these products all served a different person, a different type, a different need. For the phone that is the question. Are we now at a point that we need to do that?
…
At a macro level, a large screen today comes with a lot of tradeoffs. When you look at the size, but they also look at things like do the photos show the proper color? The white balance, the reflectivity, battery life. The longevity of the display. There are a bunch of things that are very important. What our customers want is for us to weigh those and come out with a decision. At this point we think the Retina display is the best. In a hypothetical world where those tradeoffs didn't exist, you could see a bigger screen as a differentiator.
Full interview here, answer begins around minute 37.
Here is how I interpret the answer:
The iPhone portfolio may still arrive. It hasn't so far because the cost/benefit is not there for Apple. On one hand it would take a great deal more sourcing effort and risk while dealing with constraints in production. On the other it would not not offer meaningful additions to the customer base. At least so far. The economics and the demand may change (or have changed) and the time will come for a broader portfolio.
The comparison to iPod is not entirely appropriate because as a music player, the iPod had a relatively small set of jobs to do. It was hired for exercise, escapism, isolation, etc. It was not hired for apps and services which extend the medium itself. In other words it was not a computer. As a computer, the iPhone has a near infinite set of jobs to be done and it's the hundreds of thousands of apps which help it perform them. But as a result the iPhone needs to conform to the dynamics of ecosystems and that means consistency of APIs and user experience. It cannot vary in terms of input methods, or be below minimum requirements of screen size or memory and power.
Because of the rapidly expanding job space, Apple believes the iPhone was not "good enough" for all these years. The improvements shipped for each generation were all "meaningful" in that they were valuable and absorbable. Users would use the new features (like better screens, cameras, battery, etc.) and they were willing to pay for them (as evidenced by the sustained high average price).
On the question of what the extension might be, changing screen size is one dimension but it has to be balanced by performance gains that don't detract from other dimensions. Engineering is all about compromise and consumers pay Apple to make these compromises in an intelligent way. Apple does not come to an answer to the question of balance by launching many products and seeing what works. It cannot afford to dilute its brand with a long list of failures. Other brands may not be affected by trial-and-error approaches to the market but they are discounted by the customer accordingly.
Next week at AllThingsD's D11 conference in LA, Apple CEO Tim Cook will be interviewed by Kara Swisher and Walt Mossberg.
Here are some questions I'm hoping they will ask:
Why is the iPhone not sold as a portfolio product? Meaning, why, after six years, is there no iPhone product range being updated on a regular basis. Having a portfolio strategy is not only followed by every phone vendor but also by Apple for all its other product lines, including the iPad, which came after the iPhone. In other words, please explain why the iPhone is anomalous from a product portfolio point of view.
There are more than 800 operators world-wide so why are there only about 250 of them carrying your phone? Competitors large and small (from BlackBerry to Nokia to Samsung) have cited relationships with more than 500 operators so Apple is being uniquely selective. My question does not stem from a lack of patience: this total number of iPhone distributors has not increased markedly for over a year. Are you limiting distribution through conditions placed on operators (like the availability of sufficient quality data services) or are operators finding the distribution agreement too onerous (e.g. too high a minimum order quota)?
In 2012 Apple's capital spending has reached the extraordinary level of $10 billion/yr, higher than all but the most capital-intensive semiconductor manufacturers. This is unusual for Apple as it was less than $1 billion in the year before the iPhone launched. It's also unusual for Apple's competitors in phones, PCs or tablets. It's on a level matched only by semiconductor heavyweights. What is the purpose of this spending and what should we read into it leveling off at $10 billion for 2013?
Depending on one supplier is an operational faux pas, and yet Apple has found itself in that situation with Samsung for mobile microprocessors. It may be excusable in PCs with Intel having an architectural monopoly but it's not excusable for a chip that you designed yourself and purchase in massive quantities. Why did you give Samsung such a concession, especially knowing their potential as a competitor vis-à-vis alternative suppliers who had no such potential? Does the answer have something to do with the previous question?
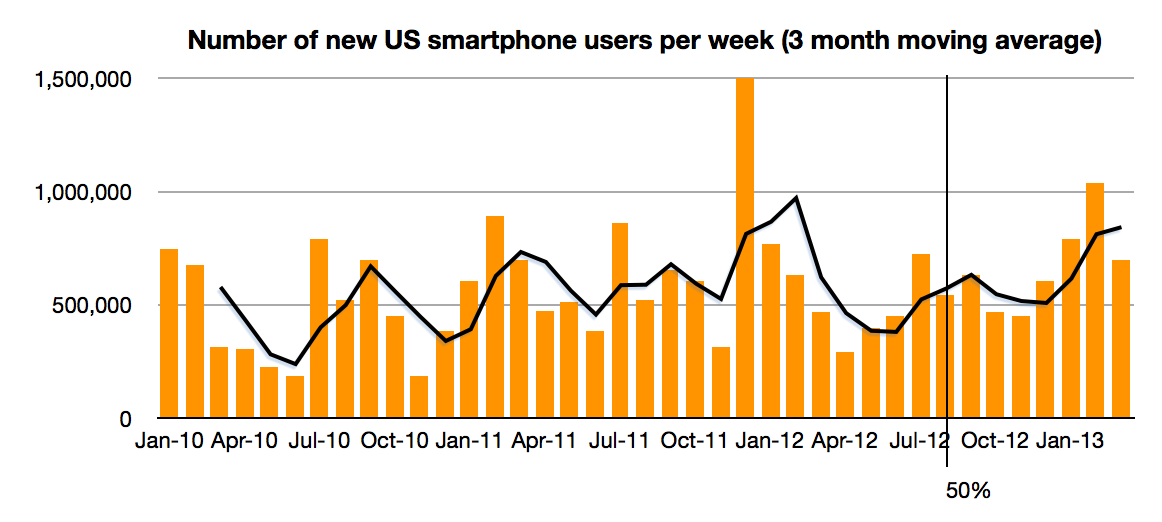
The latest comScore data shows consistent growth in US smartphone penetration. The rate is now 58.4% of adult consumers who own phones. This is up from 20% only three years ago. The rate of growth remains a remarkable 1.2% per month. That's 700,000 new-to-smartphone users every week. The historic average over 3 years has been 1.07%/month This after having crossed over 50% on schedule in August 2012. There appears to be no slowing.
The next milestone I have pencilled in is the 80% mark which I extrapolate to be achieved by October 2014. 80% could be considered "saturation" which would signify a rapid slowing of new user addition. However, that might still not happen until 100%, depending on the availability (or lack thereof) of non-smartphones to buy.
This time frame is important because it would imply that essentially all mobile users in the US (some 234 million) would be a part of one ecosystem in about 2 more years. That's less than the life cycle of the typical mobile contract (and thus the life of one phone). Put another way, by the time a new buyer today is ready to buy the replacement to their phone the market will be saturated.
This implies the mode of competition will be changing to smartphone replacement rather than smartphone adoption. To some degree this is already happening but as the net user gains data shows only BlackBerry and Windows platforms have had any net user declines in the last two years. "Platform churn" is still a relatively rare phenomenon.
How that will change post-saturation will be a crucial determinant to platform growth. The data today points to a higher degree of loyalty for iOS users and potential erosion in the Android user base as a result. There are ways of forecasting this on the basis of survey data as Carl Howe did. However, the data from comScore has already begun to show that Android may have peaked around 54% share. Android share is now at the same level it was in July while iPhone share has grown by more than 6 points since then.
There is a pattern of higher growth into the end of the year and an iPhone plateau into the first quarter, undoubtedly due to holiday buying favoring the iPhone. I don't want to discount the possibility of some change in this pattern but so far there seems to be a plausible reason for it: with iPhone pricing and availability in the US offering no advantages to alternatives, Apple's product is the most popular. Nearly more popular even than all the other competitors combined.
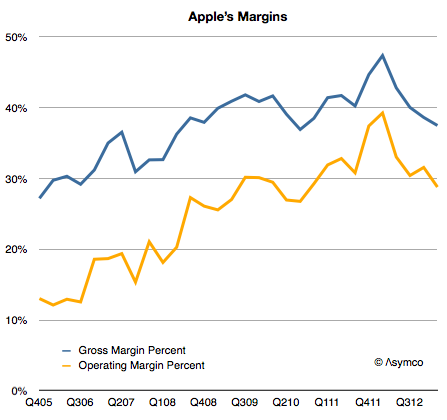
I expected Apple's margins to improve last quarter. They didn't and so the question I needed to answer is why. Here is a history of Apple's gross margin and operating margin as reported since late 2005:
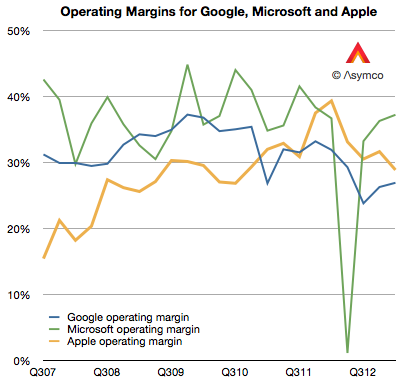
For a company selling hardware these are extraordinarily high margins. They are higher than those of Google and have narrowed the gap with Microsoft, neither of which has a high proportion of hardware sales:
But they are not growing and the reason is to be found in the reason they grew in the first place: because of proportion of iPhones making up the total sales.
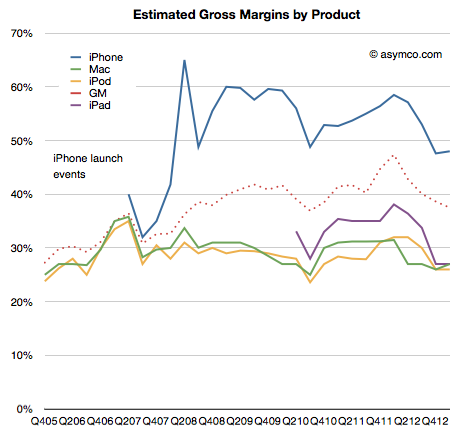
As a reminder, the iPhone is a uniquely profitable product. I estimate that it obtains about 50% gross margins. The history of these estimates is shown below:
It remains in stark contrast to the margins Apple obtains for its other products. Much of that is due to the pricing power of the product as shown below:
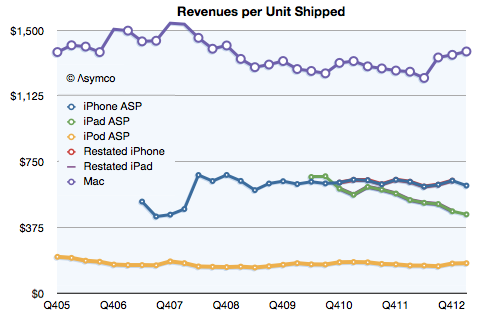
Notice that even after the launch of the iPhone 5 and the persistence of two previous generations of iPhones (and their lowered pricing) has barely put pressure on pricing.
Contrast that with the iPad. As its breadth of offerings increases, it causes a lower price per unit. The iPhone is now at $613 per unit, even with two older generation products available. (The lowest price was in Q2 2012 when the average price was $608.) The iPad is at $449 per unit, down from $662 at launch three years earlier.
So overall, margin is a function of three things:
Price changes: iPhone had a small reduction (from $635 to $613) but the iPad has had a moderate reduction in price (from $531 to $449).
Cost of components: This is reflected in product-line gross margins which can only be estimated. Compared to last year I estimate that iPhone gross margin dropped from 58% to 48%. iPad margins also fell from about 38% to 27%. The reasons were given by management as "Last year, our business benefited from …a more favorable foreign currency environment, and historically low costs."
Mix of high and low margin products. The iPhone units grew at 7% but the iPad units grew by 65%. A year ago iPhones were 58% of revenues and this year they were 53%. The iPads were 17% and now they are 20%.
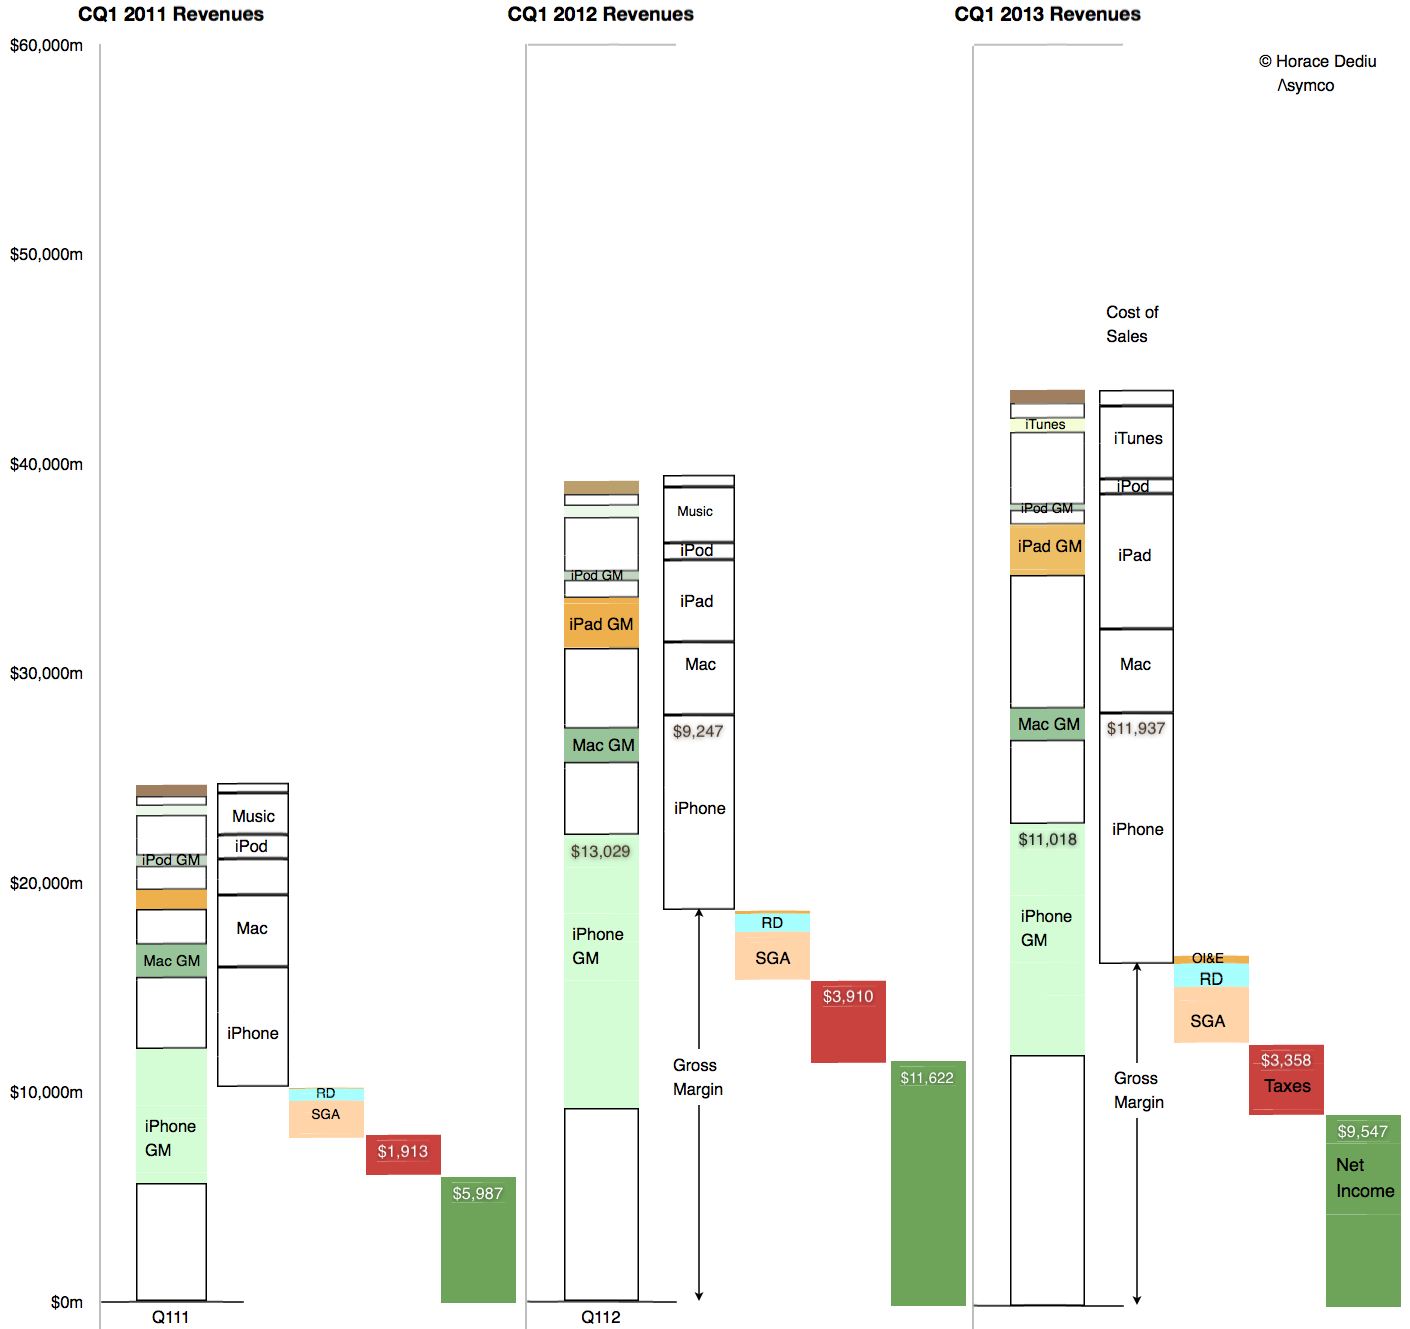
The result is seen in this one graph showing the allocation of revenues and margins by product:
So what is surprising? My expectations were met in terms of iPhone units (and exceeded in terms of iPad units). The mix was also something that falls out of the unit expectations. The pricing is also not surprising.
My guess is that the largest contribution to the "reduction of margin" is the increased cost of components. Note that the graph implies that even though iPhone revenues were nearly flat at 3% growth, the cost of those revenues went up by 29%! In addition, the iPad revenues grew 40% while costs went up 65%.
Unit pricing (and implicitly competitive pressure) is still not the primary cause of the reduction in Apple's margins. Indeed, the curious thing is that margins are now at levels seen for most of 2009 and 2010, a time when the iPhone (and iPad) were seen as near monopolies in their respective categories.
I repeat what I’ve mentioned before: The iPhone is primarily hired as a premium network service salesman. It receives a “commission” for selling a premium service in the form of a premium price. Because it’s so good at it, the premium is quite high.
The original post on the hiring of the iPhone by operators was anchored in data about the revenue per unit (or price) that the product was able to obtain. The remarkable resilience in the exceptionally high average price showed that the iPhone was still getting a premium for moving users to higher levels of spending on network services.
The evidence was circumstantial however: By knowing the price and knowing it was far higher than competing products and knowing that much of it was paid by the operator and not the consumer (at least not up-front) implied that it was the iPhone, and only the iPhone, that was hired as a network service sales tool.
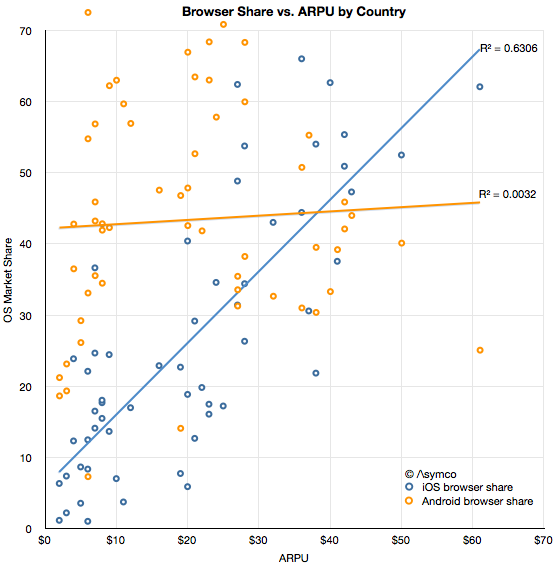
Now we have more evidence thanks to Ben Thompson (@monkbent). I illustrate the data here as an x-y scatterplot.
The data consists of ARPU (Average Revenue per User) ITU data from 2010 for 60 countries combined with browser share data on a country-level from the current period (sourced from StatCounter).
The first observation is that there is a modest correlation between iOS usage and ARPU. It may not be particularly interesting by itself but it is interesting when compared with the lack of correlation between Android usage and ARPU.
The presumption behind smartphone usage is that it leads to more browsing which leads to more network usage which in turn, leads to more network revenues and, finally, more network investment. If there is no additional browsing then there is a far smaller economic incentive to network operators to invest in infrastructure. It is this link between usage and revenues which I hypothesize drives operators to carry, subsidize and promote the iPhone. And the resilience of this link indicates that it still works.
The ASP data seems to support this hypothesis and so does the ARPU data. The more iOS is in relative use, the higher the network revenue per user. Correlation is not causation, but when combined with data about Android, we can also say that the presence of the primary iOS alternative does not lead to more revenue. In other words, if a lot of iOS is present then revenues are higher and if there is little iOS present then revenues are not higher.
I'm not suggesting that Android users use less bandwidth—the share data is after all relative—but rather that Android use itself does not seem coupled to paying more (or less) for service.
If there is something to be concluded it's that not all usage is created equal. The data regarding how apps and ads are consumed is consistent with a qualitative difference between iOS and Android. This data is more of the same.
It's something of a cliché to say that audiences vary in terms of quality, but that does not make it less true. Indeed, network operators depend on it being true. And so does Apple.