Asymco

Asymmetric Intelligence

iPhone

  1. The parable of Nintendo

    Research · 109 comments

    With the launch of the Wii console, Nintendo averted disaster. When the Wii launched in late 2006 Nintendo had been facing the simultaneous attack from the "seventh generation" Xbox 360 which launched a year earlier as well as the PlayStation 3, both of which set as their bases of competition 3D graphics at HD resolutions. Many wrote off the company and called the console market a two horse race.

    Then, in what seemed a desperate downward leap, the Wii was launched into a different trajectory. It addressed non-consumers with a new, more intuitive controller and standard resolution rather than competing for hardcore gamers with more power and richer graphics.

    Because the Wii was asymmetric and addressed non-consumption rather than trying to be a "better" console in what was becoming a horsepower race, Nintendo expanded the console market. Its innovation was interesting enough that many hard core gamers used the console in addition to a PS3 or Xbox and many non-gamers bought it as their first console.

    The result is that 95 million Wii's have been sold vs. 66 million Xbox 360's and 62 million PS3's.

    The effect of the Wii introduction on Nintendo's console unit sales is shown below (pink line).
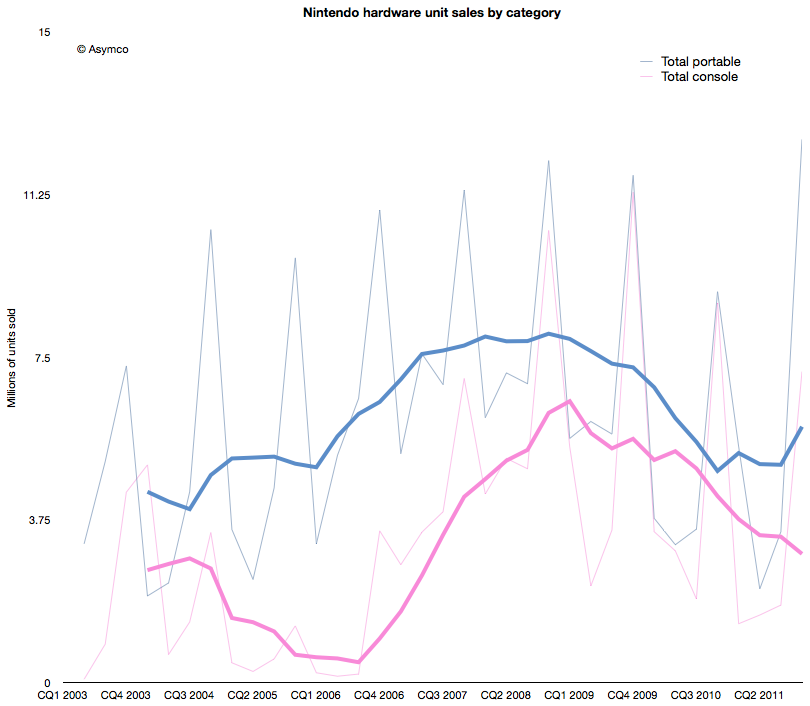
    The graph above shows that the growth from Wii has stopped. In fact, the console has been in decline since early 2009. Fortunately for Nintendo, the company also developed a mobile strategy. Learning from its Game Boy device, its DS series of portable game consoles allowed the company to diversify its portfolio. The graph also shows the total portable units sold in blue.

    However, this strategy has not been enough to protect the company from the disruptive effect of mobile computing. As the following chart shows, each new generation of portable from Nintendo has failed to break out of a general pattern of overall decline.
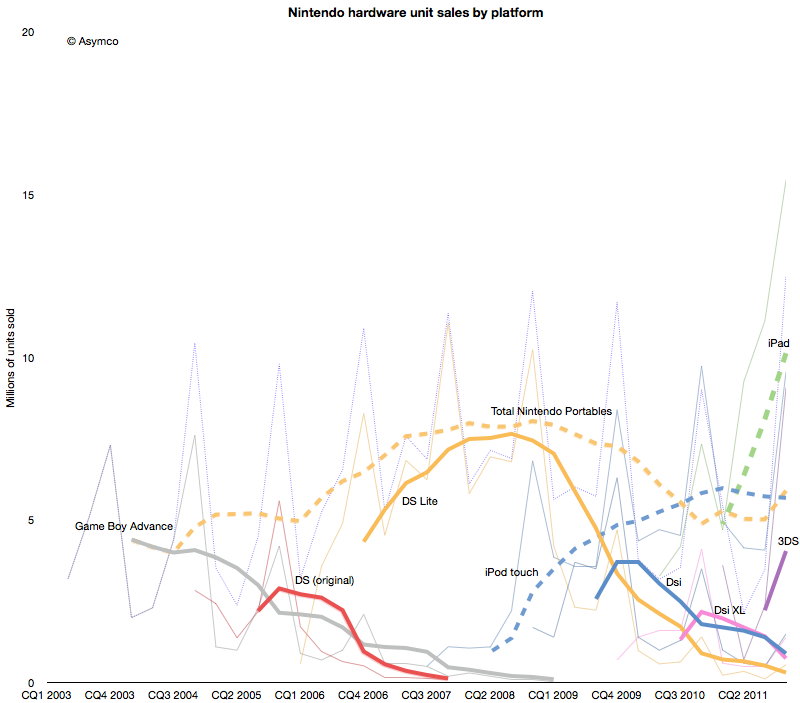
     

    Contrast the DS product patterns with the iPod touch and iPad--multi-purpose products whose game functionality is "good enough" but whose communications and general-purpose app catalogs are re-defining the basis of competition yet again.

    Nintendo bet on the 3DS to reboot the franchise. The 3DS product does show the characteristic initial spike in adoption but the level it launched at is far lower  than the level of the iPad. Nintendo has a big hill to climb to even recover the volumes it held in 2009. In contrast, the usurper Apple's volumes are doubling each year.

    When products are compared as "ramps" in terms of growth post-launch the story becomes even clearer.
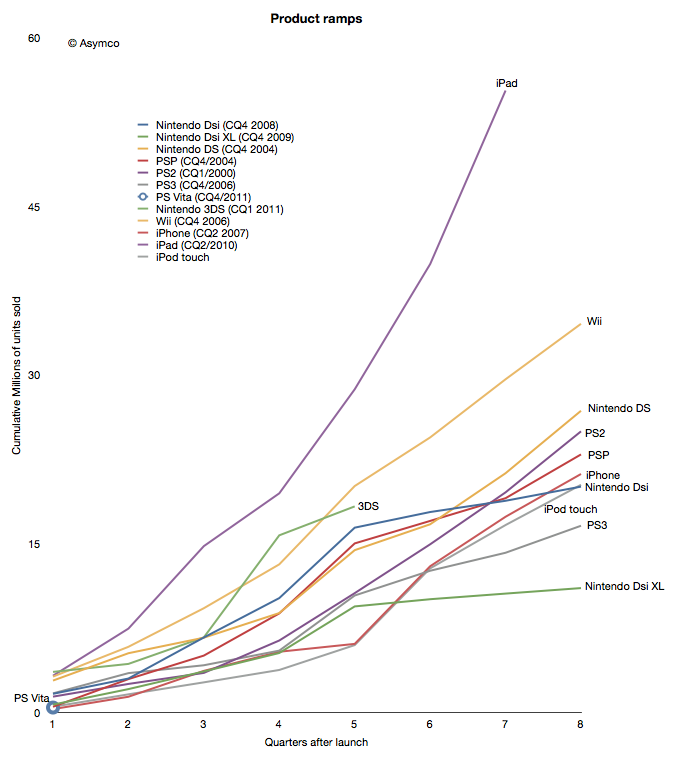
    Although the iPhone and iPod touch ramped in similar ways[1] to the gaming platforms, iPad took an entirely different path. The 3DS benefited temporarily from a price cut but it seems to be returning to a well-worn trajectory.

    The data points a bleak picture for Nintendo. The Wii was a success due to its competitiveness vs. non-consumption of gaming. But another low end disruption took hold in 2007. Good enough games on phones and mobile computers are taking consumption away from dedicated consoles, both fixed and mobile.

    In addition, the rate at which game experiences are improving on iOS imply that they will overtake the "quality" of consoles in the not too distant future. Differences in distribution models also guarantee lower pricing for software for end users and enabling a far larger catalog of titles.[2]

    This may sound like another story of fortune gained and fortune lost. The inevitable "what goes up must come down" aphorism. We become used to this pattern and assume it to be axiomatic. But there are causes for each success and causes for each failure.

    The lesson here is that a company that disrupts does not necessarily survive. Long term survival depends on the ability for serial disruption. Serial disruption is an uncomfortable state for an organization to exist in. As the story above shows, disruptions are usually enabled by "desperate" necessity. Desperation is not something management is trained to aspire for.

    What management strives for is steady state satisfaction and predictability from intelligent planning.

    ---

    Notes:

    1. Though the iPhone ramp matched the consoles, the growth for the iPhone is persisting at 100% y/y five years into the product. This means it is outstripping all console installed bases by at least a factor of 2.
    2. The catalog is not only broad but deep in the sense that there are many new game concepts and experiments being tried. The app store is a vast testbed for game and entertainment ideas.
  2. Estimates for Apple's second fiscal 2012 quarter

    Research · 74 comments

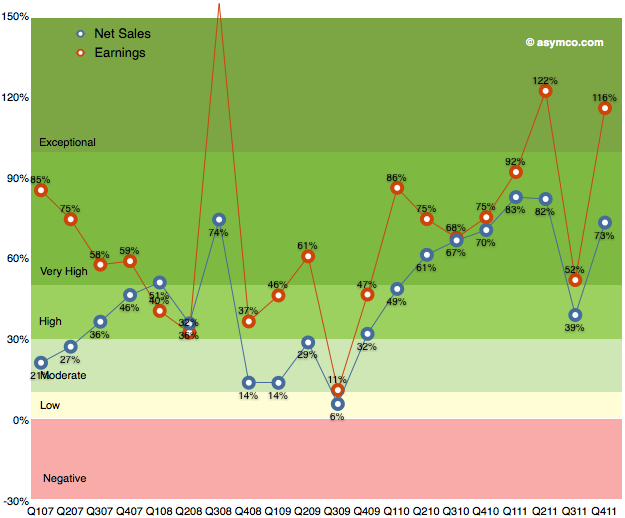
    As the chart below shows, the last quarter (fourth calendar 2011, first fiscal 2012) was robust with 116% earnings growth and 73% net sales growth. I've heard many superlatives used to describe it. It is certainly exceptional but it was not as good as the second calendar quarter of 2011.

    Sales grew faster both in CQ1 and CQ2 of 2011 and earnings grew faster in CQ2. It was in many ways a return to normality due to the iPhone returning to 133% revenue growth after the lull of the transitional third quarter.

    Now it's time to consider the current quarter. It's already quite late in the quarter to make predictions, but I waited to hear some data about the iPad. The iPad remains a difficult product to forecast. Mainly because it is a new category and the pattern of growth takes a long time to establish. We've only had three quarters where y/y growth could be measured. Sales growth has been 180%, 146% and 99%. Unit growth has been 183%, 166% and 110%.

    These rates have been higher than the average iPhone growth rates (average of which was 100% in units and 108% in revenues over the calendar 2011). Indeed, the average iPad growth rate so far seems to be 150%.

    Is it sustainable?

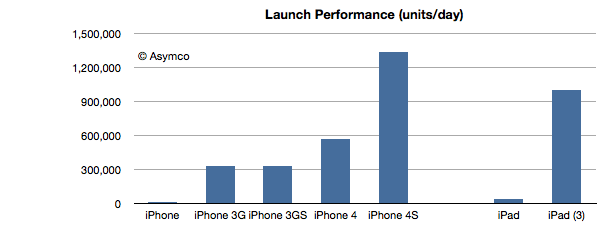
    The answer from this latest launch seems to be yes. The following chart shows the launch performance of the various iOS devices whose launch performance has been announced.

    The growth in launch performance between iPad 1 and iPad 3 is a factor of 28. iPad third generation had broader distribution but the volume boost from first generation is enormous. This implies a vastly improved production ramp. As the product remains supply constrained, the most important indicator of performance is production throughput.

    So given this data on the iPad and the ongoing broadening of the iPhone distribution network, here are my first quarter estimates (with y/y growth in parentheses):

    • iPhone units: 37.3 million (100%)
    • Macs: 4.7 million (25%)
    • iPads: 12.2 million (160%)
    • iPods: 7 million (-22%)
    • Music (incl. app) rev. growth: 40%
    • Peripherals rev. growth: 25%
    • Software rev. growth: 10%
    • Total revenues: $42.7 billion (growth: 73%)
    • GM: 44.7%
    • EPS: $12.0 (88%)

    This earnings value would imply a trailing twelve months’ EPS of about $40.7. At $600/share the P/E would be 14.7. Cash and equivalents will probably increase to $108 billion.


  3. Segmenting the iPhone opportunity

    Research · 45 comments

    We've been very, very focused on China. China, we've had incredible success with iPhone. Over the past few years, we've gone from a few hundred million dollars of revenue in greater China, to last year $13 billion. So we really've been focused on trying to understand the market there and then taking those learnings to other markets. As it turns out--and not very many people agree with me on this, probably--but what I see is that there's a lot of commonality in what people around the world want.

    Transcript: Apple CEO Tim Cook at Goldman Sachs - Apple 2.0 - Fortune Tech

    People do want the same things globally, but due to various constraints they typically don't get the same things at the same time.

    One of the most important constraints on the purchase of iPhones is the state of 3G (or, more broadly, mobile broadband) networks. An iPhone is a mobile computer whose primary value is derived from high bandwidth data communication. Because this bandwidth is not universally available, the iPhone faces a restricted addressable market.

    The good news is that 3G networks are being adopted very quickly. The International Telecommunications Union reports that 20% of mobile users have "active subscriptions to mobile broadband" (1.2 billion out of 6 billion). That's encouraging but the subscription rate varies widely by country. Ideally we should look at the data on a country-by-country basis.

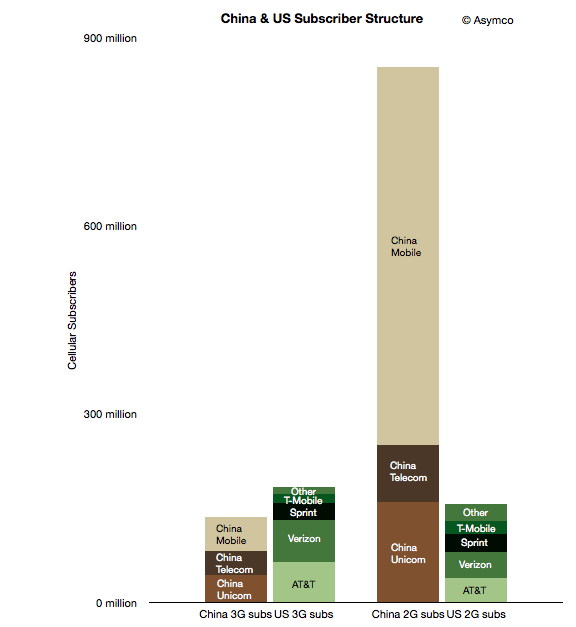
    To start, I took a look at two countries which may form an interesting sample: the US and China. The following chart shows the subscriber structure in the two countries grouped by 2G/3G subscription and by operator.

    The two left-most columns represent nominally addressable iPhone markets. The two right-most columns represent currently unaddressable markets. Note that

    although China is a far bigger market, the lower 3G penetration means that the theoretically "addressable" market for the iPhone is smaller in China than in the US (136 million vs. 183 million respectively).

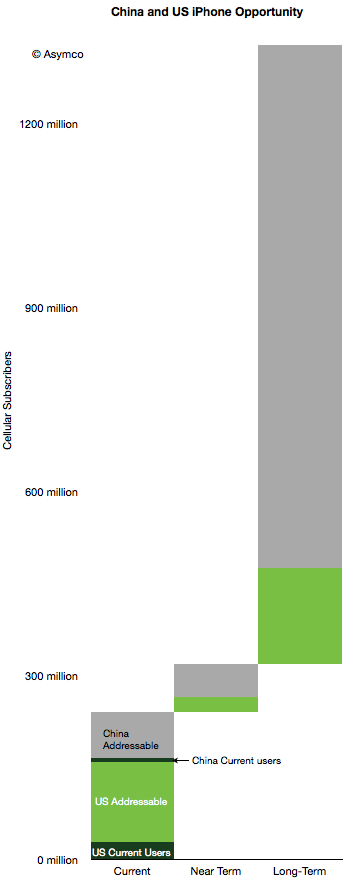
    However, there are further restrictions. Apple does not have distribution agreements with many (most?) of the world's operators. In these particular countries, China Mobile, T-Mobile and "Other" US operators do not distribute the iPhone. We should subtract those operator customer bases out of the addressable market. But those conditions are variable: operators may sign up for future versions of the phone and 3G subscription rates are increasing. That means we can segment the market as follows:

    1. Currently addressable operators and 3G subscribers
    2. Potentially near term addressable users if all operators agree to distribute the iPhone in these countries
    3. Potentially longer term addressable users if all users switch to 3G and all operators distribute the iPhone.

    This segmentation leads to the following diagram.

    I also added the current users given comScore data for the US (29 million) and an estimate of 8 million Chinese users. Here are some observations:

    1. 10% of China's currently addressable market is penetrated while the US penetration is 18%.
    2. If all operators would agree to distribute the iPhone (i.e. including "Near Term" in the addressable total), the Chinese penetration would be 6% and the US 16%.
    3. If we include all users as addressable, China is about 0.8% and the US is at 8.5%.
    4. The penetration of the iPhone in the US and China combined therefore stands at about 3% today.

    The question that comes next is what is a reasonable limit to total penetration? What can we reasonably expect or what could Apple reasonably target?

    I've been using a global share of 20% as a reasonable target to test growth assumptions. Assuming no significant growth in user bases, 20% share in the long term (>5 years) yields a total of about 258 million users. That's equivalent to a 7x increase. Put another way, a 5x increase yields a market share of 14%.

    Note that these are "penetration" figures or share of available users. This is in contrast to share of units sold in a given quarter. Apple has maintained 20% share of smartphones fairly consistently. If share of units sold in any given time period remains at or above 20% and if smartphones and 3G networks become ubiquitous then reasonable men might consider these targets obtainable.

  4. The value of the OS X monopoly

    Research · 40 comments

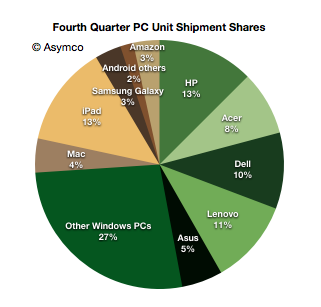
    In January I noted that there were more iPads sold by Apple than PCs from HP, the largest PC vendor in the fourth quarter. Including all tablets, this is the distribution of market shares by units shipped.

    Note the different color palettes for Windows and non-Windows.

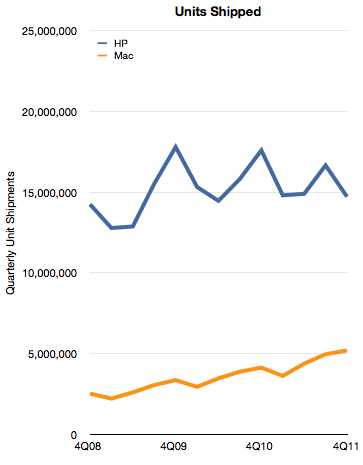
    By the metric of tablets+PC's Apple appears to be the leading vendor. However, if we consider only the Mac, Apple is still well behind. The historic unit volumes of the two is shown below:

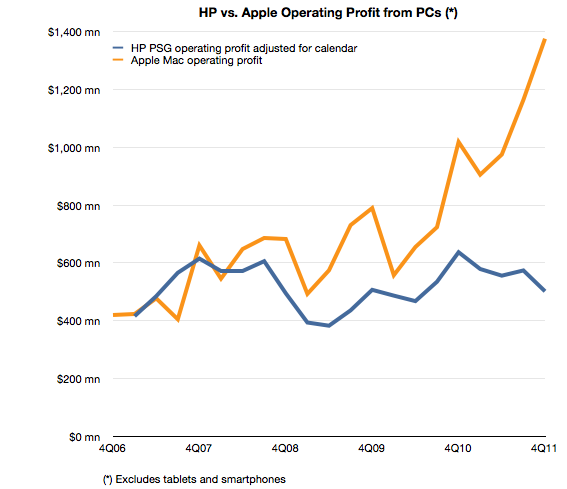
    Although Apple has nearly doubled its shipment volumes since 2008, it's still only one third that of HP. In addition to comparing volumes, we can also measure profitability. In this case HP's PSG (Personal Systems Group) reports operating profits and we can estimate the same from Apple based on a gross margin estimate and an operating expense estimate (as percent of sales).

    The comparison looks like this:

    The operating profit for Apple is 2.7 times higher from a third the units. This gap is a result of a vast difference in profitability. HP's operating margin for PCs is 5% while Apple's is 21%.

    A few days ago I highlighted that Apple's iPhone yields disproportionate profits because of the way it performs the jobs its hired to do by consumers and operators.

    With the Mac the story is that Apple's OS X is primarily responsible for delivering quadruple hardware margins vis-a-vis the most successful PC vendor.

    Both iPhones and Macs are sold as hardware products and the entire econometric analysis of Apple depends on hardware cost structures. This is because hardware lends itself to easy measurement. However, a casual observer would be stumped by a comparison with competitors which cannot come near the profitability Apple enjoys. How can the same bundle of components (admittedly mostly off-the-shelf) be sold at triple the margins?

    It comes down to software. Apple has a monopoly on iOS and OS X and charges for it through its hardware. That's a very valuable monopoly. It's worth at least $1 billion per quarter.

  5. iPhone sine qua non

    Research · 82 comments

    Last week I made an attempt to measure the iPhone's manufacturing cost given new data points from the Foxconn field trip. The post generated a great amount of new knowledge and the feedback was very valuable.

    The main value to me came from stepping back and looking at the entire cost and value structure for the iPhone. Putting costs into perspective is as valuable as knowing what they are.

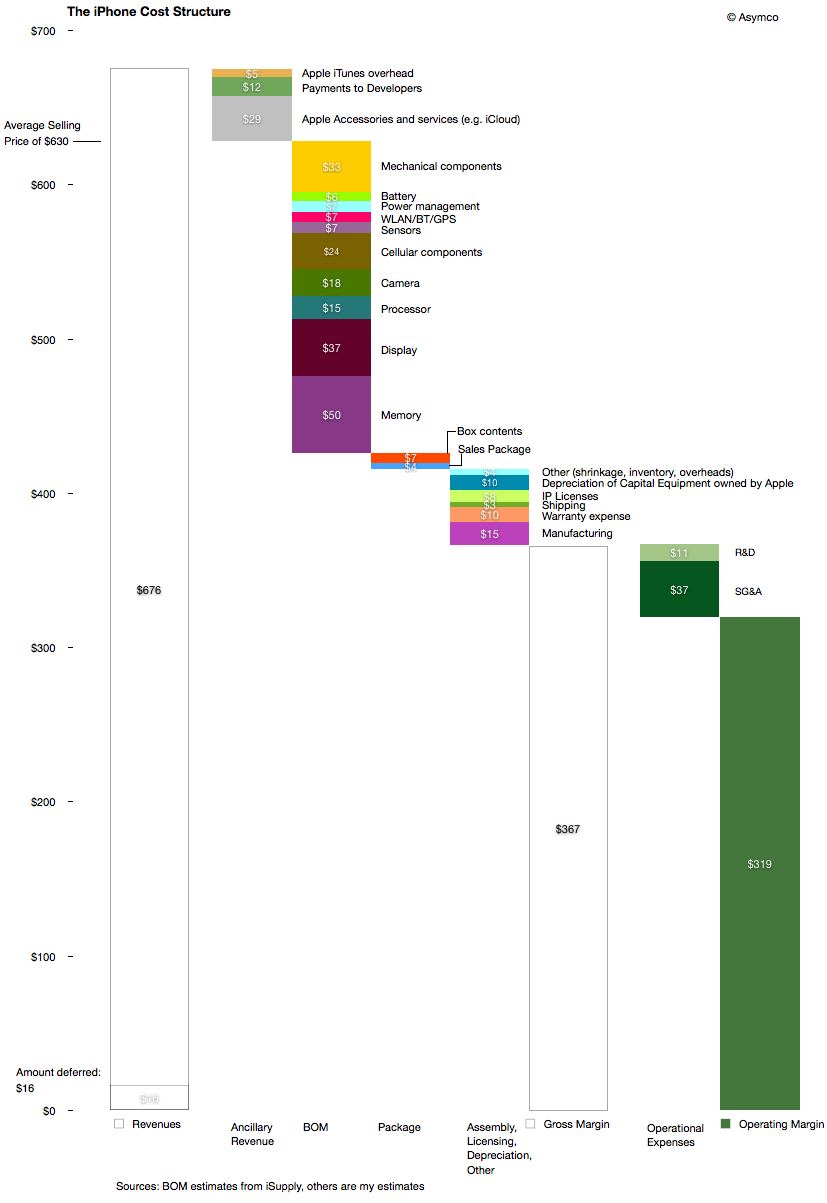
    The following diagram shows my estimates for this cost structure for the fourth quarter given both bill of materials estimates and the other parts of the cost of goods sold and operational expenses and even ancillary sources of revenue.

    Source for BOM estimate: iSupply.

    There are several observations easily made from this view:

    1. The manufacturing cost ($15 may be very generous i.e. high) but it still amounts to a tiny fraction of the device cost and hence value-add. The direct labor part of that cost is tinier still.
    2. Depreciation on capital equipment (Apple owned) amounts to $10 per device, probably higher than the direct labor cost.
    3. External developers as a group receive more app income than the salaries and costs associated with Apple's own developers working on the product.
    4. The gross margin percent is 58%.
    5. The operating margin is estimated at 51%

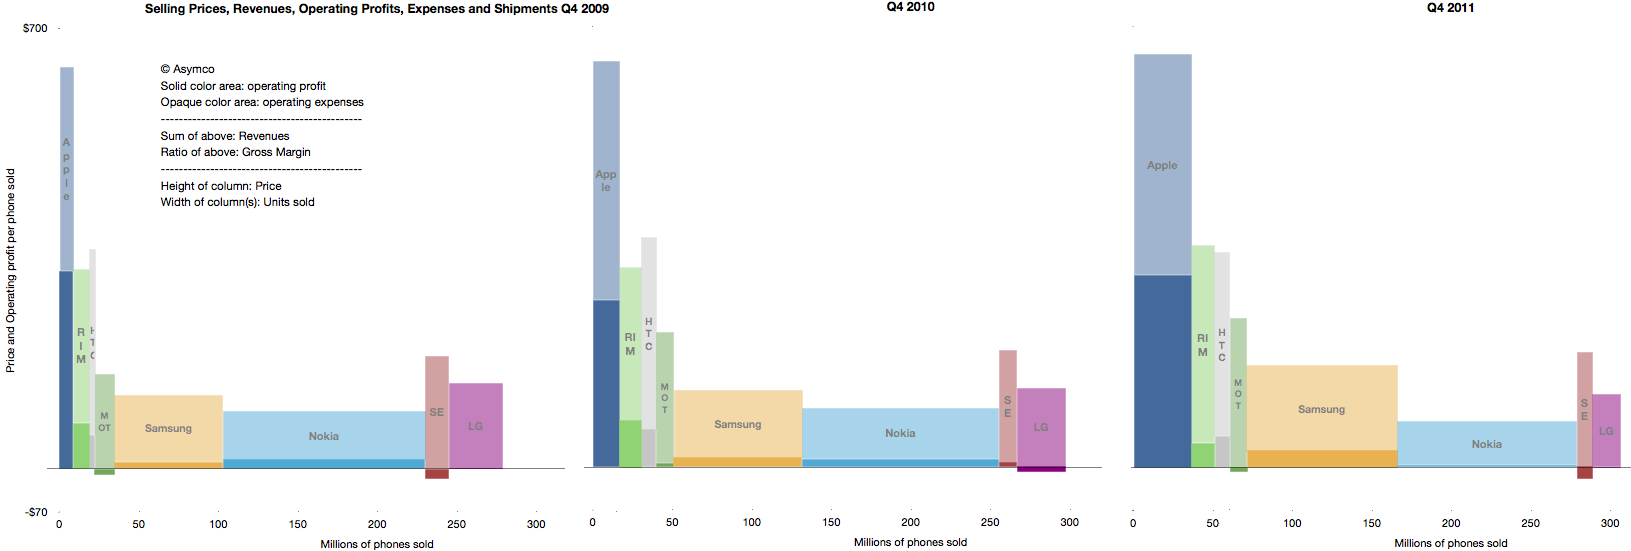
    The high margin that the product generates is even more surprising given the industry average as seen in this summary view of the industry's performance over three years' fourth quarters.

    The operating margin is the ratio of solid colors to the entire bar.

    As someone pointed out on twitter: one of these is not like the others.

    The question should be: How is this possible? What does this product have that gives it such a pricing advantage? Note the the ratio was preserved through the three years shown and has persisted for nearly five years.

    The answer to this paradox is in data that is not visible in any of the diagrams above: The largest revenue attached to the iPhone comes into the mobile network operators. We don't have global averages but the revenue the iPhone generates over its lifetime is probably two to three times the revenues that Apple directly receives. The ARPU iPhones are attached to allows for a substantial subsidy, but more importantly, loyalty (or churn)

    As seen in the small but clearly visible US market, being an operator having  iPhone exclusivity generates above-average growth and being the only operator to be excluded from the product generates above average subscriber losses.

    It quickly becomes obvious that ranging the iPhone has moved from being an advantage to not doing so becoming a serious disadvantage. The product and its high up-front costs are "hygiene factors" for operators. The sine qua non status means that it can still be priced with the extraordinary built-in margin shown above.

  6. How much does it cost to manufacture an iPhone?

    Research · 103 comments

    An iPhone generates approximately $650 in revenue for Apple. This figure has remained fairly steady over time. Using deduction from overall margins, it's possible to estimate the gross margin on the product to be around 55%.

    That means that the cost of goods sold (COGS) for the iPhone is about $293. Is that a lot? Where does that money go? What else does it tell us about how the company operates?

    To find out we need to understand the cost structure of phone building.

    Typically there are four main categories of costs for a phone:

    1. Bill of materials (BOM). This represents the cost of the components that go into the device. These are paid to suppliers.
    2. Transportation/warehousing. This is the cost to transport and store the product before sale. This is paid to shipping companies and warehousing.
    3. Manufacturing cost (including labor). This is paid to contract manufacturers.
    4. Warranty expense. This is paid back to customers for returned product that can no longer be sold.

    We can estimate a device's BOM through a teardown analysis and there are firms that do this. Usually this offers enough competitive insight into the cost structure and hence gross margin because the other items are predictable in that they do not vary greatly from product to product.

    In the case of the iPhone the BOM has been fairly steady around $200 for a new model. That leaves quite a big gap to the overall COGS of $293.

    Could transportation, manufacturing and warranty costs really add up to $90 for an iPhone?

    The manufacturing costs are not usually discussed in detail openly because the processes used are secret. However, thanks to and ABC Nightline report,  some clues have emerged about how iPhones are built and, although incomplete, they offer some interesting bounds.

    One data point recently published is that the iPhone takes 24 hours to be built. Of that 6 to 8 hours is spent in "burn-in" to install and test the software and components automatically. This leaves about 17 hours unaccounted for in the throughput time. Could this time be spent in labor intensive operations? In the ABC report the wage of workers on the line is given as $1.78/hr[4]. 17 hours of labor input would imply $30 labor cost per iPhone. That seems a lot higher than the industry (i.e. iSupply's estimate is $8 for manufacturing cost.)  This is an upper bound. Obviously, those 17 hours could be spent in automated operations which were not shown or simply sitting idle, waiting for a process to begin.

    Is there another way we can check this?

    There is. The ABC report also mentioned that there were 141 (presumably labor) work steps in the production for an iPhone. If we knew the time each step took we could obtain another estimate. For example, if each step in the human assembly process took 3 minutes[2] then human hands will touch the iPhone for 423 minutes or about 7 hours. This would imply a labor cost for an iPhone of about $12.5. If each step was longer or shorter, the cost would vary accordingly.

    Unfortunately we can't be sure of the exact cost. However, these recent clues offer some interesting bounds and observations[3]:

    • Manufacturing costs for the iPhone are likely to be much higher than comparable devices. This is partly because of the design of the product and partly because of the quality testing needed.
    • Those costs are likely to range between $12.5 and $30 per unit.
    • The iPhone manufacturing costs are likely to be twice or three times the average.
    • Labor costs are still a small part of the overall cost structure at between 2% and 5% of sales price.
    • The high level (141 steps) of human interaction in the process could be automated however, the fact that it isn't implies that the cost of automation would be higher and the flexibility of the automated process would be lower. It's much more likely that the process is a mixture of labor and robot intensive sub-processes.
    • Even if we assume a $30 manufacturing cost, there is still $60 that needs to be allocated to transportation and warranty expense. These require sanity checks as well.

    ---

    Notes:

    1. Note that R&D (engineering and development) and Sales, General and Administrative (e.g. Marketing) costs are not part of this cost structure. They are considered fixed costs and are not allocated to individual units of production.
    2. Note that during the ABC video there was mention of automated instructions being broadcast to the line. This implies that each worker is working on a "clock cycle" and each work stage is timed to take an equal amount of time. This clock cycle time is crucial in understanding the cost structure. One further clue to this cycle time comes from the iPad output rate per worker. This was mentioned in the slide show to be up to 6,000 units per day. Assuming 10 hours of working time per day means 600 units per hour or 10 per minute. This seems extremely high as the worker would have to handle the product for only six seconds. [UPDATE: Apple clarified this point: "In manufacturing parlance this is called deburring. Her line processes 3,000 units per shift, with two shifts per day for a total of 6,000. A single operator at Ms. Zhou’s station would deburr 3,000 iPads in a shift"]
    3. As this post shows the amount of information that can be obtained from observing operations can be significant and lead to competitor advantage. It should be clear why this is not something done willingly.
    4. UPDATE: In a statement Foxconn clarified wages as "We have over 75 percent of the employees in the category of earning at least 2,200 RMB ($349/month) basic compensation standard. That means they are earning 13.75 RMB ($2.18) per hour".
  7. The iPhone opportunity: a visual update

    Research · 67 comments

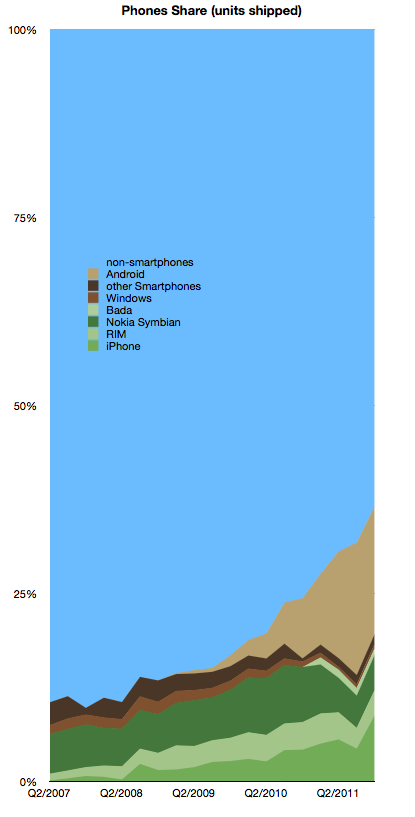
    In yesterday's talk Tim Cook described the opportunity he felt Apple faced. To readers of this blog this opportunity has been regularly illustrated, at least on a quarterly basis.  Here is the iPhone opportunity relative to other platforms:

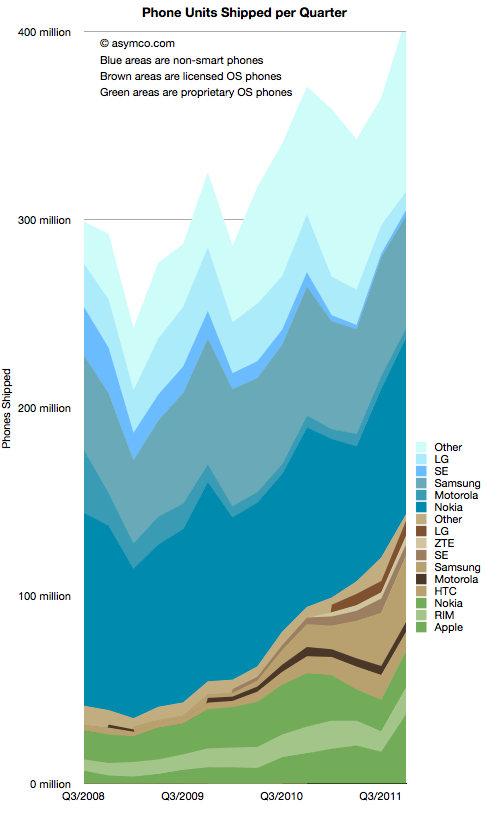
    In absolute units by vendor, separated by smart and non-smart phones, the data looks like this:

    The pattern of smartphone growth remains consistent even though there was a temporary dip in Q3 for the iPhone (and hence for the green-shaded proprietary OS phones.)

  8. Tim Cook on the "Law of Large Numbers"

    Research · 69 comments

    Q: 37 million units of iPhones shipped. When do we run into the Law of Large Numbers? What are the growth opportunities coming up?

    A: 37 million is a big number. It was a decent quarter. It was 37 million -- more than we'd ever done before. We were pretty happy with that, but let me give you the way I look at the numbers. As I see it, that 37 million for last quarter represented 24% of the smartphone market. There's 3 out of 4 people buying something else. 9 out of 10 phone buyers are buying something else.

    Handset market is projected to go from 1.5 to 2 billion units. Take it in the context of these numbers, the truth is that this is a jaw-dropping industry with enormous opportunity. Up against those numbers, the numbers don't seem so large anymore. What seems so large to me is the opportunity.

    What we're focusing on is the same thing we've always focused on. Making the world's best products.

    We think if we stay laser-focused on that, and continue to develop the ecosystem around the iPhone, that we have a pretty good opportunity to take advantage of this enormous market.

    Q: The biggest opportunity is the emerging markets. Large portion of that is the prepaid market. Apple has done very well but the wholesale iPhone price point is nowhere near what we would expect in the prepaid market. How do you make it more affordable to those markets?

    A: Those markets are critical. The smartphone market is projected to be 1 billion units in 2015, 3 years from now. 25% of that is projected to come from China and Brazil. Just two of those markets -- 25% -- obviously those are very critical markets, but there are others as well.

    We've been very focused on China. We've had incredible success with iPhone -- we've gone from a few hundred million in revenue to last year with $13 billion. We've been really focused on trying to understand the market there and taking those learnings to other markets. As it turns out, not very many people agree with me on this, probably.

    What I see is that there is a lot of commonality in what people around the world want. Everyone in every country wants the best product as it turns out. They're not looking for a cheap version of the best product -- they're looking for the best product.

    In the emerging markets there are very big differences in go-to-market. In most of the developed market, the carrier owns most of the distribution. In emerging markets, the retailer has most of the distribution. The whole go-to-market has to be changed significantly. Last year, we covered price points in the subsidized markets from $0 on up. That doesn't translate to zero in the prepaid market, but we're covering more price points there.

    The paramount thing is the product. It is the focus. Of course distribution, we've recognized the difference there and in purchasing power. Unlike many people, I don't subscribe to the premise that prepay is prepay is prepay. We convinced China Unicom to try to postpay. It wasn't big there but they tried it and it's working really well. It's great for everyone because customer gets cheaper phone and carrier locks in a customer. It's a different way to look at the issue and it's been successful in China.

    When Apple introduced the iPod in 2001, when we launched the iTunes Music Store and launched that on Windows, the iPod created a halo for the Mac. For 23 straight quarters we've outgrown the market on the Mac.

    The halo that was created by iPod for the Mac, was created in developed markets. It was created in the US, Western Europe, Japan, Australia, Canada. It didn't work nearly to the same level in Eastern Europe, Middle East, Africa, China, Latin America. People were already getting music from their phones. The world changed for us when the iPhone was launched.

    The iPhone introduced Apple to millions of people -- our brand -- to people who had never met Apple before. Now, it's interesting to look -- take China as an example -- last year the Macintosh grew more than 100% in China, year-over-year. Not on a big base, but 100% is pretty good. The market grew 10%, so we outgrew the market 10x.

    The iPhone is creating a halo for the Macintosh. iPhone has also created a halo for iPad. You can definitely see the synergistic effect of these products, not only in developed markets, but also in emerging markets where Apple wasn't resonant for most of its life.

    Via: Apple CEO Tim Cook Speaks at Goldman Sachs Technology Conference - Mac Rumors

  9. The US temporarily regains relevance for Apple's iPhone

    Research · 16 comments

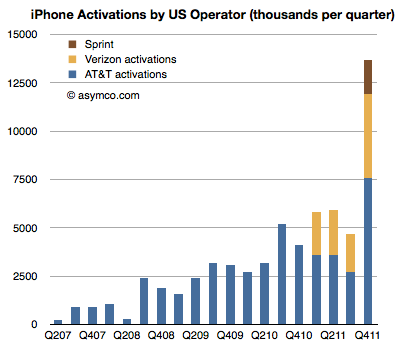
    Sprint reported its first iPhone quarter sales at 1.8 million. You may recall my analysis of Sprint's "gamble" where I estimated that Sprint will easily sell the 31 million iPhone which they committed to buy from Apple. I had estimated that they could sell an average of 7 million units a year but perhaps conservatively they could ramp at 4, 6, 9 and 12 over the four year period rumored to be in the contract.

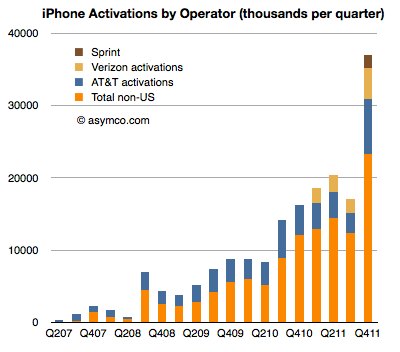
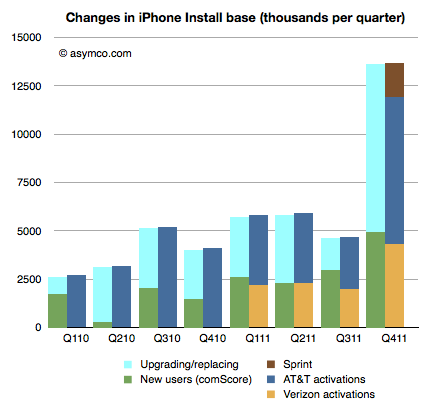
    Given the pent-up demand I also estimated that the first quarter could reach 2 million units. They managed 1.8 and that's a solid start. Overall the US carriers activated 13.7 million iPhones. Here are the iPhone activations by US Operator:

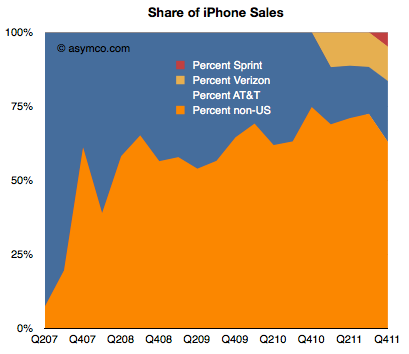
    That's 37% of the total market in Q4, shown in area and bar charts below:


    Note that the percent of total activations outside the US has dropped but that is due to the limited distribution of the iPhone 4S outside the US in the launch quarter. The long-term trend is for the US to decrease as a percent of total iPhones even with the additional US distribution.

    By comparing the net adds to US install base from comScore survey data, we can estimate that about 63% of US purchases of iPhones were replacements and that 8.7 million iPhones were put out of use in the US last quarter.

  10. What did I get right (and wrong) about the fourth quarter?

    Research · 40 comments

    I've been publishing my estimates for Apple's business performance for a few quarters (see here, here and here). My estimates have been collected along with those of dozens of others by Philip Elmer-DeWitt at the Fortune Apple 2.0 blog.

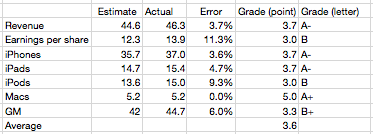
    I've also been scoring my performance and discussing the causes of errors. Here is the analysis for the fourth quarter 2011.

    My estimate for Mac growth was very precise. It was based on a 27% growth estimate. It turns out that growth was well within historic range and thus quite predictable.

    iPhone and iPad error was very modest at less than 5%. This led to a very low error on Revenues (as I also did not expect ASP to change).

    I was too pessimistic on the iPod, expecting 30% decline and 13.6 million units. In reality the business declined by only 21% and Apple still sold 15.3 million units at an average selling price of $164.

    Due to an underestimate on margins which are highly sensitive to iPhone margins my gross margin estimate was off by 6%. This led to a relatively poor EPS error of 11%.

    Nevertheless, the "grade point average" for the quarter was 3.6 which is nearly an A-. This is an improvement from the B- from the last quarter.

    Because the accuracy was good, there is little to be learned from the quarter. Perhaps the most important observation is that the iPhone recovered from two outlying quarters. The second quarter where it overshot expectations and the third quarter where it undershot. These were hard to predict because the product went through a delayed transition which whip-sawed both production and sell-in.

    What we saw in the fourth quarter is a  return to the predictable historic growth of nearly 100%.

    To give a perspective on the performance of other analysts, a motion chart showing their errors is here.

    See also the video PED published of the same data here. (This video was produced from the same motion chart shown above, selecting bars instead of bubble as the chart type).

    Notes:

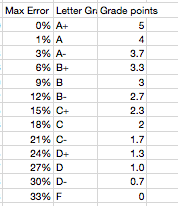
    1.  The scoring of the error is according to the following table:
    1. The results can be seen for all the other analysts as a table here (with data since mid 2008).