comScore published the latest data regarding US smartphone installed base. To summarize:
Penetration reached 37.4%, an increase of 2.9 million or 1.24 points of percentage.
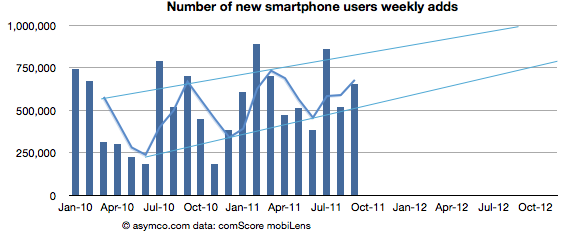
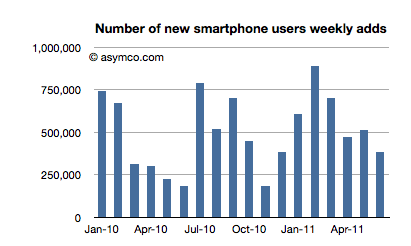
Approximately 650k consumers switched from non-smart to smartphones every week during September
Based on trailing average of six months' growth, 50% penetration will be reached by end of September 2012, though the trend is for accelerated adoption (see chart below).
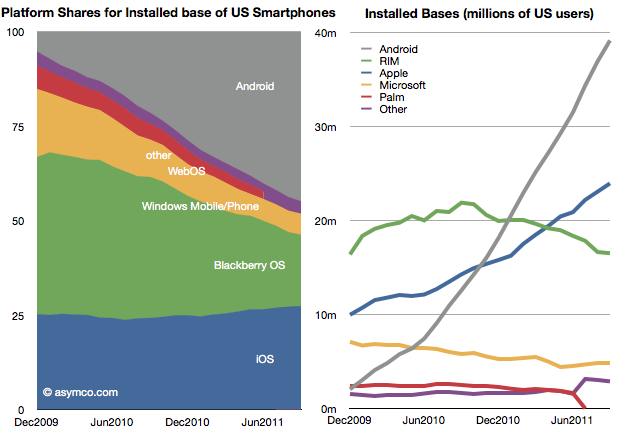
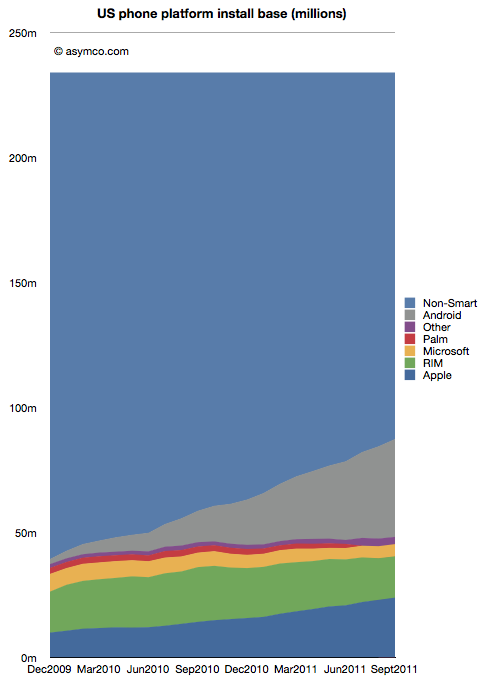
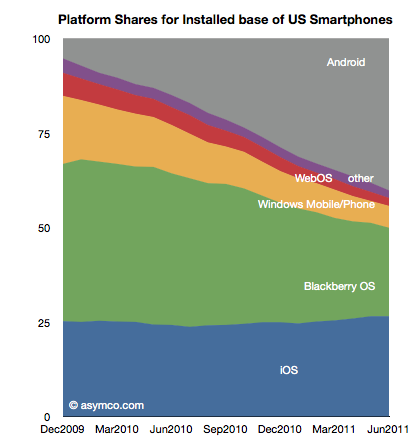
Of the platforms available, Android reached 39 million users, RIM 16.5 million, Apple 24 million and Microsoft about 5 million. Smartphone non-consumers dropped to 147 million. Among platforms, here are the shares and total users:
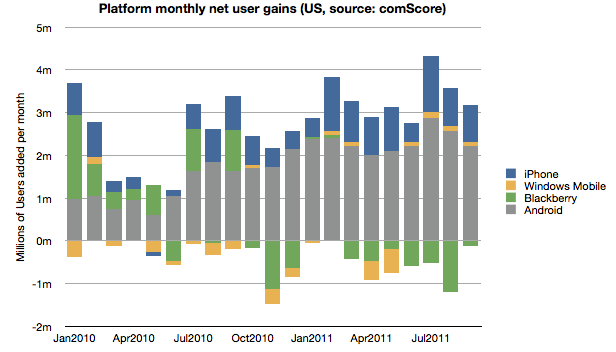
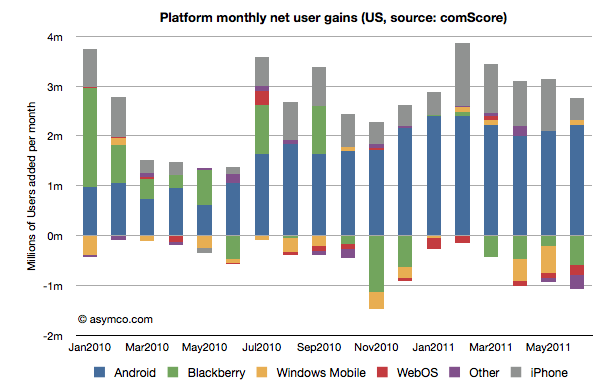
In terms of user gain/loss here is the tally:
Android and iOS have continued to increase consumption fairly consistently while RIM has moderated user losses. Microsoft has also shown the fourth consecutive month of usage increase having increased users by 440k since May. The new Windows Phones seem to have at least stopped erosion of user base though that base is still nearly a third of RIM's.
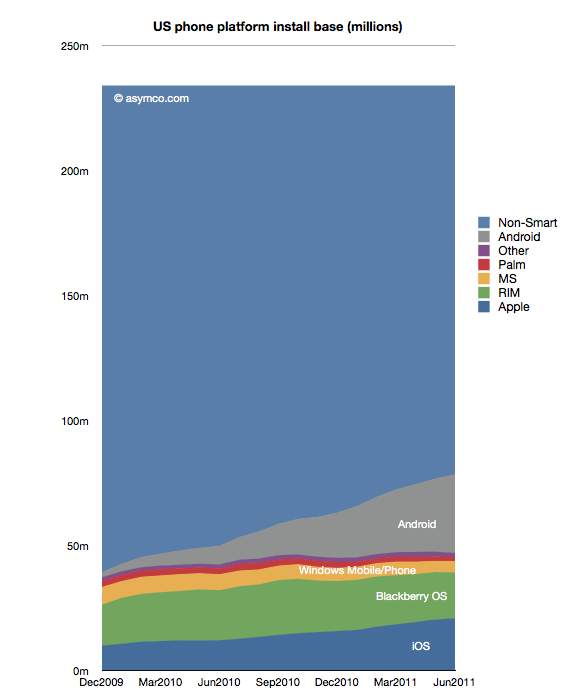
Overall, smartphone non-consumption continues to be the largest competitor though one which is steadily losing.
Even though China may overtake it in the new few months, the US is the largest smartphone market and it's a good leading indicator of the way the industry in evolving. It's also being measured by multiple observers[1] and we thus have a better chance at understanding the rate at which change is happening.
---
Note:
Nielsen reports that 43% of the phones in use in the US now are smartphones in the US with Ages 25 to 34 having 62% penetration.
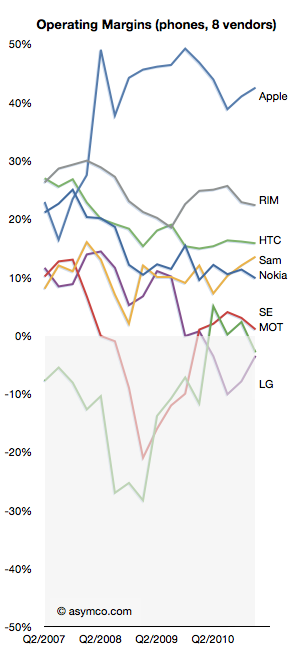
As shown in the yesterday's post, in the third quarter, overall mobile phone profitability declined. The eight vendors I use as a proxy showed a total net profit of $8.51 billion, down slightly from $8.57 billion and a drop of $9.01 billion in the first quarter.
Overall, the industry dropped by 1% sequentially but is still up 30% over last year and has a 20% compounded growth rate over a three year period.
Nokia returned to profitability, though at $180 million it's only about 2% of the top eight.
Motorola remained in the red with a small loss of $20 million, an improvement over the $90 million loss of the previous quarter. Motorola is being acquired by Google after an accumulated mobile operating loss of $4.69 billion since the beginning of 2007. It's unlikely we'll receive any updates on performance thereafter.
Samsung had a great quarter with a sequential increase of 19% and year-on-year growth of 130%. The total profit amounted to 25% of the peer group.
Sony Ericsson broke even with about $50 million in operating profit. Like Motorola its performance was barely break-even during the last four years and its also disappearing from our list of independent vendors as it becomes part of Sony.
LG had its sixth consecutive quarterly loss and is now appealing to investors for more capital to continue operating as a smartphone vendor. Raising dilutive capital seems a radical approach and not one that inspires confidence.
RIM had a sequential reduction in profit of 35% and y/y reduction of 30%. The company is exhibiting clear signs of decay and the stock market is valuing the company below book value.
Apple profit dropped by 19% but grew 43% y/y during a transitional quarter. The growth remains 43% compounded over three years.
HTC has a 1% sequential increase but a 78% y/y growth.
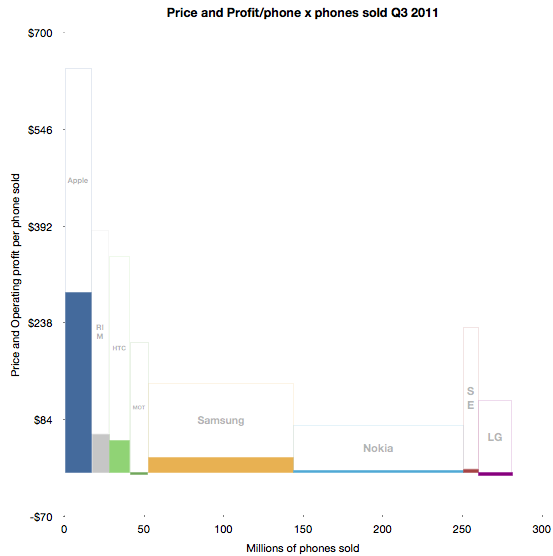
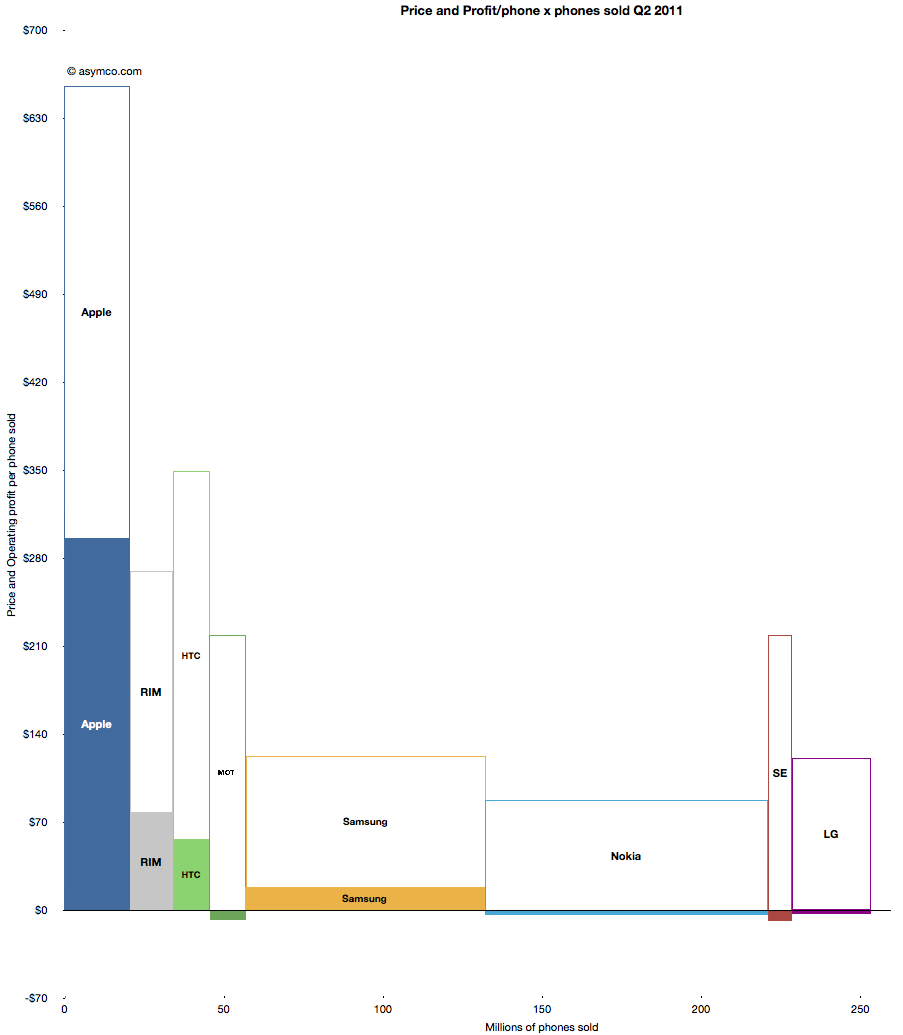
To illustrate the performance in terms of profit, pricing, volumes and margins, I developed the following chart.
The solid areas representing profit are operating profit/phone in the vertical axis and volumes shipped in the horizontal. The blank areas above are the cost of goods sold per phone and the combined solid and blank represent the average revenue per phone.
Some of the areas are over-represented due to the lack of resolution available.
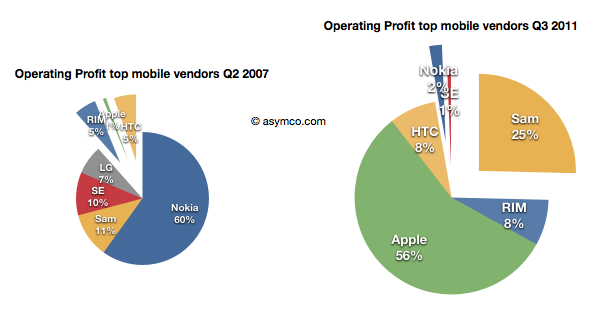
Using before-and-after pie charts for positive profits, we can see how the entrants (RIM, Apple and HTC) went from 6% of profits to over 73% four and a half years later.
I feel that this is somehow the end of an era. I've written before about the brutality of this market, listing 13 companies which were either merged or acquired or disappeared in the last decade. Now both Motorola and Sony Ericsson will soon be added to the list. On average, it's as if one phone vendor has disappeared every year for fifteen years.
And it's still not over. RIM is also becoming a going concern issue, and LG has a big question mark above it.
Of course, ZTE and Huawei and Lenovo are joining the list of competitors but I note that they are not focused on mobile phones. They are opportunistic phone vendors, depending on other businesses to compensate for the risks inherent in phone sales. It's interesting to note that neither Apple nor Samsung are pure phone plays.
In fact, of all the phone brands only RIM and HTC are exclusively phone-only companies. It may indicate something profound is happening. The notion that the development and marketing of phones as an activity independent of other business models may be coming to an end.
Yesterday comScore published survey results for EU5 (France, Germany, Italy, Spain, UK) on smartphone use and installed base. The headline is very similar to what would be written about the US: Android had phenomenal growth over the last twelve months. I also noted that the apparent growth of Google (16.2% share change) seemed to be matched by an apparent decline of Symbian (-16.1% share change.) However the reading of the data is not so simple.
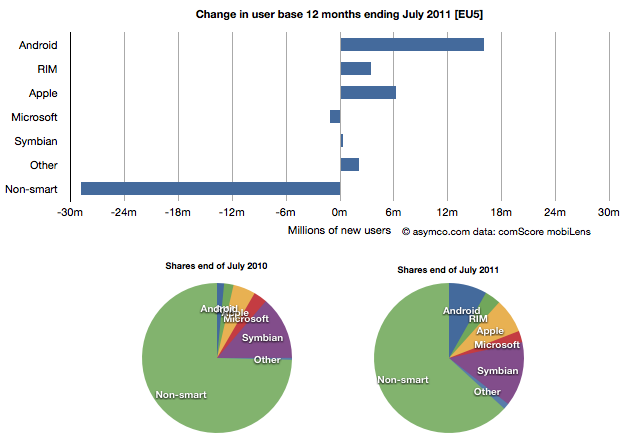
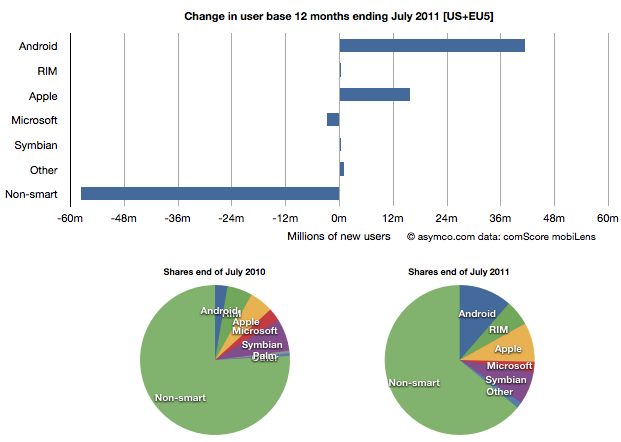
In order to understand what has happened to usage, it's much more valuable to look at consumption and the actual number of users rather than change in share of a subset of the market. Consider the following charts:
The bar chart shows that three platforms gained users in the last year (ending July) and that there were negligible losses in users by others. Negligible except for non-smart phones. A remarkable 29 million users moved from non-smart phones to smartphones. Those switchers switched into Android (16 million), iPhones (6.3 million) and RIM (3.4 million). Symbian even gained about 330k users. Microsoft lost about 1 million but its platform has not been actively promoted in that time.
When seen as a pie chart, you can see how the usage shifted from non-smart to smart even more clearly. It does not appear that Android took share from Symbian at all. Android took share from non-smartphones. The table in the link from comScore leads one to conclude otherwise.
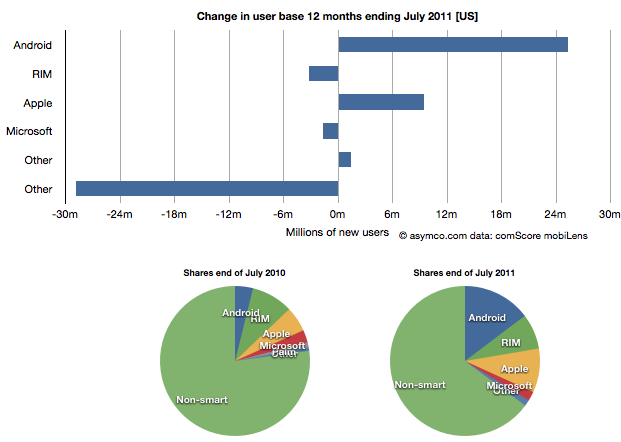
I took the same approach to look at the US data (also from comScore). It shows a similar pattern.
In the US, RIM was a net usage loser but its losses also paled to the losses of non-smart devices. In comparing with EU5 the pattern is very similar.
I then combined the EU5 and US data and provided a view into the combined markets (note scale change from previous two charts.)
This shows the change in platform phones more or less being from non-smart to Android and iPhones. The total population is 470 million people--not insignificant. The total number of non-smart devices abandoned is nearly 60 million in one year, which equals the total number of new smartphone users. That's 12% of most of the developed world switching in one year. If this keeps up, the "tipping point" when smartphones will outnumber non-smart phones in use in these large markets will be in another year.
In terms of sales rate, the tipping point has already happened. Sales of smartphones crossed over in the US and Europe several quarters ago (November 2010 in EU5) and the trend is accelerating. Furthermore, if patterns of mobile technology adoption repeat as they have for the last two decades, emerging markets will follow in two to three years.
This tipping point observation has been repeated on this site a number of times when reflecting on the data in the US. Now it's becoming clear that the same pattern has been underway in Europe as well.
The big picture from the survey data is just how vast the demand for smartphones is. Some platforms are benefiting more than others in terms of share of growth, but the biggest mobile loser is clearly the non-smart phone. Not only is it an unprofitable product for almost every vendor, it is also being increasingly shunned by buyers.
At the same time, at 450 million users we're still only looking at less than 10% of the market. As this pattern spreads globally the platform install bases will be measured in the billions of users.
The latest survey from ComScore breaks down the installed base of specific mobile platforms in the US. Tracing the data over time shows the following charts:
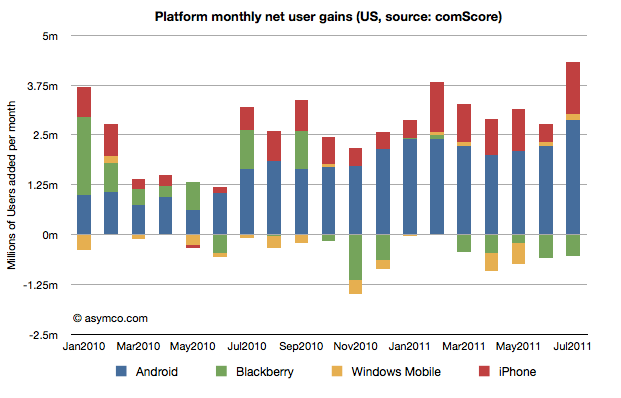
In the last month Android gained about 2.9 million users, iPhone 1.3 million, Blackberry lost 530k users and Windows held on with a gain of 132k. Other platforms had a net loss of 95k users.
In the last 12 months, Android gained 25 million users in the US. iPhone gained 9.5 million while Blackberry lost 3.2 million and Microsoft lost 1.6 million. Other platforms had a net loss of 1.2 million.
The total net gain of smartphones was about 29 million new users.
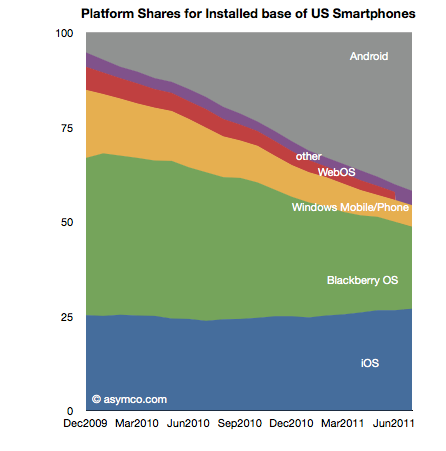
RIM switched from being a consistent net gainer of users to a consistent net loser of users in October 2010. Windows Phone is showing signs of holding the line on user base erosion but share remains below 5% (now at 4.7% vs. 4.6% last month). To put the mountain-sized hurdle in perspective, Android now has 7 times more users in the US while iPhone has about 5 times more. To become the largest mobile platform in the US, as some analysts are predicting, Microsoft has a 12:1 disadvantage that looks to continue to grow.
ComScore's latest survey data shows the following net user gains in the US smartphone installed base:
In summary, the key data points for June:
2.8 million new smartphone users in three month period ending June (vs three month period ending May)
Of the total 78.5 million users, about one million switched platforms
RIM had a net loss of about 600k users
WebOS lost about 195k users
"Other" (mostly Symbian) lost 273k users
Windows Mobile/Phone reversed two months of decline and added 100k users
iPhone added 452k users (considerably below its approximately 1 million/month run rate for last four months)
Android gained 2.2 million users, consistent with average over 7 months.
Platform "churn" was at 1.36%, about average over three months
Installed platform shares for the US market are shown in the following chart
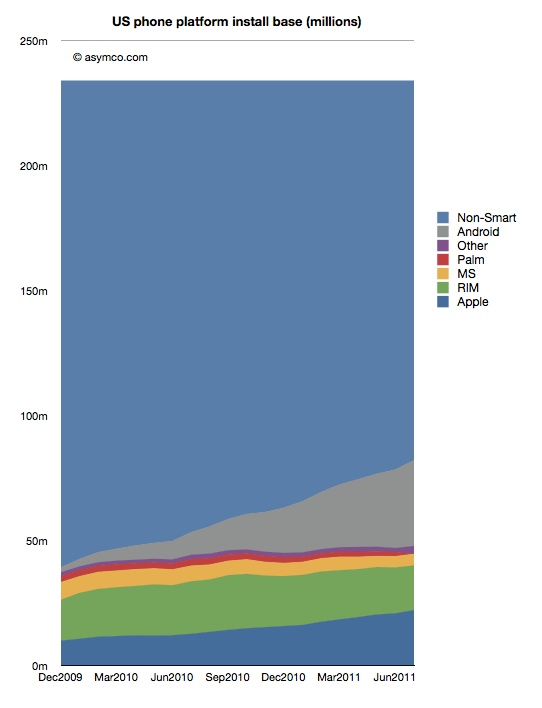
Platform Installed base vs. non-smart devices is shown below:
The penetration of smartphones slowed down in June (though that seems to be seasonal). The following chart shows weekly smartphone adds (or feature phone losses as total user base has held constant.)
Averaging the adoption rate over six months gives a "tipping point" forecast (50% penetration) of October 1st, 2012. That still means that 155 million American mobile phone users don't use smartphones.
The profitability (aka Profit/Phone x Phones Sold, aka Rawr) chart is a great way to see the "shape" of the industry at a glance, with attention to volume and profitability.
What is missing however is a perception of the sales level and the pricing of the products. To help in that regard, I prepared an extension to the profitability chart which covers the price and sales for each participant.
You can interpret this graph as an extension of the profitability chart where the "empty" or white areas above each profit area are payments to suppliers and operating expenses. Thus the sum of empty and filled areas (above zero) are equivalent to revenues. If the sum of the empty and filled areas are greater then revenues (i.e. they extend below zero) then the difference is operating losses.
The top of both empty and filled rectangles are set at the average selling price per phone (and the top of each filled rectangle is the operating profit per phone). The width of both rectangles is the volume of phones shipped.
The things you can read into this chart are:
Margins at a glance (ratio of filled area to total area)
Sales as well as profit relative to peers (top of each box relative to others)
Pricing power (overall top relative to competitors)
Any combination of the above
Finally, the sum of all the areas are the overall market revenues for the quarter. Sum of white areas are expenses and sum of solid areas are profits & losses.
A natural evolution of this chart would be to animate it across multiple quarters/years.
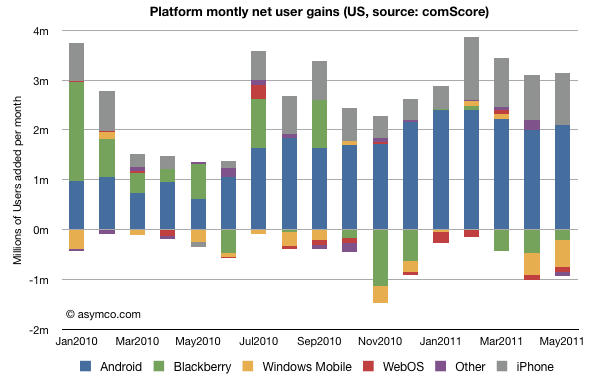
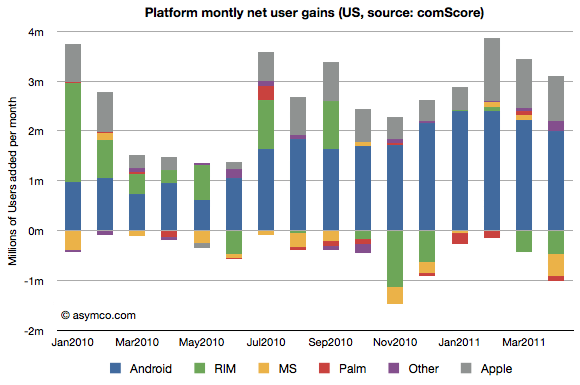
The following chart shows the net gains in users for the major mobile platforms in the US. The data is derived from comScore's MobiLens report.
The raw numbers for the last period (ending May) are:
Android gained 2.1 million users
iPhone gained 1.0 million users
WebOS/PalmOS lost 96k users
Blackberry lost 202k users
"Other" lost about 95k users
The "churn" or percent of smartphone users who switched platforms is 1.22%/month of the overall users (assuming users to left one platform moved to another rather than to non-smart devices.)
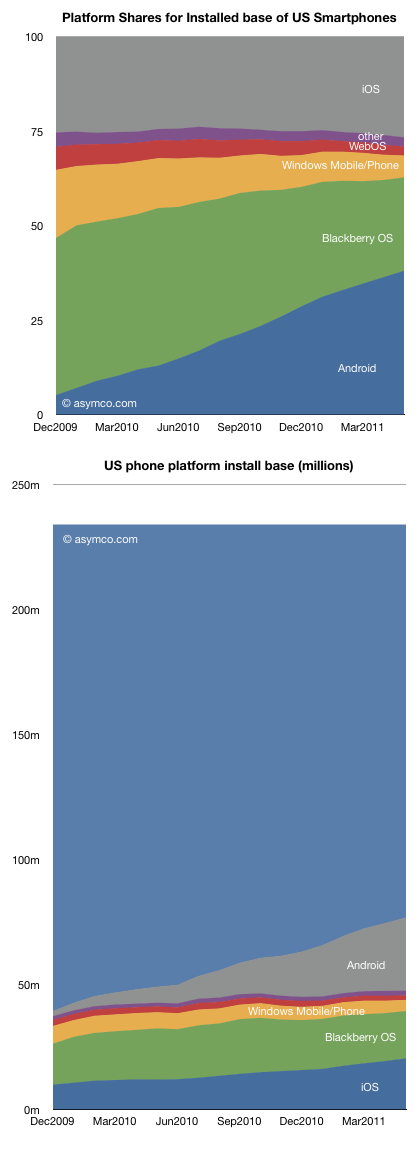
The share of the platforms and the overall composition of users is shown in the following two charts:
As usual, caution should be exercised when looking at share (top chart) outside the context of overall growth. The second chart may be more illustrative of what is happening. The light blue area on top is the smartphone non-consuming population.
Android has been a tremendous accelerant of smartphone adoption while iOS has grown as well but share has not grown significantly. iPhone growth has kept up with market growth. This cannot be said for the other platforms which have been "squeezed" between these two entrants.
So although the main competition is with non-consuming users and smartphones are winning in general, the loss of users by some of the incumbents is unsettling.
Microsoft lost just over 2 million users in the US last year while RIM lost a net of 1.5 million. Palm lost about half a million. Contrast this with 8.5 million iPhone additions and 23 million new Android users.
In particular, Windows Mobile/Phone is down to 5.8 million users (down from 18m in December 2009). With a loss of half a million per month, and share down to 4.5%, a lot is riding on the new platform.
I've argued that the post-PC era will be a multi-platform era. Although it may seem that the situation in the US is rapidly moving toward a duopoly, it may not end up that way. Note how much non-consumption still exists.
Note the time frame of the charts is only 18 months. The rapidity with which platforms gain ground could allow for continuing platform churn.
In their monthly survey update on US phone usage, comScore reported that by the end of April 74.6 million people in the U.S. owned smartphones. In the same period a year ago only 48.1 million did. The percent of smartphone users out of total phone users has reached 32%.
The following data points can also be deduced:
2.1 million or 474k people/week became smartphone users during April.
62% of smartphones in use in the US are either Android or iOS. The sum a year ago was 37%.
There are about 20 million iPhone users and 27 million Android users in the US today. A year ago there were 12 and 6 million respectively.
RIM's US user base peaked at 22 million in Sept 2010. It is now 19 million and dropping.
Usage of Microsoft mobile operating systems in the US is in steady decline dropping from 7 to 5 million users in one year.
During April 475,000 people abandoned their Blackberries.
Android and iOS gained 3 million users in April. One million switched from other smartphones and 2 million switched from non-smartphones.
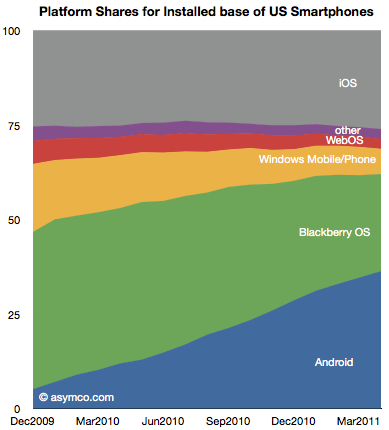
The following chart shows the evolution of installed base share of platforms among users of smartphones in the US.
The impressive share gains for Android are apparently at the expense of RIM and Microsoft. Over the period shown, Android gained 25 million users while RIM gained only about 2.8 million.
Although perhaps comforting to see some growth overall, the situation for RIM is more grim than that. During the first half of the period (December 2009 to August 2010) RIM had gained 4.6 million users. During the second half (Sept 2010 to April 2011) RIM lost 1.8 million users.
The net user gains and losses for the various platforms is shown in the following chart:
Note how RIM (green bars) went from being a consistent net usage gainer to a consistent net usage loser during this 16 month period. In addition, note how Microsoft's platforms (yellow bars) have had a very poor showing with very small gains during four months and moderate losses during the others. The losses in usage even increased after the release of Windows Phone late last year suggesting no traction whatsoever for Windows Phone.
The other point to be made is that if we assume smartphone users remain smartphone users, then those platform losses are gains by other platforms. In other words, the areas less than zero in the chart above represent smartphone "churn" or switching between platforms (As a percent of all smartphone users that number represents 1.35%.) That number is far lower than the total smartphone gains, so it's safe to say that most of the iOS and Android gains were at the expense of feature phones rather than other smartphones. And since iOS share is consistent (and supplies are constrained), few if any Android gains are at the expense of iOS.
There are many interesting patterns to observe in the data, but I think the most evocative is the erosion of Blackberry usage. If the Blackberry peaked, and a follower platform not yet in sight, the question is how long will RIM survive?
One of the details of Nokia's warning which did not get a lot of attention was the mention that profitability for the current quarter could not be guaranteed. That is to say that Nokia may make a loss, perhaps for the first time in more than a decade.
This may not be that newsworthy except for the strange fact that as far as I've been able to observe, any company in the mobile phone market that ended up losing money has never recovered its standing in terms of share or profit (i.e. AMP index value has never recovered).
Here is a list companies that have "hit the rocks" in terms of mobile phone profitability and their fates (in no particular order).
Alcatel of France. Sold its brand and operations to TCL Communications of China in 2004.
Siemens of Germany. Exited in 2005 through acquisition by BenQ of Taiwan.
BenQ of Taiwan. Mobile devices division declared bankruptcy in 2006.
Ericsson of Sweden. Exited by merging with Sony in 2001 even though third in volume share the prior year.
Sony of Japan. Joined with Ericsson to form Sony Ericsson in 2001. Held less than 1% share prior to merger.
Motorola of the United States. Even though once the largest vendors, after a period of severe distress, Motorola spun off Motorola Mobility. Market value shows long-term viability still a concern.
Casio of Japan. Merged with NEC and Hitachi in 2010.
NEC of Japan. Merged phone units with Casio and Hitachi in 2010.
Hitachi of Japan. Merged phone units with NEC and Casio in 2010.
Fujitsu of Japan. Merged with Toshiba in 2010. Held 15 percent of Japanese market prior to merger.
Toshiba of Japan. Merged with Fujitsu in 2010. Held 4% share in Japan.
Palm of the United States. Sold to HP in 2010.
Handspring of the United States. Sold to Palm in 2003.
That makes 13 large phone brands that, in less than a decade, have either exited or lost independence after suffering crises of profitability.
As the following chart shows, at this time Motorola, Sony Ericsson and LG are still operating but have been dipping into the red.
The three suffered severe volume contractions in feature phones and have no differentiation in software or platform products which makes their position precarious.
This cursory survey shows that it's difficult to be optimistic once a company reaches a point of crisis. It's a curious outcome given that the market is so vast and growth is so robust.
But the fact is that because of the technology cycle time, rapid business model evolution and fairly low barriers to entry, there is great rivalry between competitors. Profitability is the canary in the coal mine. It causes a brand to be tarnished in the eyes of distributors who, because of sales cycle times, are extremely sensitive to obsolete inventory. A loss maker is seen as a maker of damaged goods.
It then turns off the tap of incentives, promotions and hence visibility in the eyes of consumers. It's a vicious cycle from which few (if any) can recover. Past greatness offers no succor.
And so, with Nokia about to join the list of loss-makers it's only natural to question its fate as an independent company.
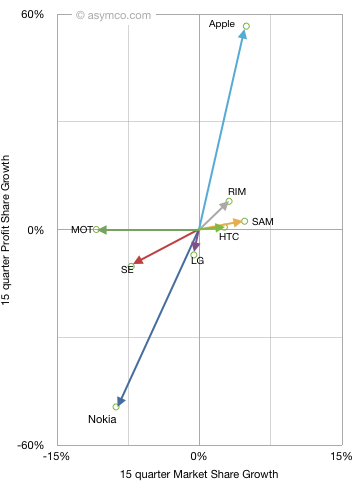
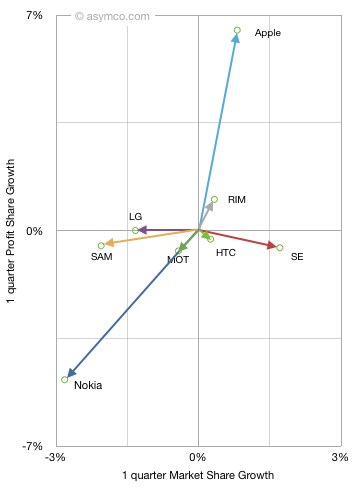
Last fall I introduced the "vector space" model of visualizing vendor performance. It shows performance along two dimensions: market share growth vs. profit share growth for a set of competitors.
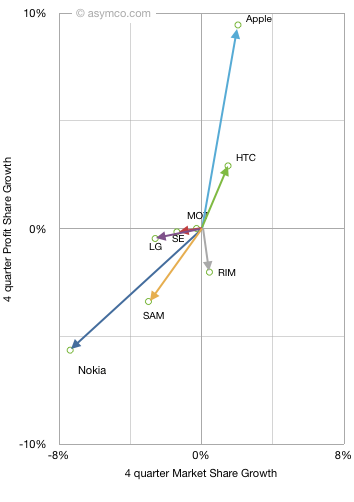
When introduced, I chose a long time frame (15 quarters) to see the long-term pattern. This quarter I add two more time frames: year-on-year and sequential. This allows a view of how market change is itself changing. The three diagrams are shown below (note difference in scales)
One way to interpret this is movement toward the upper right is positive while movement down or to the left is negative. A deeper meaning can be obtained from noting that the vector sum or "net" of vertical and horizontal data points should be zero (i.e. the gains in share should be at the expense of losses in share). In terms of phone market share the "net" is not zero as "others" are excluded, but the difference is visually not perceivable.
Since we're dealing with share, one way to interpret the data is that "improvement" in one's position is offset by the "decline" in another's. We cannot ascribe the benefit of a vendor directly to the loss of another but overall net gainers are offset by net losers.
By tracking this position change over time we can see if there is a set of consistent winners and a set of consistent losers. The pattern does show that:
Smartphone vendors grow consistently
Apple in particular has consistent growth with profit growth faster than share growth
Nokia in particular has consistent decline with profit decline faster than share decline
RIM shows profitability concern in the near term. In particular vs. HTC
Samsung shows some near term share loss, probably due to unbranded vendors
It's very rare to have a company lose market share while gaining profit share or to gain market share and lose profit share. This implies that in this market one does not trade off volume for profit.
The correlation between profit and volume growth is very telling. As is the consistent clustering of winners and losers. This analysis demonstrates the shift in the industry is not a short term phenomenon but a disruptive changing of the guard. If history is any guide, this change is not going to be undone.
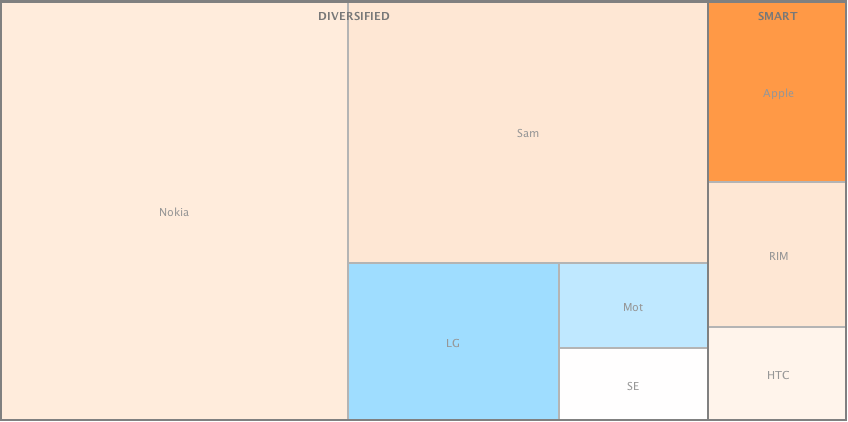
I produced two alternate views of the primary mobile phone brands in terms of volumes sold and operating profit in Q1.
These views[1] allow a comparison by categorized competitors. I grouped dedicated smartphone vendors (SMART) vs. diversified and used color coding for profitability (blue colors indicate loss-making vendors).
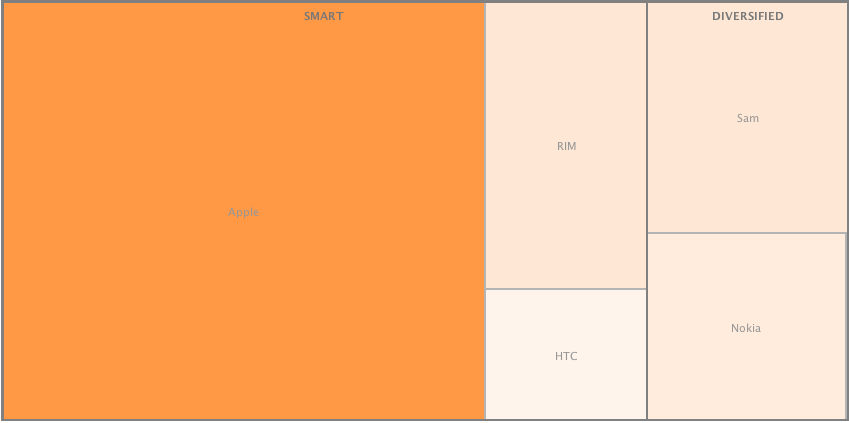
The same view is drawn for profitability. Loss-making competitors are excluded.
This view shows how 16% of the volumes for the smartphone vendors generated 75% of total profits. As smartphone penetration grows, those vendors who maintain a diversified portfolio will continue to see their average price and profitability slide.
I've suggested before that I don't see non-smart devices being interesting to vendors in the near term. Each additional dumb phone added to a portfolio will decrease a company's operating margin. The market dynamics are such that I think non-smart phones will disappear entirely from branded portfolios in 3 to 5 years.
---
Notes:
These are called "tree views". I used Many Eyes experiment from IBM Research to create these charts.