Apple's growth vs. top 10 largest market caps
Research #Theory · 33 comments
Apple's stock price has been rising. Although it's still priced at a P/E of 22 while facing near term EPS growth well above 50%, this is belated recognition of the potential of the iPad and the iPhone.
However, as it has grown, Apple's valuation is now not only higher than any other technology company but it's nearly the most valuable company on the planet. There is a theory that ultra-large market caps are reserved for companies that are past their prime. Sometimes this is attributed to the law of large numbers: that conclusion that big numbers cannot grow much bigger because compounding growth is exponential whereas markets are limited and become quickly saturated.
The trouble with this theory is that "large" is relative; large is often simply "the largest". Large market caps are not what they used to be. During past booms, large caps touched a trillion dollars. Today, the largest market cap is merely $314 billion.
So I don't put much faith in large number "laws". The real question of under/over-valuation rests on whether the company is growing or not. Valuation is simply the net present value of future free cash flows (plus assets). So the most important determinant of current value is growth in cash flows.
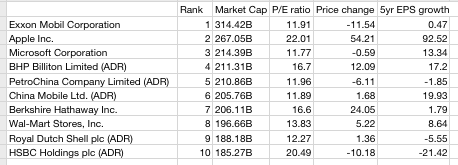
It's fairly easy to assess this: compare P/E which is a proxy for valuation with EPS growth. The following chart does this for the top ten largest market caps traded on US exchanges (as listed by finance.google.com).
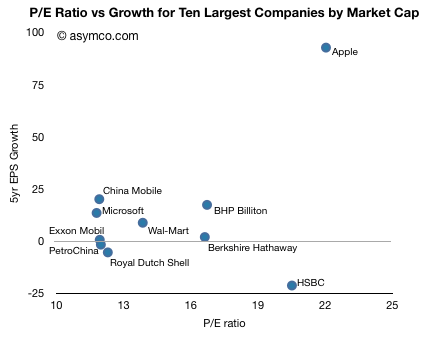
One should see some correlation between the two variables, but given the 5 year time frame, many of these companies showed large volatility. There are outliers like HSBC which has a rapidly rising value even though it was badly affected by the credit crunch.
The other outlier is Apple. The company showed 93 percent EPS growth over a five year period and has a P/E of 22. The company with the next highest total value (Exxon Mobil) had 0.5% growth with a P/E of 12. The company with the next lowest total value (Microsoft) had 13.3 percent growth with a P/E of 12.
For an ultra-large cap, Apple's growth is unprecedented and extraordinary. It's in fact off the scale. The average growth of the other 9 top caps is 3.6 percent!
Apple's growth is a factor of 25x higher. The P/E is only 1.6x higher.
The result has been a much higher appreciation in the stock price as shown in the following chart.
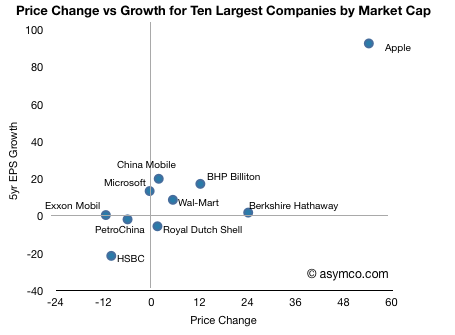
So it's clear that Apple, in this peer group, is far from ordinary.
Data follows: