Asymco

Asymmetric Intelligence

Financials

  1. Morgan Stanley reiterates $330 price target with bull-case $440

    Nota Bene · 3 comments

    AI or bust

    Morgan Stanley analyst Erik Woodring believes Apple’s upcoming Worldwide Developers Conference could begin to change that perception. The 5-star analyst reiterated his Overweight rating and $330 price target, arguing that a successful AI strategy could unlock a higher valuation for Apple stock, with a bull-case scenario reaching as high as $440 per share.

    He noted that Apple’s recent strength has been driven by its products and services business rather than AI. However, companies viewed as “AI winners” have often earned higher valuations over the past two years, and Woodring believes Apple could soon be seen as one of them.

    Why WWDC Could Be a Turning Point for Apple

    Woodring believes Apple now has more of the tools needed to compete in AI. He pointed to Google’s Gemini models supporting Apple Foundation Models, Apple’s strong focus on privacy, and what appears to be a renewed push around Siri and Apple Intelligence.
    Unlike many of its rivals, Apple is not spending heavily on building AI infrastructure. Instead, the company can use its massive base of iPhone, iPad, and Mac users to bring new AI features to consumers. That approach could help Apple grow its AI offerings without the huge costs faced by some competitors.

    The analyst also sees an opportunity for Apple to help ease some of the industry’s AI capacity constraints. A more capable Siri and improved Apple Intelligence platform could bring AI tools to millions of users through Apple’s existing ecosystem.

    For investors, the bigger story may be valuation. Woodring believes that if WWDC shows a clear path for Apple’s AI plans, the stock could earn a higher multiple. In that scenario, he sees shares reaching $365 to $385, with a bull-case valuation of as much as $440.

    Source: TipRanks Financial

    NB: Not much new here but a $330 target is not much above the $315 high recently reached. Perhaps this is his foreshadowing of upgrades post WWDC…

    …The premise is that Apple could get a higher multiple on AI re-rating. I am always skeptical of re-ratings as Apple does not respond to market fads (unless they are negative.) Apple has always been valued very conservatively, sometimes derisively so. A multiple above 40 is almost never experienced. If it were to run on AI euphoria well above that I'd be very surprised.

    Disappointment after WWDC is almost guaranteed as it's always hyped by pundits expecting new strategy, new products and new directions whereas it's always been strictly a software and tools show.
     

  2. When Will Apple Halve?

    Research · 1 comment

    So far it's down 44.4%

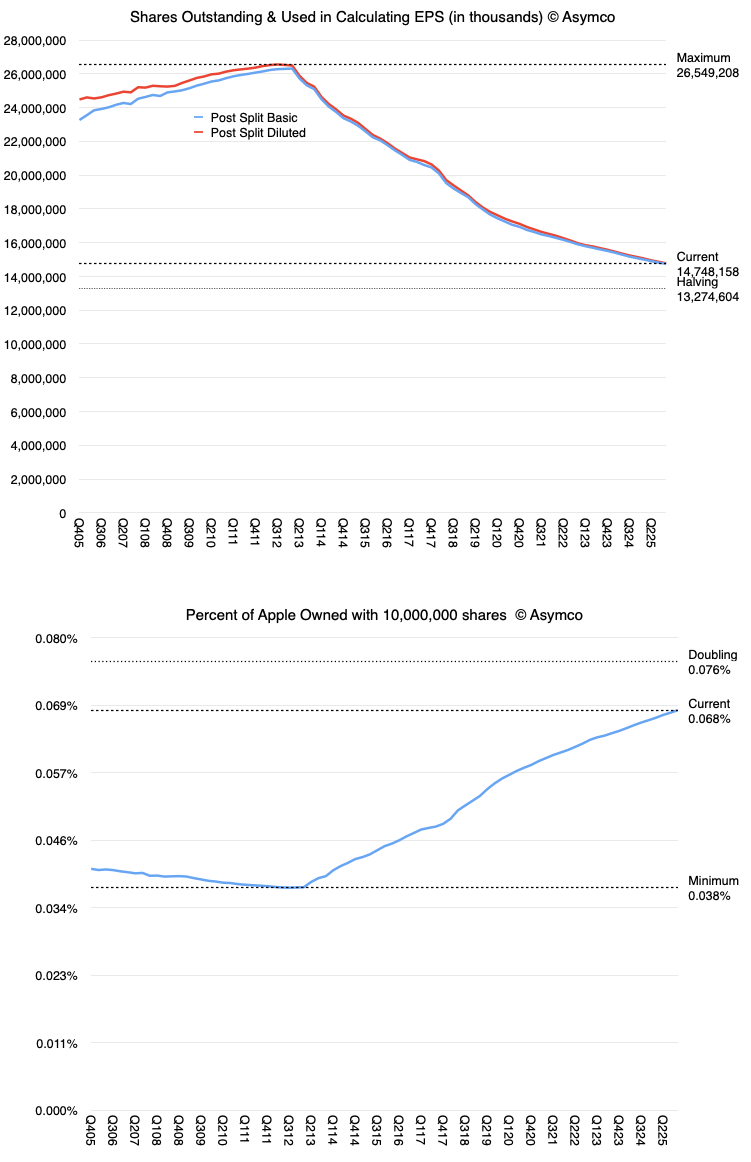
    The Apple share count peaked at 26,549,208,000 shares in the third quarter of 2012. Today there are about 14,748,158,000 shares outstanding. The history of the shares outstanding is shown below:

    Line graph showing shares outstanding and used in calculating EPS over time, with post-split basic and diluted data.

    Also shown in the second graph is the percent of the company owned by 10 million shares.

    I highlighted a point representing the "halving" point, which is what I call the number of shares necessary for a reduction by 50% from peak share count. The halving point is 13,274,604,000 shares. Today's share count represents a reduction of 44.4%, meaning that there is 5.6% to go. The challenge in predicting when this point will be reached is that the rate of retirement is variable.

    For instance during the last year 340,509,000 shares were retired. During 2024 the number was 425,776,000 and in 2023, 379,077,000. This variability is because whereas the company receives a "budget" in terms of capital to be returned via share repurchases every year, the choice of when to buy is up to management and the price at the time of purchase obviously varies greatly.

    Nota bene: By definition, share buybacks are insider trades as the buyer is an insider. But it is not illegal insider trading. The SEC has specific rules about procedures for share buy-backs that establish a safe-harbor for the company. While legal, they are restricted to pre-planned programs, we just don't know what these programs are.

    The rate of retirements therefore is dependent on the nature of the program, which is not public, and the price of the shares, which varies widely. Naturally, if the share price increases, the reduction in shares slows down. This is rather by design. If it did not happen then as the share count drops and price remains the same, then the shareholders don't benefit much from the value of the shares, though they may well benefit by other means.

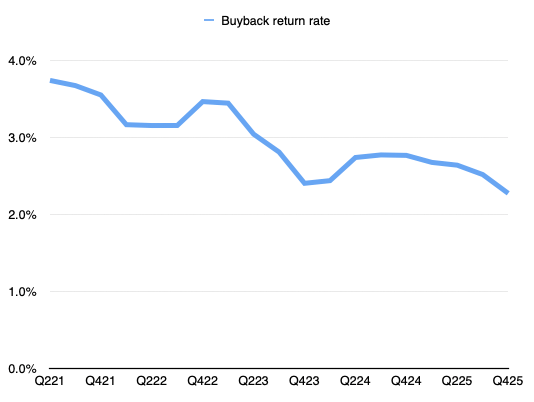
    For instance, from the investor's point of the concentration of shares has a "rate of return" which can be represented as a percent (trailing twelve months retirements as a percent of the total a year earlier). In other words, how quickly is one's position in the company concentrating. The following graph shows that rate.

    Line graph showing the buyback return rate over several quarters from Q221 to Q425, with values ranging from 0% to 4%.

    By this metric, with 5.6% remaining, the point of halving should arrive around the middle of 2029. Of course, if share prices rise rapidly, and Apple does not increase its capital return budget this halving point will need to be delayed.

  3. Wall St. discounts Apple's growth potential

    Research · 2 comments

    Apple, with its $50 a share in cash, could earn as much as $17 to $20 a share in 2011, which means the stock is trading at a cheap 12.5 times next year’s earnings. Cramer said even if Apple hits his $300 target, the stock will still be cheap trading at just 15 times earnings.

    “That’s less than almost every single growth stock I follow,” Cramer said, “and even less than the S&P 500’s multiple.”

    via Jim Cramer Predicts Apple Inc. (NASDAQ:AAPL) will hit $300 a Share | Madd Money.

    S&P forecasts the S&P 500 average P/E for 6/30/2010 at 22.57.

    Readers of this blog may recall that I noticed Apple's discounted valuation several times.

  4. Known by All, Understood by Few

    Research

    Erick Maronak, manager of the Victory Large Cap Growth Fund, says Apple is the best-run company in the U.S.

    I would add it's also almost the biggest and at the same time least understood. A lack of understanding is reflected in a high risk rating, which is itself shown in the company's Beta.

    All told, that makes Apple the fourth largest market cap in the US with the volatility and apparent risk of a startup.

    Asymmetries of information don't get better than this.

    Apple, Little Understood, Is Best-Run Company | Mutual Fund Center | Financial Articles & Investing News | TheStreet.com

  5. The Apple of Traders Eyes

    Research

    Of all the world’s companies, Apple ranks as the 11th most valuable. As a technology company its market capitalization is second only to Microsoft.

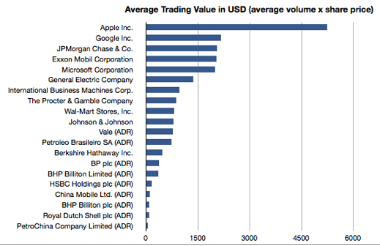
    Of the top 20 largest companies, all of which are above $150 billion in market cap (listed in graph above), Apple has the highest volume of trading as measured by dollar value (average volume multiplied by last share price is $5.2 billion per day--see graph). In fact, it’s more than twice as popular as a traded equity than the next highest, Google and 2.6 times as popular among traders as Microsoft.

    This trading volume might also be reflected in its beta (the correlation of price with the market with 1 meaning perfect correlation). Apple’s Beta is 1.59, nearly the highest of the super-large caps and the highest by far of the tech large caps.

    Surely, this confirms that Apple is not only huge but hugely popular and highly visible among investors. Suggestions that its current discounted value is due to obscurity among IT buyers translating to obscurity among investors does not wash.

    Source: Google Finance

  6. Apple’s Enterprise Value Peaked in 2007

    Research

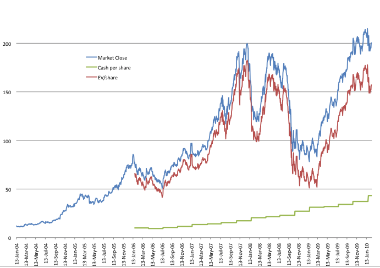
    On Christmas Eve 2007 to be precise. That’s when the Enterprise Value/share was $181.5. These days it’s around $150. The Enterprise Value (EV) measures the value of future cash flows excluding current assets and is a better indicator of the potential of a company than its current overall value.

    As you can see in the graph above, the cash per share (in green) has grown to $43 while back in late 2007 it was less than half that. As a result, although the market value for Apple peaked at $215 on 19th January this year (the blue line), the EV/share was only about $178 (the red line), below the all-time-high in 2007.

    As Apple’s cash continues to grow, the gap between EV and MV will also grow. If the MV remains low (as the P/E is indicating) then the Enterprise Value, i.e. the net present value value of future cash flows, drops.

    Did Apple’s prospects peak in 2007--six months after the iPhone was first launched--or is the current valuation still a function of sentiment of the overall economy, independent of the company’s fundamentals?

  7. Apple Ten Times more Profitable than Dell

    Research

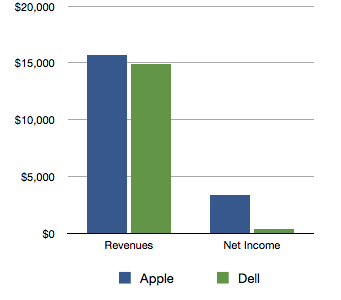
    Apple’s profit of $3.38 billion for CQ4 was slightly more than 10 times bigger than Dell’s $334 million on nearly equal Revenues of 15.7 billion and 14.9 billion.

    In other words, Apple kept about 20% of its income while Dell kept 2%. Also worth noting is that Dell’s gross margin onconsumer PCs was 0.2% while Apple’s Mac margin (mostly sold to consumers) was around 28%. So on consumer PCs Apple’s margin was 140 times higher.

    It should not be a surprise then that Apple is worth 6.5 times Dell.

    To recover some of its margins Dell is rumored to be readying its iPad competitor.

    I can’t wait.

  8. Apple as Macroeconomic Counter-Indicator

    Research

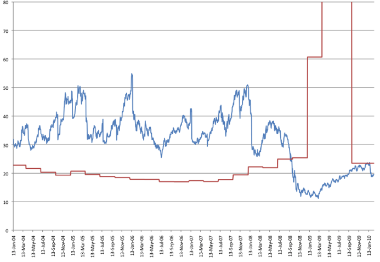
    Following up on the Apple Valuation Entry, I went to the data and pulled the historical P/E for Apple back to include all of 2004 (in blue) and did the same with the S&P P/E (in red).

    A few notes:

    • Apple’s P/E was consistently above 30 until mid-2008
    • Apple’s P/E was consistently and substantially above the S&P until mid-2008 by at about 10 to 30 points.
    • A reversal occurred at that point with S&P P/Es reaching record highs (actually at over 120 in May) and Apple’s reaching record lows of 11 at a time when the S&P P/E was over 60.
    • Since the reversal, Apple’s P/E has been consistently below the S&P’s and indeed has stayed near historic lows while the S&P is returning to historic averages.

    This reversal happened during a time of recession when, in contrast to most companies, Apple kept growing. The spike in the S&P P/E is due to a dearth of earnings, while Apple had increased earnings, sometimes to new records.

    As a “premium” brand it’s perhaps perplexing that Apple seems to be acting as a counter-indicator to macroeconomic conditions.

    Expectations for Apple to decline in times of economic contraction did not come true and as recovery seems near, Apple appears to be discounted.

    In other words, when times are bad, Apple surprises and does well so therefore when times are good Apple should do badly.

  9. Apple's Valuation Dredging Bottom

    Research

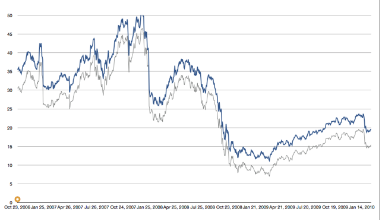
    The fact that AAPL is less valuable -- in terms of the P/E ratio -- than the average S&P 500 company continues to baffle me.

    Apple's P/E is a bit misleading because of the price "P" a large part is cash which should not be considered "at-risk" capital.

    The logic of a P/E ratio is to measure how many years it might take to recover one's investment. The cash on the balance sheet is not at risk for this calculation. Therefore the Enterprise Value /Free Cash Flow is a more accurate measure of company value creation. Until the recent re-statement the FCF and Earnings were divergent. They have since become equivalent.

    Therefore, if you take cash out, (currently $43/share) the Enterprise Value / Free Cash Flow for Apple is about 15. It had bottomed at 7 (now that we have restated data we can go back and re-calculate this).

    The graph above shows the traditional P/E in blue and the EV/FCF in grey (using restated financials).

    On a forward basis the EV/FCF is probably around 12 to 13.

    Also of note is that Apple's EV/FCF is lower than the S&P 500 (at 23.52 at the end of Q4 2009.)

    If we continue to use the S&P as a comparable, I looked up the estimates for quarter-end P/E for the S&P 500:

    12/31/2011 17.15

    09/30/2011 18.35

    06/30/2011 19.97

    03/30/2011 21.61

    12/31/2010 23.00

    09/30/2010 24.43

    06/30/2010 22.57

    03/30/2010 21.54

    12/31/2009 23.52

    Apple EV/FCF (and also traditional P/E) are lower than S&P on current and forward bases.

    How do we read this? Is the market considering that Apple's prospects are less than the average large company? This does not quite make sense to me. What other theory could be at work to explain this valuation?

    S&P estimates are sourced from:http://www2.standardandpoors.com/spf/xls/index/SP500EPSEST.XLS

  10. Estimating iPhone’s Nosebleed Gross Margins

    Research

    Apple’s latest re-statement of financial statements eliminated subscription accounting for the iPhone not just for the past quarter but for the entire history of the product, back to mid-2007. This allows a more precise estimate of the gross margin of the product and the results are eye-watering.

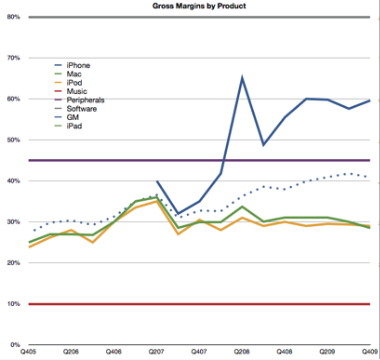
    Apple does not reveal the margin for any product. They do provide an overall margin for the company (shown in the dotted line above).

    The only challenge is to “back into” the GM for iPhone based on what we know of the margins for the other product lines and filling in the iPhone as the last piece of the puzzle.

    To do so, we need to have some idea of what the other products’ margins are. Fortunately, this is not that hard.

    We start with the easiest and work up:

    The Software products business line ($2.4 billion last year) is easily the most profitable on a unit basis as software does not require much cost in manufacturing. A solid ballpark estimate is 80% GM (which is what Microsoft typically gets.)

    Next, Music ($4.2 billion revenues). The estimate for music is fairly straight-forward. Apple and the industry have leaked the terms many years ago. Apple pays the labels most of the revenue of the music and keeps about 10% to operate the store. On the App Store there is a 30% margin off the selling price but that is offset by higher direct costs (shipping billions of free apps and free updates). I stick with 10% margin for the Music business line.

    Third, Peripherals. The peripherals business is not particularly large for Apple, but they do a fair amount of peripherals with $1.5 billion last year. My estimate for peripherals margin is 45% based on some comparables.

    Fourth, the iPod ($8.1 billion). The iPod has had a fairly well understood cost structure. The main variable is the cost of the memory, which, as a commodity, varies greatly quarter to quarter. Nevertheless, there is a strong consensus that iPod margins have kept around 29% to 30% over a few years. Teardown analysis coupled with spot pricing for memory chips gives a consistent average.

    Fifth, the Mac ($14.7 billion). The Mac is a difficult product to estimate margins for due to the relatively wide variety of SKUs in the market, the complex components, various quality/warranty issues, transportation costs and the point in the life cycle of any given Mac. The best estimates however hover around the same as the iPod: 30%.

    Once these values are available, and knowing the proportion of sales attributable to the iPhone vs. the other products, we can get an estimate of the gross margin.

    Recent GM estimates are all shown in the graph attached. Here are a few observations:

    1. The overall GM was tied very closely to the Mac/iPod prior to the iPhone.
    2. Gross Margin has been increasing since the iPhone
    3. The iPhone GM is consistently above 60% and is chiefly the reason for the increasing of the overall GM

    The expanding margin for the whole of Apple is quite a story in itself (especially vis-a-vis the tragicomedy of the other PC vendors). However, what really stands out is how high the iPhone margin is.

    Knowing why it stays so high in the face of an assault of “iKiller” devices is a clue to how Apple creates value.

  11. When to Sell

    Research

    I would sell AAPL when hateful articles are no longer written. When the consensus that Apple is dominant is overwhelming then sell. When computing has de-facto shifted to mobile, then sell.

    When there are no more iKiller wannabes and when competitors no longer seek to “take on the upstart” then sell.

    As long as there are doubters, whether due to ignorance or reactionary fear and loathing, the stock is underpriced.

    If you doubt and hate Apple, please post and comment and give me the confidence to hold.