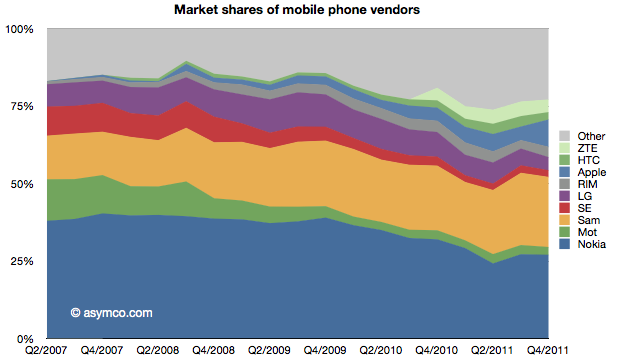
Sony Ericsson is no more. The company remains but the brand is gone. Now the phones it makes will be sold under the Sony name. Unfortunately, that means we no longer get reports from the company on its volumes, profitability and sales. The units will be part of "Other" from now on.
That vendor's data disappears as did HTC's and Samsung's earlier reporting. Bit by bit, vendors are withdrawing information. RIM stopped reporting its average selling prices some time ago, Motorola may disappear completely and they already stopped reporting tablet sales.
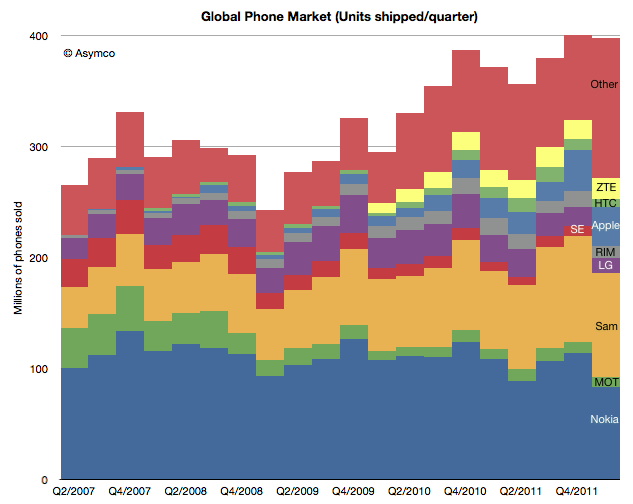
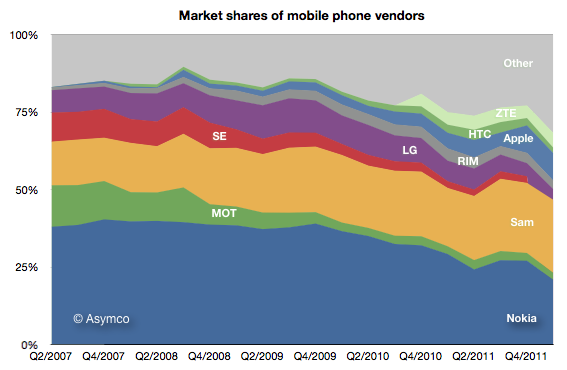
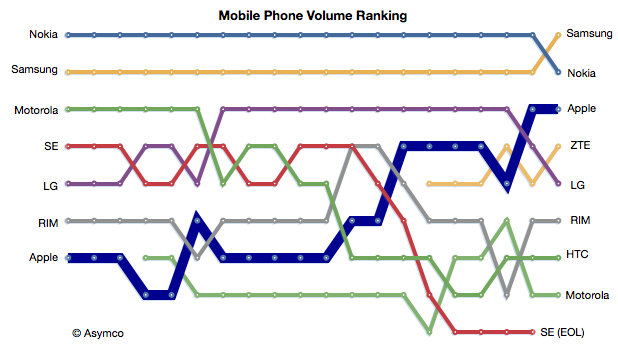
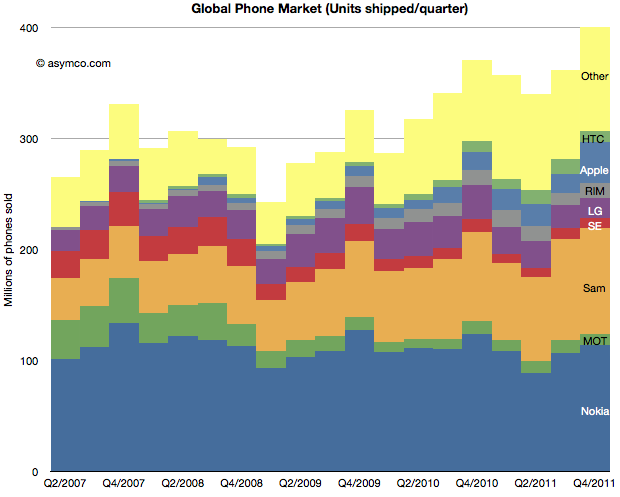
This makes the picture of the market fuzzier each quarter. We have to rely more and more on analysts who publish estimates. I try to pick from the available data the best assumptions but the errors are undoubtedly increasing. Here are the charts showing unit volumes in terms of absolute, share and ranking.
As I wrote previously, Samsung has overtaken Nokia which lost the top spot in unit shipment ranking, a spot it held for 14 years.
Of all the participants, only three brands enjoyed growth this last quarter: Apple, Samsung and ZTE. ZTE, like Apple, is noteworthy for its late entry. The others are in a mess: Motorola -4%, Nokia -24%, RIM -26%, HTC -29%, LG -44% in terms of unit growth y/y. This, while the market managed a modest gain.
It still find it fascinating that such a large market, selling 400 million units every quarter can exhibit such rapid change in participant ranking.
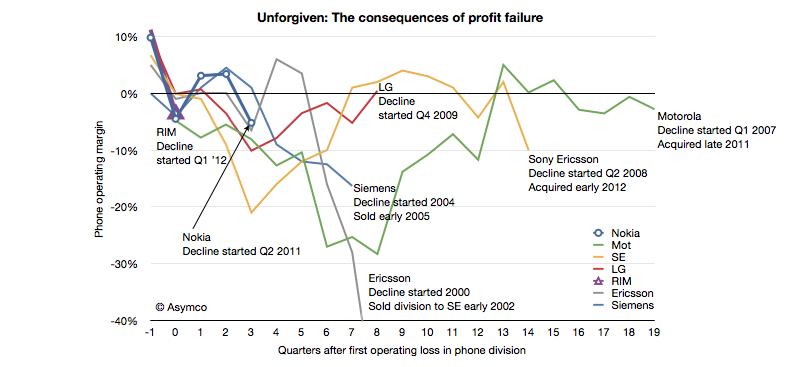
In June of last year I wrote a post titled "Does the phone market forgive failure?" It was written on the eve of Nokia's Q2 2011 report highlighting the historic consequences of a dip into negative operating margins for a phone vendor.
I listed 13 phone vendors who were either merged, liquidated or acquired. There are no examples of vendors who recovered from a position of loss making.
I was prompted to follow-up by a note Charter Equity Research analyst Edward Snyder wrote illustrating the effect of negative operating margins on phone vendors. I took his illustration and expanded it with additional data.
Since my post in June last year Sony Ericsson and Motorola were acquired making the victims list total 14 companies, with Nokia, LG and RIM having joined the "endangered species list". If the pattern repeats, then RIM and Nokia are in early phases of what promises to be an extended period of pain followed by an exit.
What the analysis does not answer is when a vendor loses its independence after beginning loss making. Motorola took 20 quarters; Sony Ericsson 14, Ericsson 8 and Siemens only 7. We cannot tell if or when LG, which is still operating after 8 and Nokia, which is now in its fourth and RIM, now in its second quarter post-loss, will lose independence.
The rumors swirling around RIM and LG are centered around exits and some suggest Nokia will follow. Many also argue that these companies will recover. The conditions they each face are different in details but broadly they are the same. Earlier last decade the exits were prompted by loss of brand value and subsequent loss of distribution. This decade disruption brought upon by mobile computing brings with it new business models centered on ecosystems and value captured through software and services.
Until and unless these endangered companies solve the dilemma of having the wrong business model at the wrong time, the chances are that they will not be forgiven for market failure.
The phenomenon we call business disruption could benefit from a different name. Although it signifies a disturbance or an interruption in an industry, it's much more than that.
The nominal definition I work with is that disruption is the "transfer of wealth in an industry from dominant incumbents to disadvantaged entrants." It's a convenient definition because it's brief, it puts the emphasis on economic value and because it alludes to a reversal of fortune and the implied extraordinariness.
However, there are several nuances lost and contradictions ignored in this definition. I want to enumerate them here and now:
Although in a disruption there is a transfer of wealth, that wealth is not necessarily conserved. An industry that undergoes a disruption often emerges larger, more productive or more influential. Disruption typically creates net growth.
Although extraordinary and spectacular it is also very commonplace. Disruption is not rare. In fact, it rarely fails to happen. One could even say that if it does fail to happen, it's a symptom of an industry in crisis.
Being so common, it can be seen as a regular occurrence. But if the regularity of disruption can be considered to have a clock cycle, its frequency is increasing.
Disruption in the literal sense implies discomfort, displacement and even destruction. But it's necessary to the health of any economy. The analogy to biology is that death is the most important thing in life.
Although only recently characterized and studied in cases set in the past century, the pattern is evident throughout history.
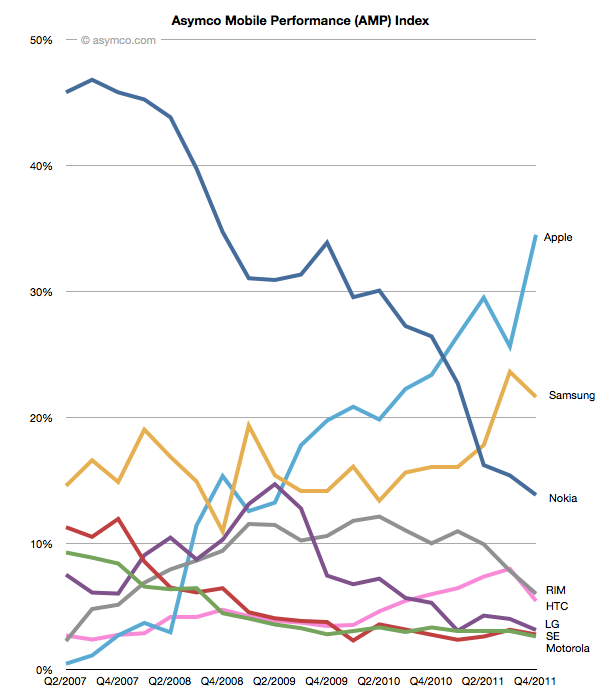
I've offered examples of these consequences or side-effects of disruption but I'll emphasize once more the example I'm most familiar with. To illustrate the primary definition, the AMP index is a measure of the success of one company relative to a set of peers in the mobile phone industry. It's the average of four market shares: mobile phone units, smartphone units, revenues and operating profits.
This chart shows the shift in AMP index values for the competitors whose data is public and which make up the vast majority of units sold:
The reversal of fortunes, though not complete, is clearly evident. Motorola and Sony-Ericsson, two of the brands that were a significant part of the mobile phone landscape for more than a decade, have ceased to exist as independent companies. A third, LG, is likely to follow. Nokia, the most successful phone vendor for the decade of the 2000's is in severe distress at this time, valued barely above book. RIM, a pioneer, is priced below book value and HTC, another pioneer is also looking for a way to remain relevant.
But we have to appreciate that as these valuations evaporated, the market grew both in value and in volume. The overall spending on phones has never been higher. The total profits captured is also growing. By any standard, smartphones are a booming business. Queues form for the latest versions, there are supply constraints and media coverage is almost universal.
We also have to appreciate that the Nokia that is faltering today was itself disruptive when it gained its prominence. In the 1990s the mobile phone market was dominated by Motorola, then by Ericsson. Nokia was a relative latecomer and succeeded by being better in some regards (e.g. the ease of use of text messaging on its phones) but also by being asymmetric. Using logistics and a portfolio approach to the market allowed it to build scale while maintaining margins. Process innovation led to component shortages for competitors and allowed Nokia to build massive distribution. It also allowed it to invest in software which gave it a unique selling point for several years.
Looking into the even more distant past, the mobile phone market has seen several waves of disruption. Going from analog to digital was such a turnover. The companies which were successful with analog (mainly Motorola which supplied not just handsets but infrastructure) were sidelined when global digital standards took root. Integrated European vendors dominated a period when 2G GSM was becoming predominant. Isolated pockets of integrated innovation like iMode in Japan also had mini-booms but were swamped by standardization and the Galapagos syndrome.
And let's not forget that mobile itself has been disruptive to fixed line telephony. Looking at all telecom, the transitions from fixed to mobile, analog to digital and most recently feature-based to computing-based platforms have all been disruptive, bringing a new set of companies to lead while incumbents fretted.
It should also be noted that these changes are happening more rapidly. The chart above has a five year period. The change from analog to digital took longer. Over 10 years since its inception analog was still dominant. If we look how long it took for mobile to take consumption away from fixed, that process is still ongoing, several decades later. The speed is so slow that some countries have skipped over fixed networks altogether.
With software-defined devices and cloud-based distributed computing the changes will become even more rapid. Even though the user base is expanding to cover nearly the entire global population, the replacement rate of devices means that change in the tools and services people use are limited by supply rather than demand. Supply-based innovation or "the new manufacturing" will probably be the dominance-defining asymmetry of the next decade.
The disruption of mobile phones that Apple has foisted on the world through iOS has caused it to reach a point where it dwarves the values of other companies, not just in the sectors it competes, but in all sectors. Some suggest that Apple is an anomaly and does not reflect the economy. To truly understand the state of the economy, they say, means to subtract Apple from it. But I feel this is exactly wrong. Apple is, through the iPhone and iOS ecosystems, defining this era. Just like Microsoft defined an era of increased productivity through the creation of the "knowledge worker", or like GM re-defined transportation and the notion of the brand in the 50's, or like IBM re-defined business process efficiency with automation in the 60's and 70's, these companies were not anomalies of their era. They were the eras. They were the locomotives of growth that taught other companies how to operate and the contemporary managers how to manage.
Companies that study Apple today will benefit by understanding how it re-wrote the rules. The anomaly is the norm. The exception is the rule. The times they are indeed a-changin'.
Finally, to put disruption in a historical perspective. I wrote a retrospective on the history of the telegraph as a parable of how disruption could be interpreted to have happened even a century ago. What I hope to do now is to show how, given this set of spectacles, we can see how the fate of nations was determined, in part at least, by the ability of leadership to accommodate disruption.
The case of growth or limits to that growth, the question of integration vs. modularity and the evolution of value chains all have application for regulators, policy makers and political leaders.
The dialogue on this topic will begin in Amsterdam on April 13th 2012, at Asymconf. I look forward to seeing you there.
---
Notes:
This is the material accompanying the first case discussion at Asymconf. Participants are encouraged to read it before the show.
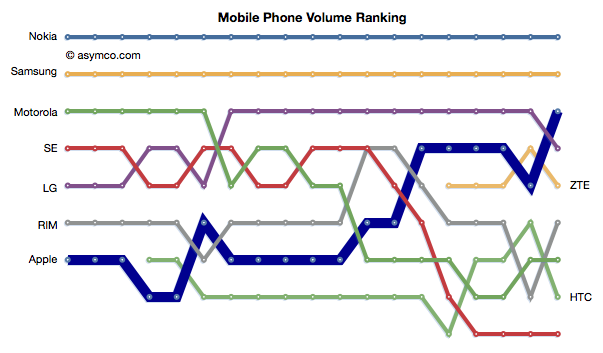
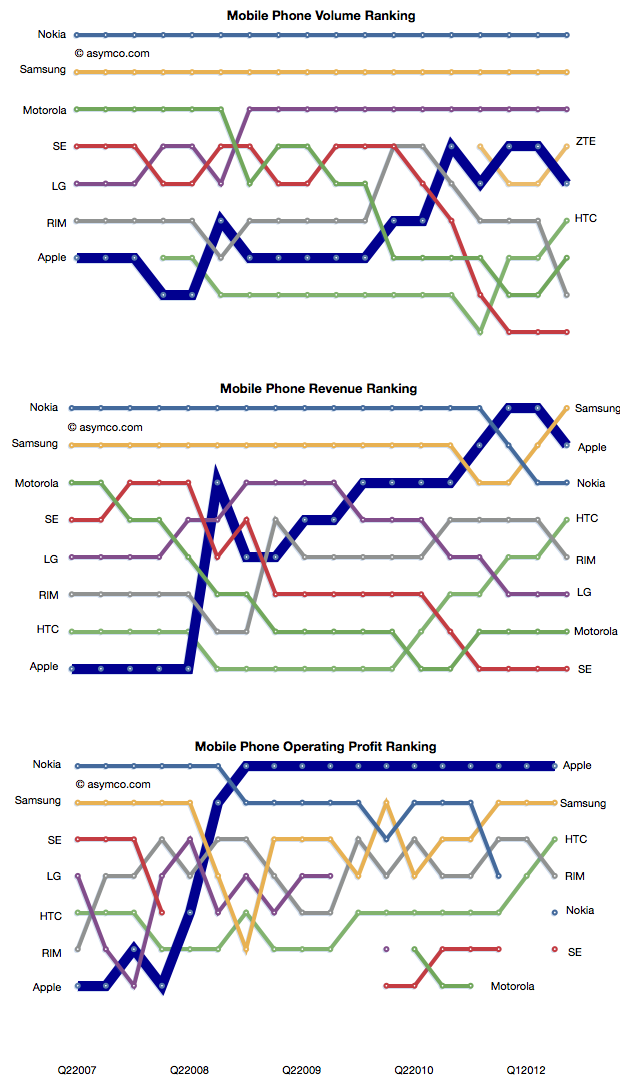
Apple reached the third place rank in total units shipped during last quarter. The following chart shows the ascent in rank.
Apple achieved this with a total market share of about 9%. Second place Samsung has 22.6% so there is significantly more room to go before Apple gets to be second. Nevertheless, the climb to third was achieved in less than five years. At the time when Apple entered the market third place was held by Motorola with shipments of 35.5 million units (Q2 2007). Motorola only managed 10.5 million in the last quarter.
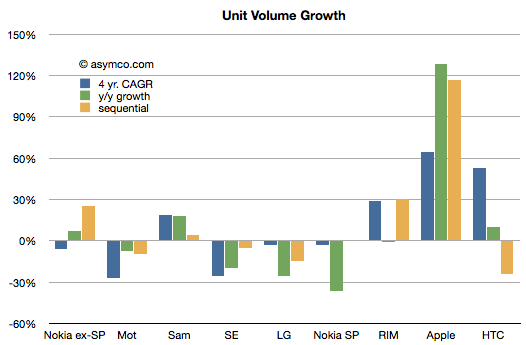
To see growth I prepared the following chart showing the fourth quarter's growth by vendor according to four years' compounded, sequential and y/y growth.[1]
On a four year compounded basis, the pattern is that of Apple, HTC and RIM showing significant growth with Samsung showing moderate growth. The other vendors all had negative real volume growth. The list does not include "Others" which had 13% compounded growth.
Projecting Apple's 60% rate of growth and a market growth of 10% leads to Apple obtaining 27% share by the end of 2014. My guess would be that is when we'll be able to write a post about Apple being second.
---
Notes:
I don't have HTC data for Q4 2007 so the compounded rate is measured for three years.
Here is a discussion of the changes since the last analysis:
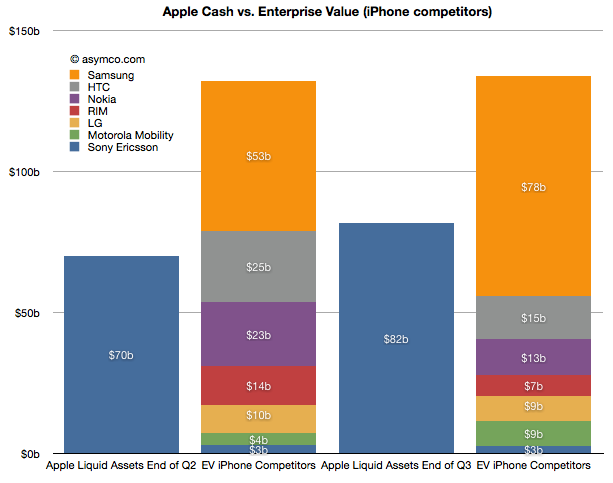
Sony Ericsson was valued through its acquisition by Sony. We did not have a way to value the enterprise before as it was not traded independently. Last June I estimated a 14x multiple on its trailing twelve months' profits and got $3.0 billion. Since then half the company changed hands for about €1.05 thus yielding a total company value of $2.8 billion. The enterprise value should be therefore slightly lower but I'll stick with the current transaction value as the EV.
Motorola Mobility has entered into an agreement to be acquired by Google for $12.5 billion by Google. The company's enterprise value jumped as a result to about $8.6 billion.
RIM's share price collapsed and it's now also trading at an EV of about 7.3 billion (Yahoo finance).
Nokia's price has also dropped and it now has an EV of about $13 billion (Yahoo finance).
HTC recently dropped significantly in price and is now worth about $15 billion EV. (Note that pricing of its equities is subject to suspended trading due to drop limits).
LG's phone business is still losing money and it's still difficult to value. In November it was revealed that the company was seeking to raise $890 million in capital to fund new initiatives including smartphones. The share price fell by 14%. In June I suggested a nominal value for the phone business of $10 billion. I think that's very generous and with recent events I would place that value at $9 billion today.
Samsung's fortunes have increased. In June I applied a 14x multiple to their trailing 12 months' operating earnings. Given overall discounting of the sector I applied a multiple of 13 today. That yields a business value of $78 billion. Interestingly, that is larger than the value of all other competitors apart from Apple. That also makes it six times more valuable than Nokia.
Apple's cash and cash equivalents and investments grew by about $12 billion and were worth about $82 billion as of October.
In summary, in June Apple's cash was about 53% of the sum of competing phone vendor enterprise values. Today it's about 61%. Excluding Samsung, Apple could buy the industry and still have $25 billion left over. This makes the claim that "Apple could buy the industry" even more believable.
This analysis is mainly academic. It does not imply that any such transaction will take place. As the purchase of Motorola shows, control has a premium and individual buyers may be less "rational" than markets. What it does show however is that the entire industry is in a state of crisis. Valuations for phone companies are collapsing and two major brands (Motorola and Sony Ericsson) are being absorbed and could disappear.
At the same time entrants are arriving with completely different business models. Amazon, Facebook, Baidu, Alibaba are intent on selling phones or platforms to be valued as enablers for asymmetric business models rather than as phones. One could argue that what Apple itself sells is more than hardware and that its value-add "on top" of hardware is increasing. This is a sign of commoditization. Certainly the voice business is well beyond that point but it now appears that even the smartphone business is already in an advanced state of value compression.
All the while the overall market is growing. I had separately looked at the profit pool and concluded that the brands are suffering. Summing up the votes from stock markets, the sentiment is even worse. 2012 is looking more and more as a year of inevitable and dramatic industry change.
As shown in the yesterday's post, in the third quarter, overall mobile phone profitability declined. The eight vendors I use as a proxy showed a total net profit of $8.51 billion, down slightly from $8.57 billion and a drop of $9.01 billion in the first quarter.
Overall, the industry dropped by 1% sequentially but is still up 30% over last year and has a 20% compounded growth rate over a three year period.
Nokia returned to profitability, though at $180 million it's only about 2% of the top eight.
Motorola remained in the red with a small loss of $20 million, an improvement over the $90 million loss of the previous quarter. Motorola is being acquired by Google after an accumulated mobile operating loss of $4.69 billion since the beginning of 2007. It's unlikely we'll receive any updates on performance thereafter.
Samsung had a great quarter with a sequential increase of 19% and year-on-year growth of 130%. The total profit amounted to 25% of the peer group.
Sony Ericsson broke even with about $50 million in operating profit. Like Motorola its performance was barely break-even during the last four years and its also disappearing from our list of independent vendors as it becomes part of Sony.
LG had its sixth consecutive quarterly loss and is now appealing to investors for more capital to continue operating as a smartphone vendor. Raising dilutive capital seems a radical approach and not one that inspires confidence.
RIM had a sequential reduction in profit of 35% and y/y reduction of 30%. The company is exhibiting clear signs of decay and the stock market is valuing the company below book value.
Apple profit dropped by 19% but grew 43% y/y during a transitional quarter. The growth remains 43% compounded over three years.
HTC has a 1% sequential increase but a 78% y/y growth.
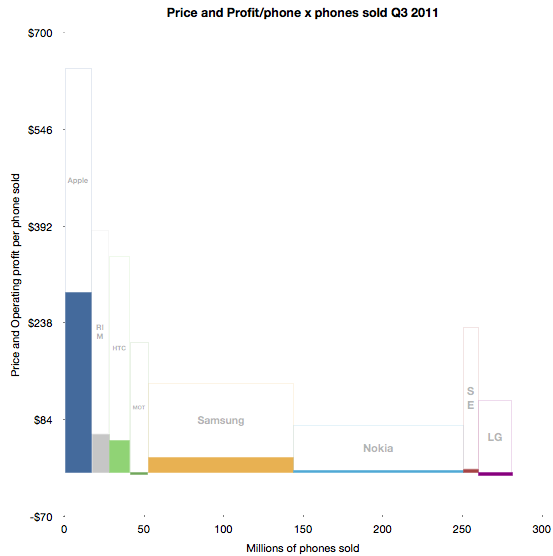
To illustrate the performance in terms of profit, pricing, volumes and margins, I developed the following chart.
The solid areas representing profit are operating profit/phone in the vertical axis and volumes shipped in the horizontal. The blank areas above are the cost of goods sold per phone and the combined solid and blank represent the average revenue per phone.
Some of the areas are over-represented due to the lack of resolution available.
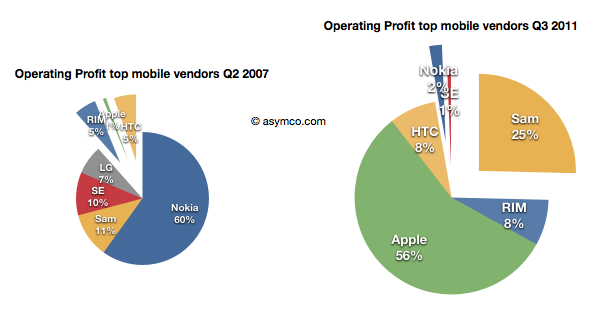
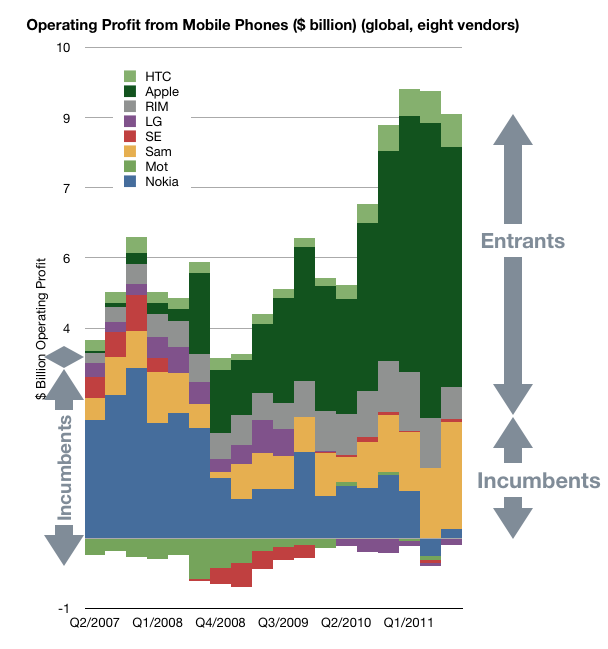
Using before-and-after pie charts for positive profits, we can see how the entrants (RIM, Apple and HTC) went from 6% of profits to over 73% four and a half years later.
I feel that this is somehow the end of an era. I've written before about the brutality of this market, listing 13 companies which were either merged or acquired or disappeared in the last decade. Now both Motorola and Sony Ericsson will soon be added to the list. On average, it's as if one phone vendor has disappeared every year for fifteen years.
And it's still not over. RIM is also becoming a going concern issue, and LG has a big question mark above it.
Of course, ZTE and Huawei and Lenovo are joining the list of competitors but I note that they are not focused on mobile phones. They are opportunistic phone vendors, depending on other businesses to compensate for the risks inherent in phone sales. It's interesting to note that neither Apple nor Samsung are pure phone plays.
In fact, of all the phone brands only RIM and HTC are exclusively phone-only companies. It may indicate something profound is happening. The notion that the development and marketing of phones as an activity independent of other business models may be coming to an end.
A few years ago, around the middle of the last decade, the mobile phone market was characterized by the rivalry between a few established vendors. These were Nokia, Samsung, LG, Motorola and Sony Ericsson. These incumbent companies had a broad portfolio of devices including smartphones and feature phones and basic phones. Many also sold networking equipment and were deeply engaged with their customers, network operators.
There was also a set of entrants who offered only smartphones. They were quirky. HTC was a a prominent "ODM" or original design manufacturer who built phones for companies who added their brands and sold and supported the product. HTC made phones and PDAs for operator brands and for some large PC companies. It also began to sell phones under its own brand. RIM was also offering products that had evolved from pagers into email appliances with added voice capabilities. But RIM's products were not very good as phones. Voice was so poorly integrated that many people carried both a BlackBerry and a voice phone. Then there was Palm with something called a Treo which promised many things but did not quite deliver.
In 2007 something happened which changed the industry. It took a few years to even realize it was happening but by the time it was obvious, it had changed to such a degree that huge companies found themselves in financial distress. This chart illustrates the effect.
In a few short years the rivalry between incumbent handset makers has evolved into a rivalry between mobile platforms where the incumbents were caught in an increasingly unprofitable role of hardware integrators. Motorola is now being absorbed by a search company. Sony Ericsson is being absorbed into a consumer electronics company. Nokia is going through a potentially existential crisis and even abandoned its platform. Acquisition talk surrounds LG's phone efforts. Samsung is prosperous but sill at the mercy of its software suppliers. Even the entrants are starting to feel beleaguered. RIM, the oldest pure play smartphone company is trading below book value and has regressed in value to 2004 levels. Palm evaporated. A view into the changes is the rankings of the companies in terms of volumes, sales and profit as shown below.
How did large, powerful, smart companies let this happen?
It happened despite having a clear, front row view of the transition of the industry from mobile voice to mobile computing. The shift in the basis of competition from "connecting people" to "connecting people to data" ended up being a classic disruptive trap. Many will argue that it was the failing of individual managers. Perhaps, but how did they conspire to fail simultaneously?
When you see disruption happening, it's natural to seek out a cause, a pivotal magical "force" or event that enabled the weak to humble the strong--the proverbial sling that enabled David to defeat Goliath.
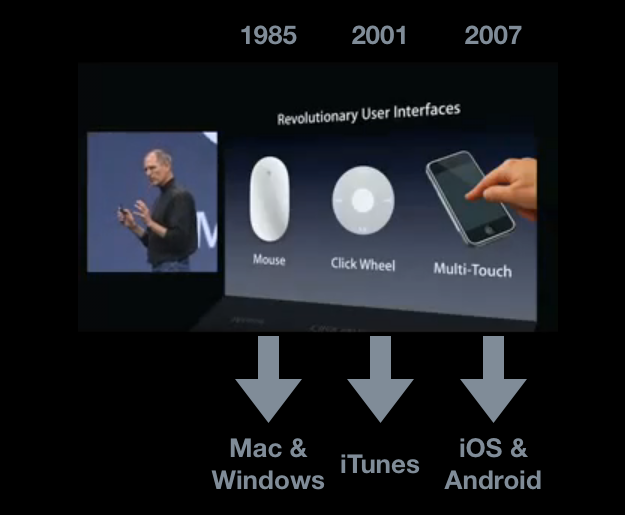
My hypothesis is that The Primary Cause for the shift of profits from Incumbents to Entrants has been the disruptive impact of a new input method. I illustrated this with the help of the January 2007 slide presented by Steve Jobs at the launch of iPhone.
Each new input method led to not just a disruption but new platforms and new business models. Each new "sling" victimized a set of historic companies. Mainframe and minicomputers, consumer electronics giants and now telecoms.
Just like David's sling, these technologies are not powerful in and of themselves, but rather, the way they are used makes them unpredictably sinister. The context of using capacitive touch on a handheld device rather than on a table-top makes it disruptive. Coupling it with high-speed mobile networks and powerful but efficient microprocessors made it into a force.
That is now ancient history. The consequences and repercussions are still being felt and weighed, but the smart money should be focusing on the next shift. From the time frame in the diagram above, it's clear that the cycle time between "Revolutionary User Interfaces" is shrinking. It's been five years since multi-touch. Is the next "RUI" already here? Is Siri the next RUI?
There are many things going for it:
It's not good enough
There are many smart people who are disappointed by it
Competitors are dismissive
It does not need a traditional, expensive smartphone to run but it uses a combination of local and cloud computing to solve the user's problem.
It is, in a word, asymmetric.
My disruptive hypothesis for Siri is that it shifts the competition from platforms positioned on a device to a "coupled" super-platform dependent on broadband and infrastructural computing.
Just after collecting enough data and observing patterns in it that give us clarity, It looks like things are about to change all over again.
Samsung no longer reports mobile phone shipments. The company's phone market performance reporting is limited to the following:
Shipment : High-20%↑YoY (low-20%↑QoQ)
ASP : Slight increase QoQ
As the company did not report volumes or ASP last quarter either, the QoQ (Quarter on Quarter) growth estimates are almost useless. The only fragment that might be useful is the "High-20% YoY" given that they did publish units for Q3 2010: 71.4 million. This leaves the question of what "High-20%" means. Here are some ranges and what the result would be:
92.1 million assuming 29% YoY growth
91.4 million assuming 28%
90.1 million assuming 27%
The "best guess" might be 91.4 million.
As the company also provides revenue for its mobile division (14.42 trillion Won) we can therefore estimate the average selling price: $142. Is this a slight increase? By a similar approach, last quarter's ASP was $139, and assuming exchange rates did not vary widely, this increase is small enough to be called "slight".
We also have a figure for the operating margin for the entire Telecom group (16.9%) which gives an operating profit of $2.2 billion.
The last piece of the puzzle is the number of smartphones Samsung shipped. Samsung said smartphones grew "more than 300%" year over year. That would imply 31.4 million. One estimate is from Strategy Analytics that suggests 27.8 but it's coupled to an overall volume estimate of 88 million (well below the 91.4 million estimated above). The Wall Street Journal published an estimate of 28 million.
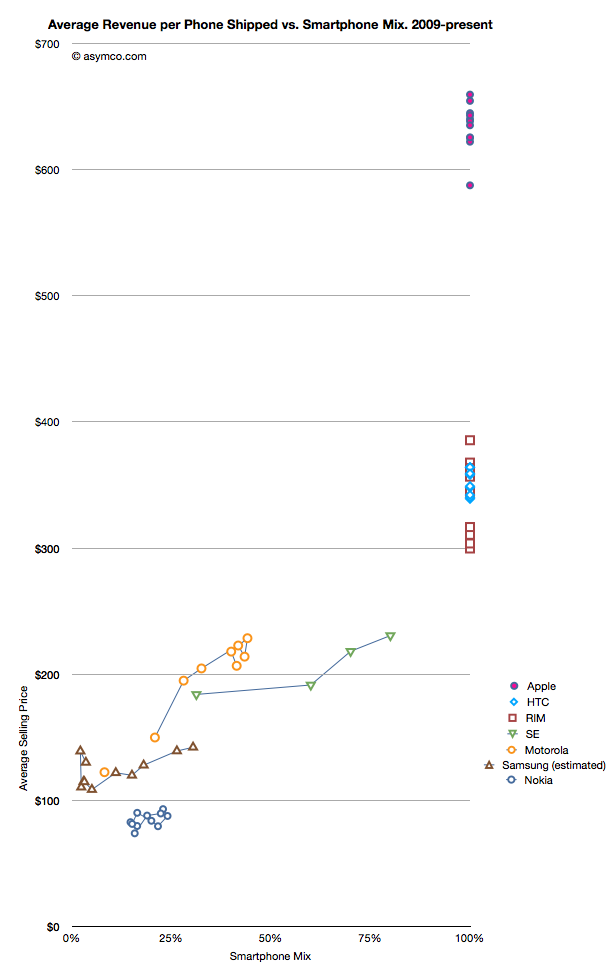
I have no idea how to narrow down this estimate, but if we go with the one that claims the highest precision (27.8 million) we get an estimate of about 30.4% of Samsung's volumes being smartphones (what I call the "smartphone mix"). That is an interesting basis for comparing Samsung's smartphone business to other companies' smartphones. I prepared a graph showing how pricing is affected by the increasing mix of smartphones in vendor portfolios.
What the graph shows is the movement of prices as companies have increased their smartphone mix since Q1 2009. For example Sony Ericsson moved from 31% smartphones to 80% smartphones in about a year. Their ASP increased from $184 to $231. Some companies have not changed their mix. Apple, HTC and RIM have maintained 100% smartphones in their portfolios so their pricing has been consistently high ($650, $354 and $357 over last 12 months, respectively). Conversely, Nokia has struggled with its smartphone portfolio and as a result its pricing has remained stubbornly clustered below $100.
But the most interesting companies to watch are Samsung, Sony Ericsson and Motorola. You can see how their "vectors" or price migration point toward the sweet spot where HTC and RIM reside. Ideally, they would be very much better off with pricing in the $300 range.
Samsung is moving quite rapidly toward the sweet spot but the slope is not as steep as the others. That's may be because SE and Motorola have much smaller volumes but it's still an open question why, with an estimated 30% mix of smartphones, the pricing remains $60 lower than when Motorola was at the same mix or $40 lower than Se.
Some of the answer might be due to the number of "low end" smartphones (Bada?) that Samsung is selling or maybe their non-smartphone pricing is trending down a lot more rapidly.
Keep in mind that if we change the assumption of the number of smartphones to a lower number (i.e. below 27 million) then the trajectory of the Samsung line in the graph would increase and may match more closely the slope of the other two vendors.
I don't have any reason to believe that it's lower than 27 million but I don't have any reason to believe that it's above 27 million either. It's an estimate.
If we believe it then we have to say that with a near tripling of smartphone mix (from 11% to 30.4%), the company grew its overall units by 28% and its revenue by 39% and pricing by 17%. Profits also grew by 130%.
It would follow then that switching to a 100% smartphone mix would make a lot of sense.
In his recent posts Horace took a look at Apple’s fixed assets and their development over the recent years. He also tested the hypotheses that Apple is making investments into machinery & equipment on which iOS devices are produced by overlaying iOS volumes with preceding changes in property, plant and equipment (PP&E).
The question that has arisen is: Are Apple’s investments in PP&E extraordinary?
To answer, I have compiled the capital expenditures (CapEx) for our previously established peer group [1].
But first we need to clarify what CapEx include and not include. CapEx includes investment into property, plants, equipment, office furniture, larger IT hardware and in some cases patents; CapEx do not include investment into long-term marketable securities or other long-term financial instruments, acquisitions or capitalized R&D. Furthermore, CapEx are gross values and are not net of any sold equipment [2]. CapEx are largely depending on a company’s business model and strategy. For example if you are a manufacturer you need equipment to operate, if you are a software company or a retailer, your business will not be capital intensive.
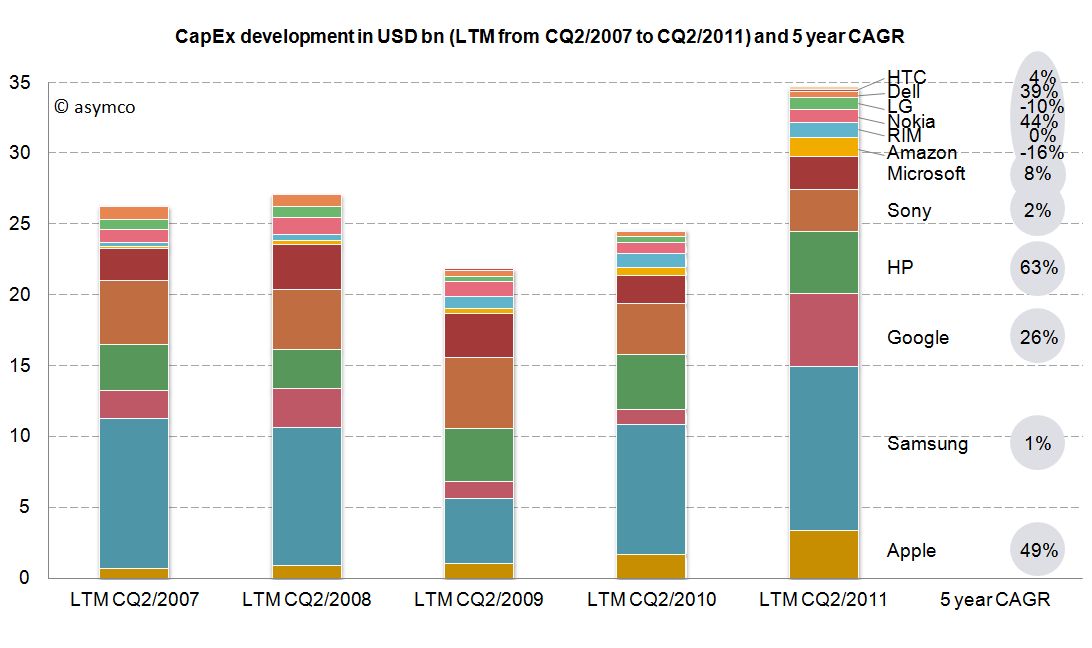
As the second calendar quarter of 2011 is the latest quarter for which all companies have reported figures, we will take a look at last twelve months’ (LTM) figures from Q2/2011 backwards. The following stacked bar chart shows the combined CapEx of our peer group:
The combined capital expenditures of our peer group for the LTM CQ2/2011 have outpaced even pre-crisis levels of investments and, combined, account for $34.7 billion. Samsung, a diversified manufacturer of IT hardware and other equipment, has invested more than $11.6bn with Google ($5.1bn), HP ($4.4bn) and Apple with $3.4bn following in line. While Google’s CapEx mostly account for its infrastructure of server farms and other IT hardware, HP’s CapEx mostly account for IT hardware it leases to its customers [3]. In absolute terms, Apple takes fourth place in CapEx spending for the last twelve months ending in CQ2.
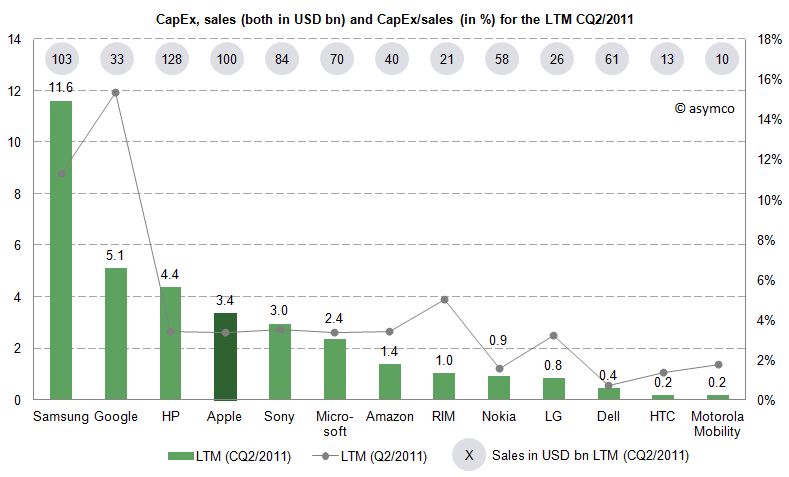
Since the business model and sales magnitude varies largely in our peer group, we can also take a look at a common measure to compare CapEx intensity by dividing CapEx by sales achieved in the same period. For the last twelve months we can depict the following chart:
The average of the peer group accounts for 4.4% of CapEx over sales. Samsung’s and Google’s business model are clearly more capital intensive, while Apple’s CapEx ratio of 3.4% is below the peer group average but above some of its peers like Nokia, Dell, LG, HTC or Motorola Mobility. Interestingly, capital intensity of HP, Apple, Sony, Microsoft and Amazon is at a comparable level of around 3.4%.
As noted before, business models and strategies are significantly different among companies in our peer group. However, while Apple’s CapEx intensity is not extraordinary, Apple’s CapEx in absolute terms are among the largest in it this peer group and have grown constantly throughout a five year period.
Is this a good thing and why does it matter?
CapEx by itself does not tell us much. We still do not know in what companies specifically invest as financial regulations do not require detailed CapEx accounts. We know that even if a company is not growing assets they need to be maintained, upgraded and replaced – this spending is also called "Maintenance CapEx". Everything else can be called "Expansion CapEx" associated with new product launches, entry to new business area or geographies or expansion of (manufacturing) capacity.
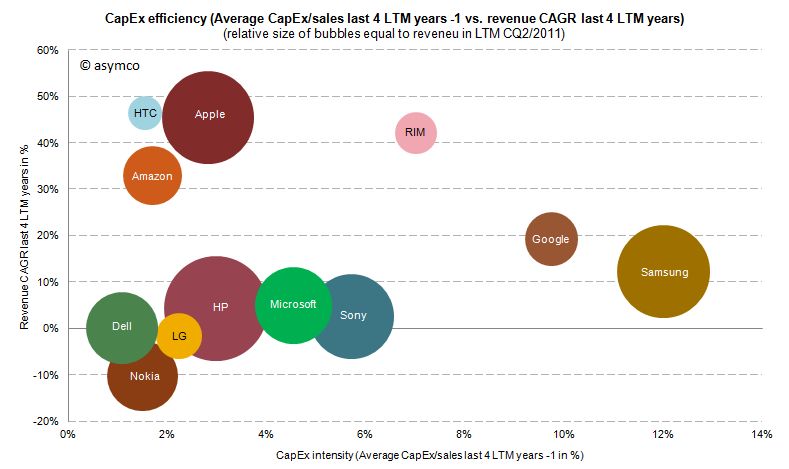
Therefore, Expansion CapEx is closely linked to expected organic sales growth in the future. So let’s go ahead and link CapEx ratio of the previous years with the sales growth of the following year. The following chart shows the cumulative average growth rate (CAGR) over the last four years versus the average of CapEx/sales ratio of the four last preceding years:
We can see that high CapEx efficiency has been achieved by Amazon, Apple and HTC with sales growth rates of 33-47%. RIM reached similar revenue growth but with higher CapEx intensity. Google and Samsung with high CapEx intensity have only reached modest growth rates. Dell, HP, Microsoft and Sony have not grown significantly but have close to average CapEx intensity.
We cannot state that CapEx in absolute terms have been extraordinary for Apple, but we can witness that with below average CapEx/sales ratio Apple outgrew in absolute terms Dell, LG, Microsoft, Nokia and Sony and has grown close to the revenue size of Samsung and HP in the last four years.
---
Notes:
Excluding Lenovo (not reported) and Acer (extra-ordinary low numbers reported, to be investigated), Motorola Mobility figures only available for the last six quarters
Minor differences may occur due to local Generally Accepted Accounting Principles (GAAP)
HP assumes ownership of these assets and rents them to the customers who in turn have a smaller balance sheet and can run IT hardware CapEx through the income statement as lease expenses
Google's acquisition of Motorola is clearly designed to be an acquisition of Intellectual Property rather than an entry of Google into the phone business, but the impact on the business will be felt in many ways.
It is surely going to send some Android vendors scrambling. The situation is not without precedent however. The history of governance and ownership of Symbian shows how the licensing of platforms by licensor competitors leads to unintended consequences.
Symbian was formed to be governed in a way very similar to the original Android via the Open Handset Alliance. The company was owned by a consortium of phone vendors.[1] The shares were not equally distributed however with Nokia holding a larger share (though not a majority).
Although nominally involved in decision making, the smaller shareholders never felt entirely comfortable with the arrangement and over time some sold their shares and left the group even though they continued to license the OS.
Eventually Nokia ended up acquiring the company outright and open sourced the code. However, by then the product was obsolete and the only licensee was Nokia itself.
The lesson (and warning) was that a licensor that is also a licensee makes other licensees uncomfortable. The supplier is also a competitor. This is classic channel conflict and never ends well.
Open or not, with or without equity, these arrangements are always unworkable.
So Google's promise that
"This acquisition will not change our commitment to run Android as an open platform. Motorola will remain a licensee of Android and Android will remain open. We will run Motorola as a separate business. Many hardware partners have contributed to Android’s success and we look forward to continuing to work with all of them to deliver outstanding user experiences."
seems naive at best.
--
Notes:
Before its outright purchase by Nokia in December 2008, Symbian Ltd. was owned by Nokia (56.3%), Ericsson (15.6%), Sony Ericsson (13.1%), Matsushita (10.5%), and Samsung (4.5%). The company's founder shareholders were Psion, Nokia, Ericsson, Panasonic/ Matsushita and Motorola. Motorola sold its stake in the company to Psion and Nokia in September 2003. Psion's stake was bought by Nokia, Matsushita, Siemens AG and Sony Ericsson in July 2004.
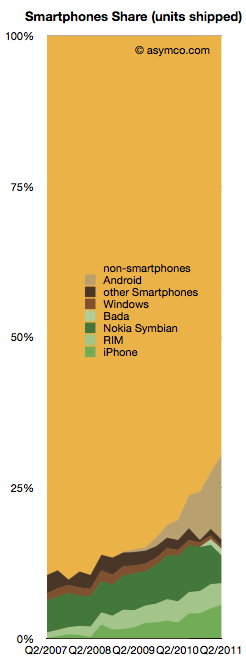
Smartphones made up about 30% of global phone sales last quarter. That is a significant increase from 10% in Q4 of 2007.
From this perspective, iPhone obtained 5.6% share, Android 14.2%, Nokia Symbian 4.6%, RIM 3.6%, Bada 1.1% and Windows 0.4%.
The competition however still has 70.5%.
The chart to the right shows the challenge remaining and the progress being made.
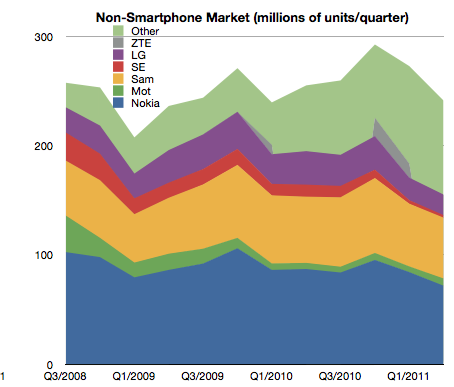
The good news is that the non-smartphone market is not growing while the smartphone market is. In fact, the non-smart market has had a three year CAGR of 0% and a y/y growth of 1.0% and a sequential decline of 6%.
The non-smart portion of each branded vendor's business is pretty dismal:
Nokia saw 17.57% decline y/y
Samsung's non-smart business declined by 8.14%
Sony Ericsson's dropped by a dramatic 80%
LG's fell by 38.56%
Motorola is the only one that grew y/y, by 17.86.
The reason all these brands fell is because the unbranded vendors took their place. "Other" non-smartphones grew by 43%. They have been sustaining growth at the rate of 57% compounded over three years.
The following chart shows the increasing share taken by the "other" vendors in non-smartphone units:
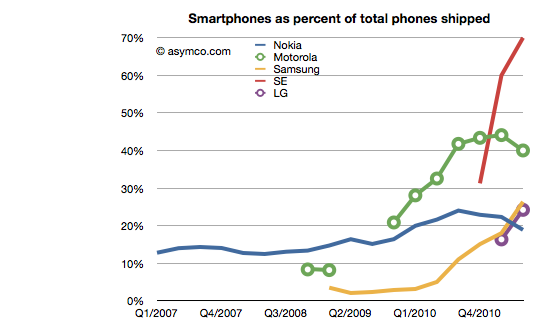
The non-smart business is so dismal for branded vendors that I've been assuming that they will cease to build such devices in the near future.
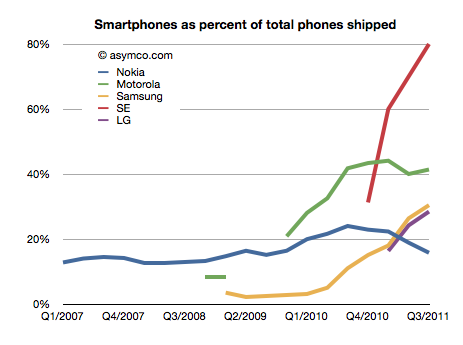
The trend is shown in the following chart which shows the percent of units for branded vendors which are smartphones.
Motorola, Sony Ericsson and Samsung are fleeing to smartphones as rapidly as they can. LG is following as quickly as possible as well.
The only question remains with Nokia. While their smartphone business evaporates they've also made a commitment to the non-smartphone market and are thinking about "the next billion" users who, presumably, will not buy smartphones and will buy some variant of Nokia's Series 40.
Targeting the low end may be commendable, but the question they need to answer is why would those next billion buy anything other than a low cost smartphone? And if not, then what's so different about the next billion?