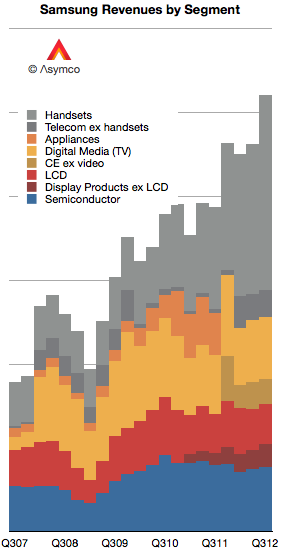
As first introduced last week, Samsung's revenues have grown primarily due to the expanding volumes of smartphones. In today's post I convert the revenues and operating incomes to US Dollars and compare them to a set of companies.
First, I should note that Samsung has changed both the designation of its divisions and the way it reports revenue. Broadly speaking, Samsung Electronics has four major divisions:
Semiconductors. This includes memory products as well as systems such as CPUs.
Display products. This used to be called "LCD" but has been re-named Display Products.
Telecom. This is mainly mobile phones but includes additional products and services for telecom operators and PCs. The division has recently been re-named IM (IT and Mobile communications).
Consumer Electronics. This group has changed names from Digital Media and Appliances to CE. The majority of sales value comes from televisions but also includes consumer electronics and appliances.
The company further combines Semiconductors and Display Products into a group called DS (Device Solutions) and Consumer Electronics and IM into DMC (Digital Media & Communications).
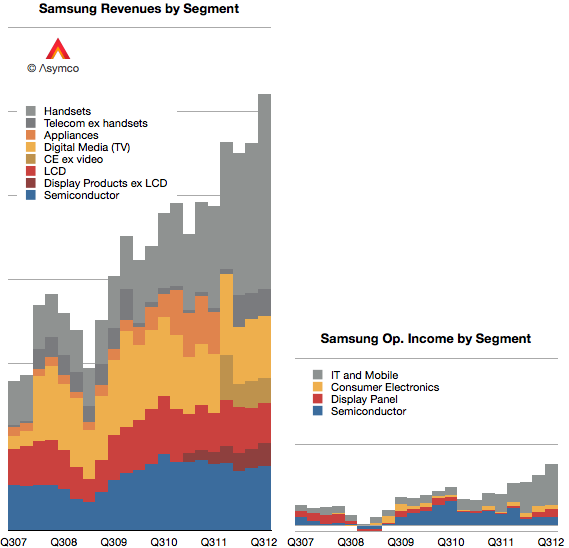
I tried to reconcile these various nomenclatures with color coding in the following graph. Semiconductors are blue, Display components are red, Consumer Electronics are Yellow and Mobile are grey.
Each gridline represents $10 billion.
One more point to note about revenue recognition: Relatively recently the company has switched from reporting consolidated revenues to gross revenues. This means that current sales include inter-segment sales. So, as much as it is possible, the data above shows sales from division to division as well to external customers.
When it comes to reporting operating income, the company offers four segment values: Consumer Electronics (Appliances, TV, "Digital Media"), IT and Mobile (including mobile phones), Display Panel (formerly LCD), and Semiconductor.
I used the same color coding to show the income values in the same scale as the graph showing income:
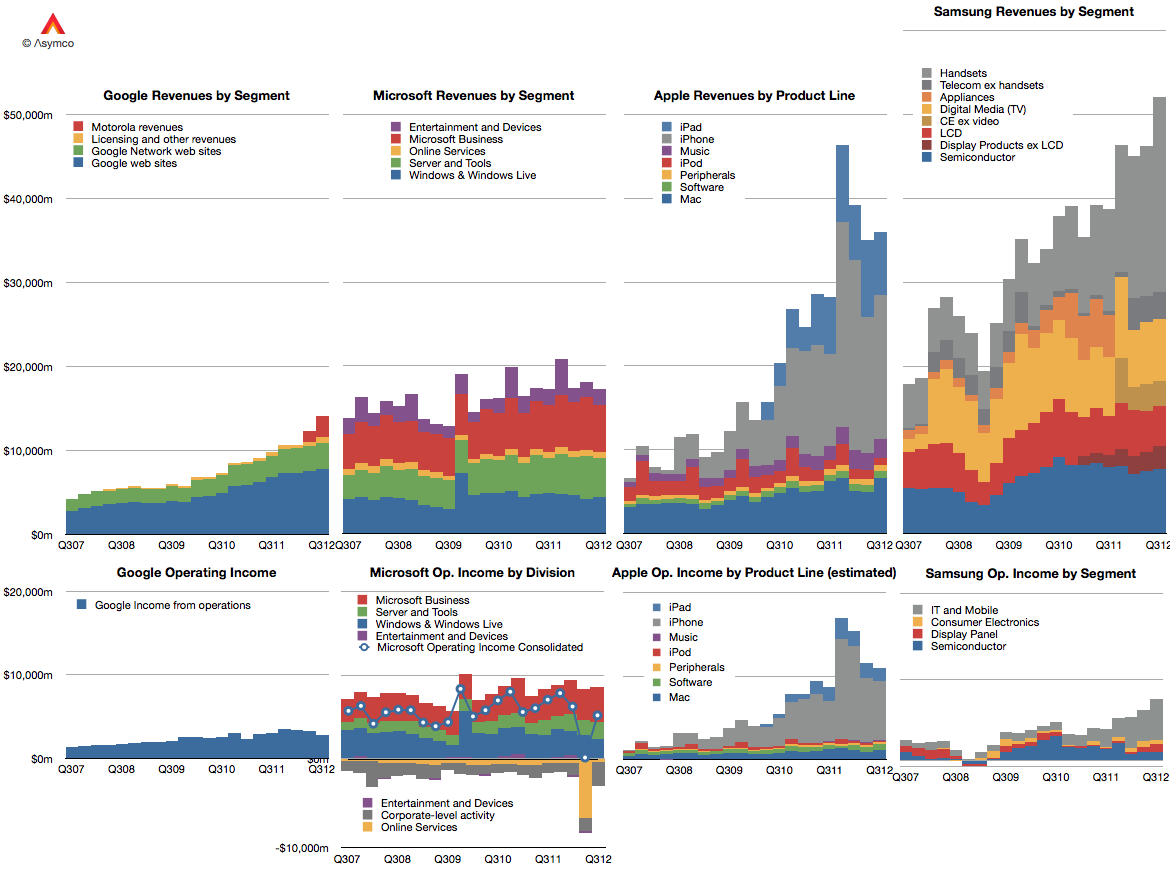
It's now possible to compare Samsung Electronics with Google, Microsoft and Apple in terms of divisional (as a proxy for product-line) revenue and profitability over a five year period.
At this time, a portion (majority?) of Samsung's grey area in the operating income graph represents the vast majority of profits obtained from Android across the entire ecosystem.
Google, Microsoft and Apple all had reasonably good second quarters. Microsoft's revenues grew by 4%, Google's by about 22% and Apple by 23%. Apple's growth was disappointing but the other companies weren't. The revenues for the three companies are shown in the following charts:
I also showed the performance of each company's operating income in the bottom three charts.
Microsoft did declare a one-time write-off of $6.2 billion which it spent on aQuantive a few years ago. That was booked as contributing to a loss of $6.67 billion for its Online Services division. Without that one-time charge consolidate operating income would have grown at about 3.6%. Google's operating income grew at a rate of 11% and Apple grew (again, disappointingly) at 23.4%.
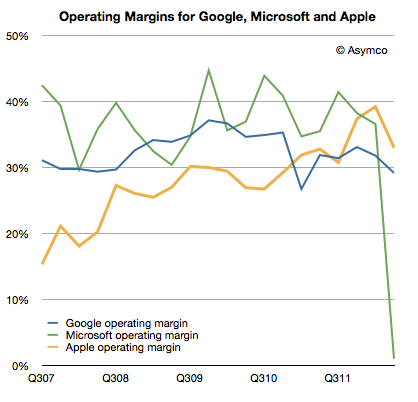
Apple's operating margin fell to 33.1% while Google's fell to 29.2%. Microsoft's margin evaporated due to the one-time charge. If we back that charge out, the margin would have slightly topped 35%.
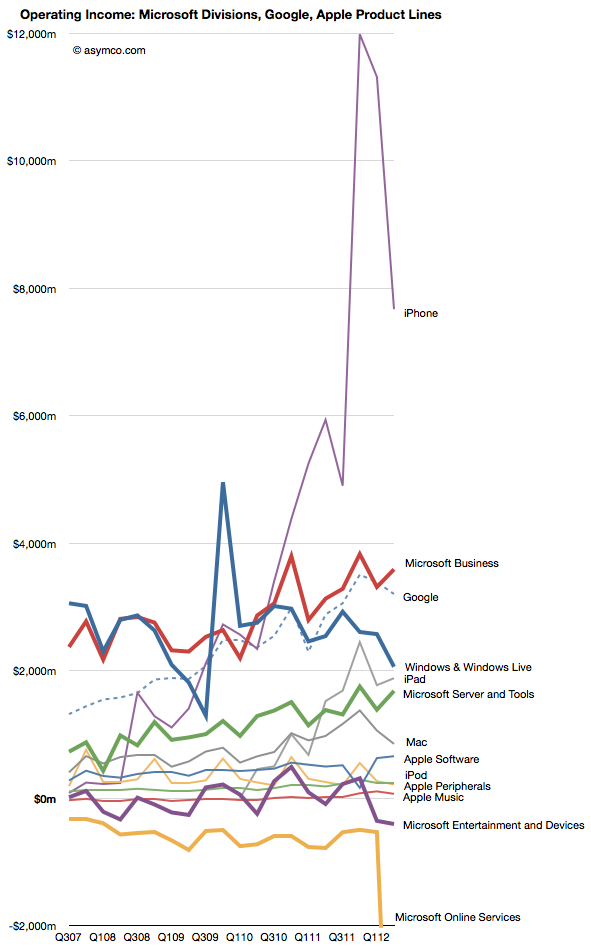
Comparing the contribution (in operating income) for each division or product line (where possible) gives the following view:
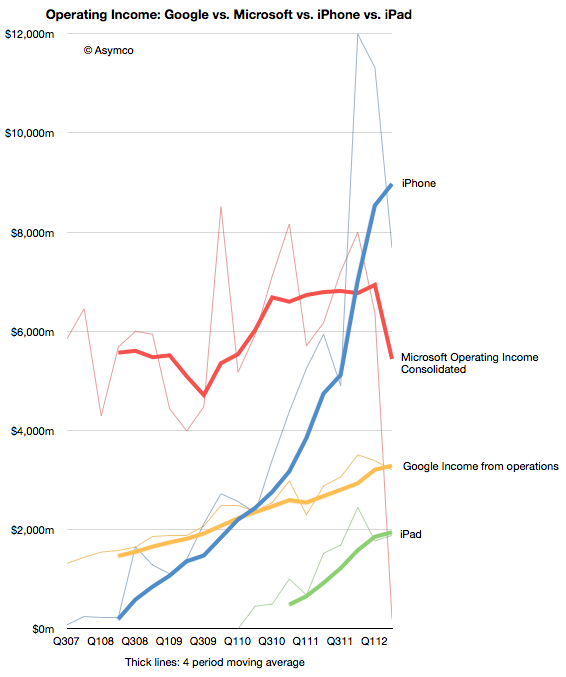
I tried to remove some noise by isolating the iPhone and iPad and consolidating Microsoft overall and Google.
By also smoothing out seasonality with a four-period moving average we can observe the pattern of growth for the iPhone and iPad relative to the other companies' overall performance.
The crucial question remains if and when the iPad will be a bigger business than Google and/or Microsoft. The iPhone climbed over both some time ago.
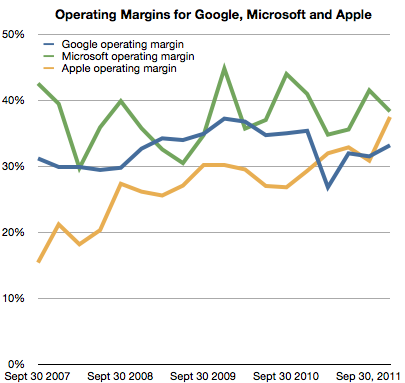
As previously noted, Apple has overtaken Microsoft (and Google) in operating margin percentage. This is an astonishing statistic as Apple is still largely perceived to be a "hardware company" while Microsoft is a "software company" and Google is a "services company."
To suggest that "hardware" could be more operationally profitable than either software or services is akin to heresy in technology analysis. This reversal is newsworthy indeed. However, even the most casual observer would note that Apple does not derive its market power from hardware alone. It is, in fact, an integrated hardware, software and services company (with a few more roles besides.)
So the emergent successful business architecture in this technologically transitional period is of integration and completeness of solutions.
This shift explains at least at a conceptual level Microsoft's tectonic Surface shift.
But what about another point of view? What does integration mean for Microsoft's income, cost and profit structure? Is integration self-disruptive to Microsoft?
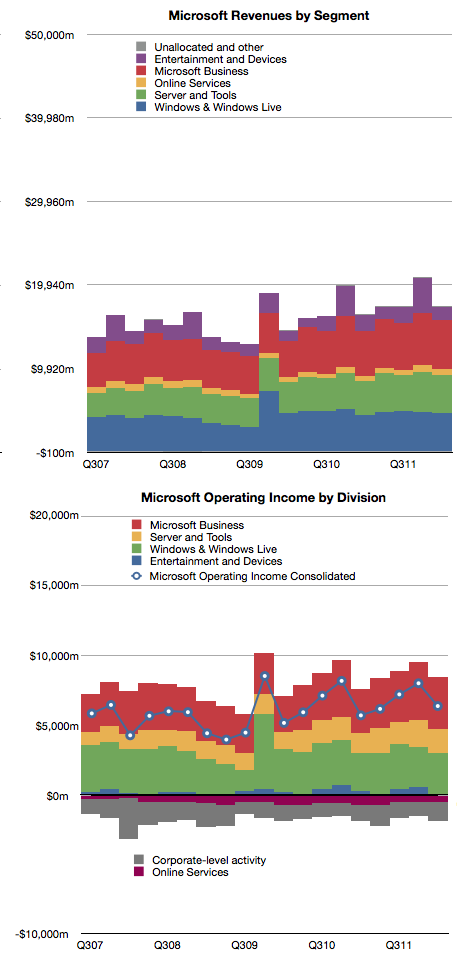
Here's a reminder of Microsoft's revenues and operating income by division:
The challenge of devices for Microsoft is that the licensing of software for devices is very difficult to sell.
In 2011 Microsoft received about $18.7 billion in Windows revenues and $23 billion in Office revenues. The chart shows that this is a fairly steady growth business. According to Gartner, in 2011 there were about 336 million Windows PCs sold and that this too is a fairly stable and mature business.
If we simply divide revenues by PCs sold we get about $55 Windows revenues per PC and $68 of Office revenues per PC sold [1]. The total income for Microsoft per PC sold is therefore about $123. If we divide operating income by PCs as well we get $35 per Windows license and $43 per Office license. That's a total of $78 of operating profit per PC.
Now let's think about a post-PC future exemplified by the iPad. Apple sells the iPad with a nearly 33% margin but at a higher average price than Microsoft's software bundle. Apple gives away the software (and apps are very cheap) but it still gains $195 in operating profit per iPad sold.
Fine, you say, but Microsoft make up for it in volume. Well, that's a problem. The tablet volumes are expanding very quickly and are on track to overtake traditional PCs while traditional PCs are likely to be disrupted and decline.
So Microsoft faces a dilemma. Their business model of expensive software on cheap hardware is not sustainable. The future is nearly free software integrated into moderately priced hardware.
For Microsoft to maintain their profitability, they have to find a way of obtaining $80 of profit per device. Under the current structure, device makers will not pay $55 per Windows license per device and users will not spend $68 per Office bundle per tablet. Price competition with Android tablets which have no software licensing costs and with iPad which has very cheap software means that a $300 tablet with a $68 software bill will not be competitive or profitable.
However, if Microsoft can sell a $400 (on average) device bundled with its software, and is able to get 20% margins then Microsoft is back to its $80 profit per device sold. This, I believe, is a large part of the practical motivation behind the Surface product.
The challenge for Microsoft therefore becomes to build hundreds of millions of these devices. Every year. Sounds like they need a Tim Cook to run it.
---
Notes:
Microsoft accounts for revenues using deferrals due to Software Assurance pre-payment models for many corporate customers so this figure is not a precise value for each license sold.
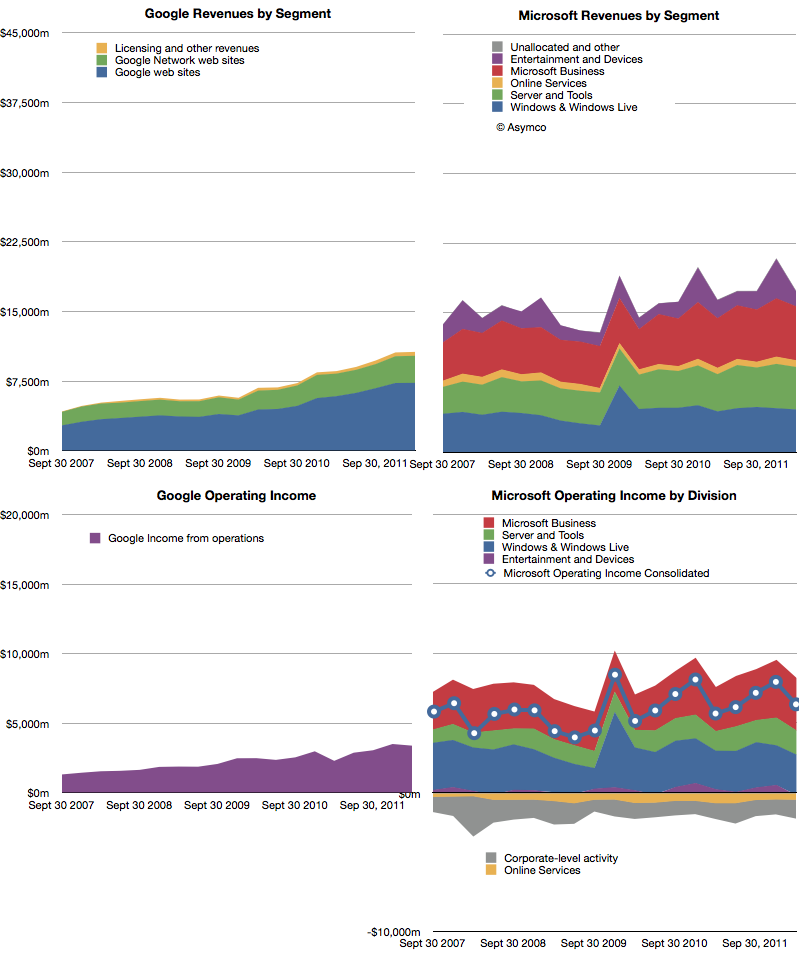
The following charts show Google and Microsoft revenues and operating income:
Both companies showed healthy growth. Revenues: Microsoft 6%, Google 24%. Operating Income: Microsoft 12%, Google 48%. Google had a particularly weak margin Q1 2011 so its income growth appears very strong.
The surprise in Microsoft's performance was the 4.8% increase in Windows revenue at a time when PC sales were expected to be declining or flat. Final PC numbers are not yet out so we'll have to check back on this figure to see whether Microsoft has been able to get higher pricing for Windows or whether the market did expand. (Average revenues per PC sold have been quite steady for years). Overall, Microsoft's business shows consistency. Of course, that should not be cause for comfort. Nokia had remarkable consistency until it jumped from a burning platform and RIM grew more rapidly until its platform imploded.
As Google still obtains 96% of its income from advertising, it's quite remarkable that it is now at 61% of Microsoft's revenues. Google is also growing more rapidly than Microsoft so the possibility exists that the top ad service will overtake the top software company in revenue, establishing a new benchmark for how software can be monetized.
The curious thing about both of these companies' financial performance is that mobility does not appear to have had any impact on either top or bottom lines[1]. There is no business division or income statement line that can be attached to mobile revenues. Microsoft placed Windows Phone under Entertainment and Devices but that division is dominated by Xbox and accessories. Google bundles everything under Advertising and has never broken out mobile, much less Android-derived income.
The surge in valuation for mobile-focused startups seems to leave investors in both these companies unaffected. The damnation for both companies lies in mobility being non-core businesses whose strategies center on reaction and defense.
---
Notes:
Google does not answer specific questions about the impact of mobile on their business but they do acknowledge that there are traffic acquisition costs (TAC) associated with OEMs and Carriers who deploy Android. This means that there are costs of mobile sales (i.e. Search) but not to any measure of specific value.
Charles Arthur, writing for The Guardian, has noted that court filings seem to be revealing Google's Android revenues. If this is the case, we have a significant breakthrough in understanding the economics of Android and the overall mobile platform strategy of Google.
The new data is a reference to a settlement offer Google made to Oracle of $2.8 million and 0.515% of Android revenues on an ongoing basis. The key assumption to make this data useful is that the $2.8 million offer represents 0.515% of revenues to date.
In other words, that revenues from 2008 to end of 2011 multiplied by 0.00515 results in $2.8 million. That implies that revenues from 2008 to 2011 were $544 million.
I think that's a fair assumption. I don't see why Google would offer a higher or lower royalty rate for years 2008 through 2011 than for years after 2011. The offer would seem to be 0.0515% in the future as well as retroactively in the past.
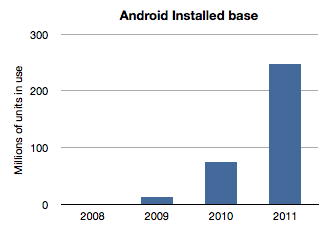
If we work with this assumption then the next question is how to distribute this $544 million over the four years 2008 through 2011? The installed base of Android has grown exponentially and it would seem logical to assume that revenues have followed in a similar pattern. Here is a chart of installed base given activation data supplied by Google.
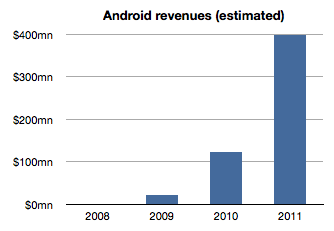
If we assume revenues were distributed the same way we would get something like this:
The sum of the bars in this chart equals $544 million and the ramp is approximately the same as the installed base. The relationship between the first graph and the second is a multiple equivalent to the revenue per device.
Therefore a second assumption is that revenue per device remained fairly constant. In this model the revenue comes out to be about $1.70 per device per year. It's possible that rev/dev/yr. is increasing as Google services are discovered by users. It's also possible that the rev/dev/yr. is decreasing as later adopters are less likely to engage as early users. I just don't know how to adjust this value so by leaving it at the average, I can avoid introducing more assumptions.
Now we can stop and look at this figure and do a test. Does $1.70 make sense as a device revenue for Android? Google had spoken about targeting $10/device/yr. but we have no indication that they are nearly at that level. If they did achieve that level, with an installed base of 300 million, Google could be collecting $3 billion a year in Android income. Are they getting it?
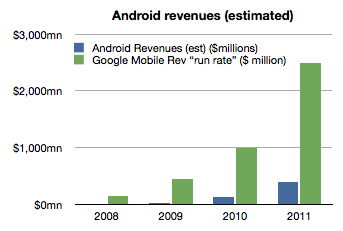
As of October, Google mentioned that it had a $2.5 billion "mobile run rate". But we know that this figure is not only from Android. Mobile includes all mobile devices and services including those running inside iOS, Symbian, BlackBerry, Windows Phone, etc. They could be counting ads on all mobile browsers as well as ads running inside all apps on all platforms. Furthermore, Google also testified that iOS accounts for two thirds of their mobile search revenues[1].
Adding run rate to the Android revenue chart results in the following:
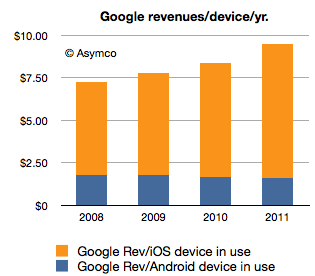
So the step is to take the "run rate" figure of $2.5 billion and assume, as Charles Arthur did, that iOS income is what is left after taking out the Android part[2]. I also noted that Google previously mentioned a run rate of $1 billion and I will assign that run rate to 2010 and $2.5b to all of 2011. Since we know the number of iOS devices in use for years 2010 and 2011 we can calculate Google's revenues per iOS device in use.
If we thus combine all the data we know (revenues derived from settlement offer, units in use, run rate and iOS installed base) we get the following revenue profile:
This shows a positive trend for Google: revenues per smartphone per year is increasing. However, the growth is coming from non-Android devices which means mostly iOS. Revenues per device for Android is probably declining.
The story for iOS revenues however is not all rosy for Google. Google has to pay for that revenue. The mechanism is a payment that Google makes to Apple for the prominent and default placement of Google search on Safari.
We don't know the terms of the arrangement but if we assume $2/device Google needs to shave $2 from the top of the chart above with that money going to Apple (attached as iPhone/iPad service revenues.)[3]
That still leaves a healthy $8.33 in 2011 as operating income from mobile with $1.70 or so coming from Android.
However, to make this operating income into bottom line profit, we have to extract the R&D and SG&A associated with mobile at Google. This would be, therefore, Andy Rubin's yearly budget.
Andy Rubin has stated in the past that Android is profitable. That is certainly believable. The budget would have to be about $400 million/year in 2011.
Charles Arthur concluded that Google obtains four times more revenue from iOS than from Android. My estimates indicate that in 2011 the revenue ratio was closer to 5 but if we subtract the cost of those sales in the form of payments to Apple then the ratio could well be four to one.
Many of these figures begin to "hang together" as we balance assumptions about costs, revenues and statements made in public. There is a consistency within a comfortable margin of error. If that is the case, then the economics of Android begins to take shape.
My take is that it's not a bad business. But it's also not a great one. As long as there is exponential growth in units, Android will improve its position inside Google relative to iOS. But from Google's perspective, iOS is today a bigger business. And iOS is not standing still. It's growing not only in terms of units but in revenue per unit.
Strategically, and historically Android was never one thing. P&L considerations were not the only (or even at all) factors in investment for Google. Having a hedge against hegemony of potential rivals, having a means to learn and develop new business and having a role in defining the post-PC computing paradigm are all probably bigger considerations than profitability.
So in terms of returns, Android is sustainable. However, in relative terms the value created leaves much to be desired. Whereas Android generates $1.70/device/year and thus an Android device with a two year life generates about $3.5 to Google over its life, Apple obtained $576.3 for each iOS device it sold in 2011[4]. The economics of Android are nothing like the economics of iOS.
---
Notes:
This figure is also not conclusive as search is not the only form of revenue on a mobile device but it does imply that Android is not the majority of Google's mobile revenues.
Clearly this is overstating iOS as the non-Android income is broken up between several platforms. We can only say that iOS is the vast majority of non-Android income.
Assuming a $2/device payment model means Google paid $312 million to Apple in 2011 and $171 million in 2010. This would go toward boosting Apple's revenue per iOS device. Naturally, if this distribution cost is higher or would be subject to re-negotiation then it could vary widely.
The iOS figure includes accessories and licensing of trademarks but excludes income from App Store, iTunes music, movies, TV shows, iBooks, greeting cards or textbooks.
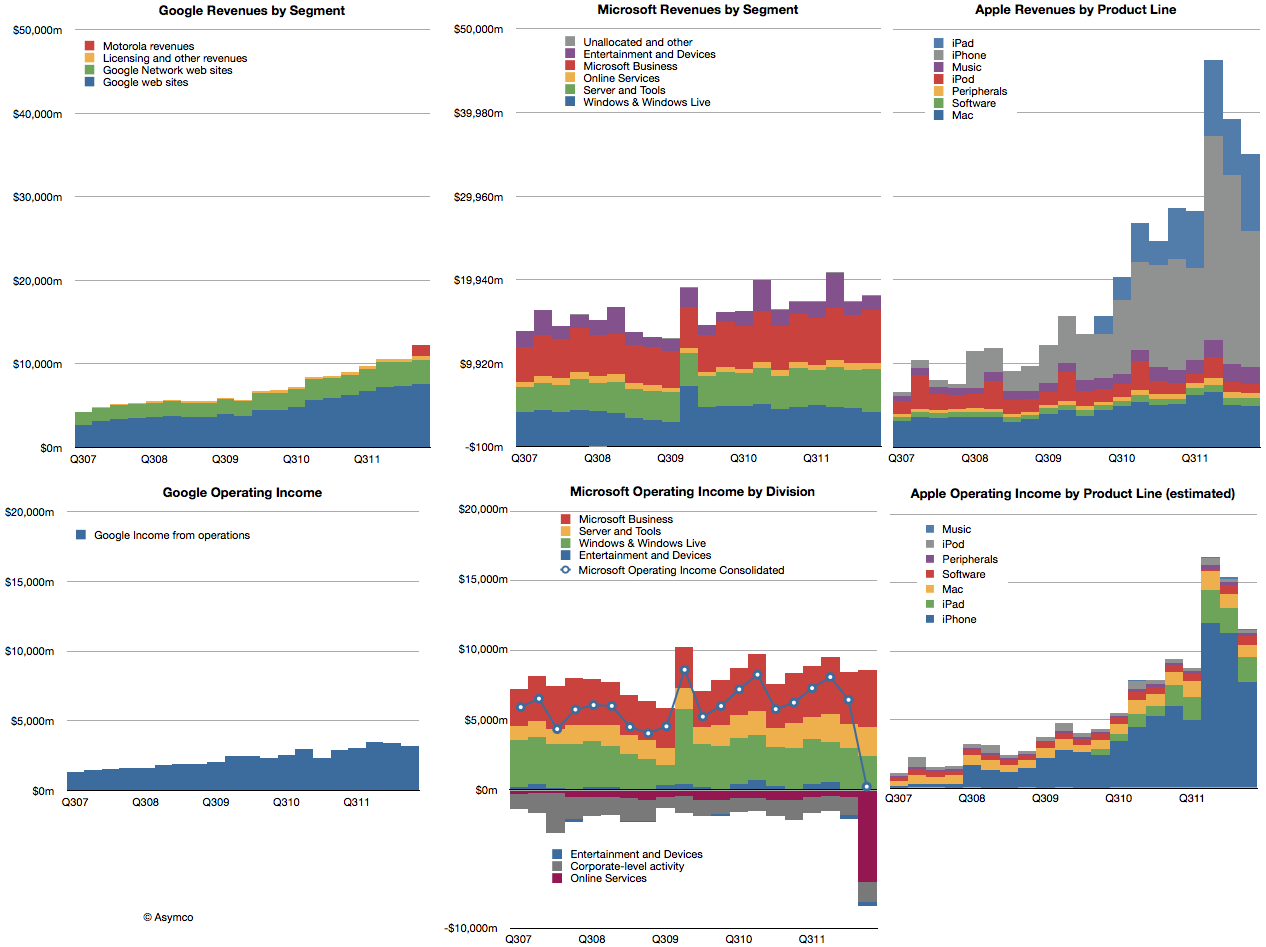
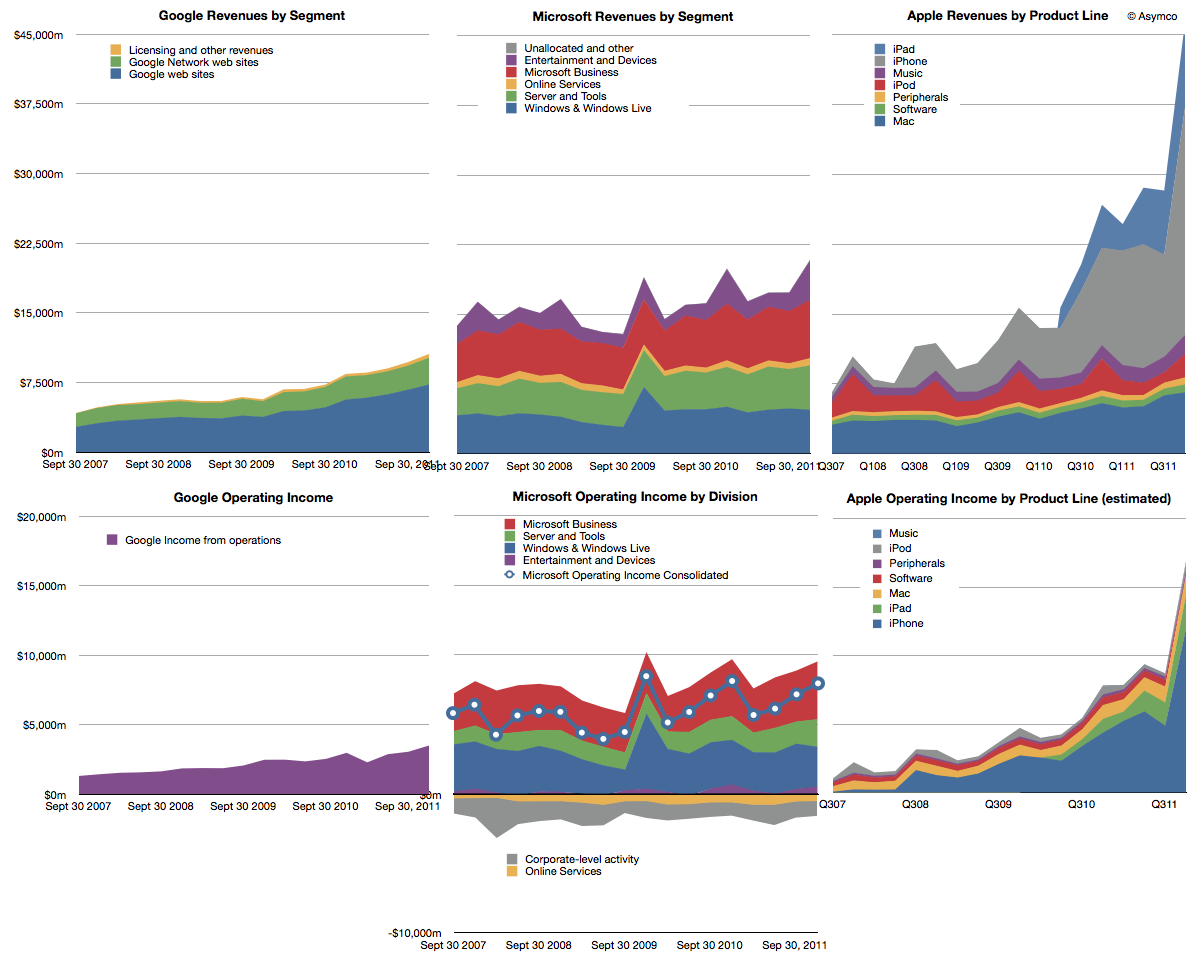
Last year we began offering revenue and operating income comparisons between Apple and Microsoft. It was becoming evident that the iOS franchise was beginning to overtake both in revenue and profitability the Windows franchise. To offer more dimensions of comparison this time I am adding Google's top and bottom lines for comparison (click image for detail):
Note that the graphs have the same scales when read horizontally. I've broken out the sub-divisions of revenues as the companies report them. Here are some observations:
The time spanned is 4.5 years (September 2007 to December 2011)
If we compare the fourth quarter 2007 to fourth quarter 2011 the ratio of Google : Microsoft : Apple went from 1: 3.39:2:16 to 1:1.97: 4.38. In other words, Microsoft was 3.4 times bigger than Google but today it's only about twice. Apple was twice and is now about 4.4 times bigger.
In terms of operating income (i.e. before R&D, SG&A and OI&E) the ratios were 1:4.48:1.53 and are now 1:2.28:4.82. Microsoft's income gap to Google halved while Apple's more than tripled.
Google and Microsoft have grown but not by adding new sources of revenue. Apple grew its base but, more importantly, added new businesses for spectacularly more growth.
Compared to Microsoft and Apple, Google's revenue is distinctly single-source: advertising. Though divided between own sites and those of affiliates, advertising is today 96.1% of revenue and was 98.6% four years earlier.
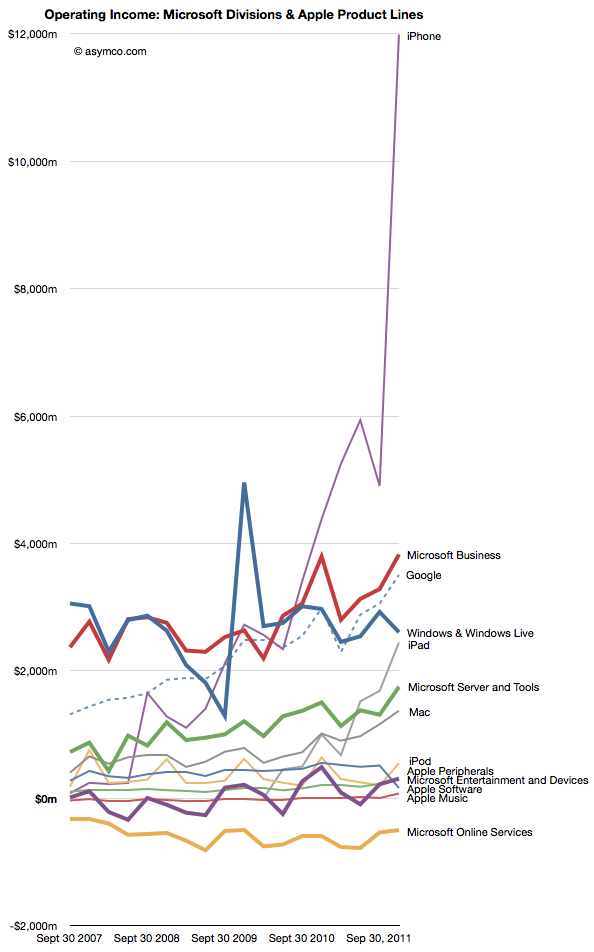
If we compare the individual product/business operating incomes individually we see some interesting patterns:
Google's advertising profits have overtaken Windows as has the iPhone and the iPad may do so quite soon.
Microsoft's Business (Office) and Server businesses are growing more quickly than Windows
The hardware oriented Apple' operating margin is now 37% and exceeds Google's 33% while being nearly equal to Microsoft's 38% (see chart below)
I presented a subset of this material January 30th at a TechMeetups event titled "Apple - world's biggest startup." A presentation by Adam Lashinsky focused on the cultural and procedural aspects which highlight Apple's "startup" nature. My presentation showed, using these graphs, Apple's growth characterizes it as a "startup". The growth did not come from a broadening of its core products markets. It came from the creation of new product categories. Google, a much younger company does not exhibit this non-secular growth any more than Microsoft which is about as old as Apple is.
The lesson is perhaps that rapid growth is not the right of small companies alone. Apple has used disruptive innovation to transform itself and offers a stunning contrast to two other companies which are also seen as innovative leaders.
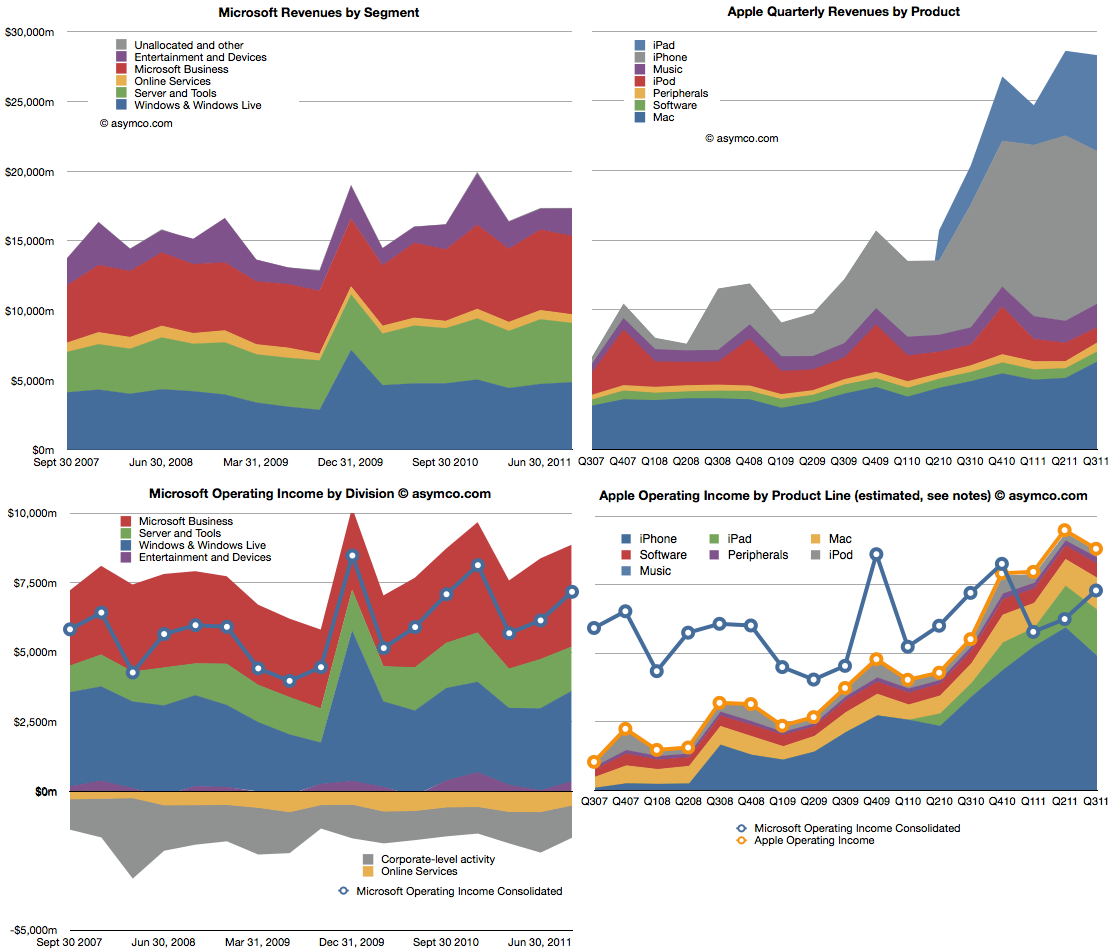
Microsoft is a stable business. Apple isn't. The following charts compare the two. The two charts on top show revenues, subdivided into product lines. Microsoft is on the left and Apple on the right. Note that the vertical scales are the same (zero to $30 billion/quarter).
The lower two charts show operating income by division/product line. The left is again Microsoft with the line showing the consolidated income (net of losses). The right chart shows the stacked areas of profit from Apple's product lines with the yellow line shooing consolidated income. I copied the blue line from the Microsoft chart for a more direct comparison.
Apple continues for the third quarter to have higher operating income and for the fifth quarter maintaining higher revenues.
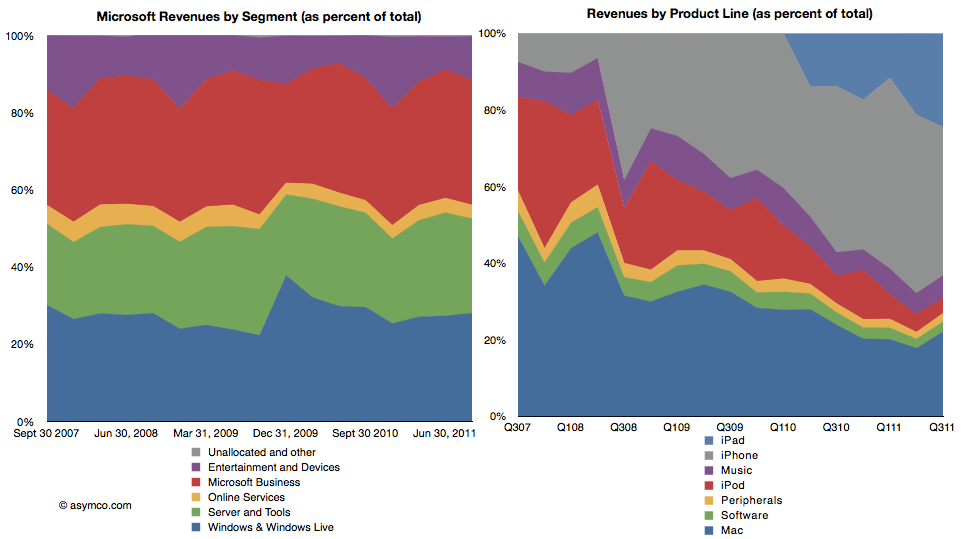
The following two charts are also another way to view the two companies. As percent of total, how do the product/divisions stack up? The first is Microsoft revenues as percent of total and the second shows the equivalent for Apple.
This comparison I think is most evocative. The stability of Microsoft is contrasted with the dramatic change that Apple is experiencing in the same time frame.
There is a dramatic shift of focus from traditional computers (Mac) to devices. If profit is an indicator of where resources are being allocated, then there is no clearer visualization of the difference between the two companies' strategies.
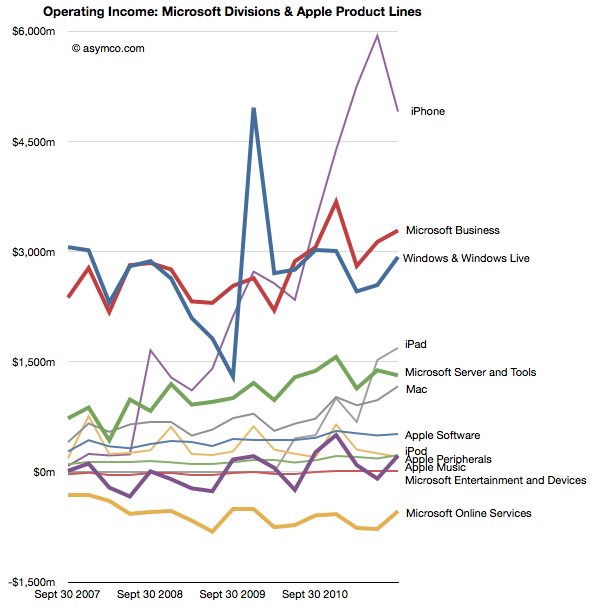
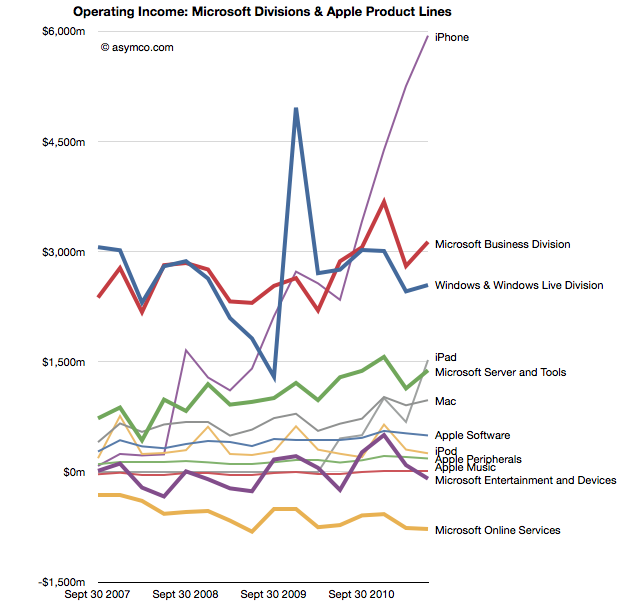
The following is a mix of all products/divisions operating income in one dense line chart (thicker lines are Microsoft divisions, thin lines are Apple products).
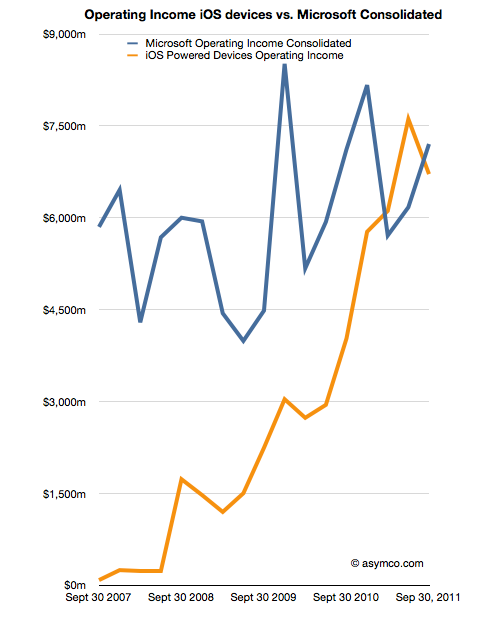
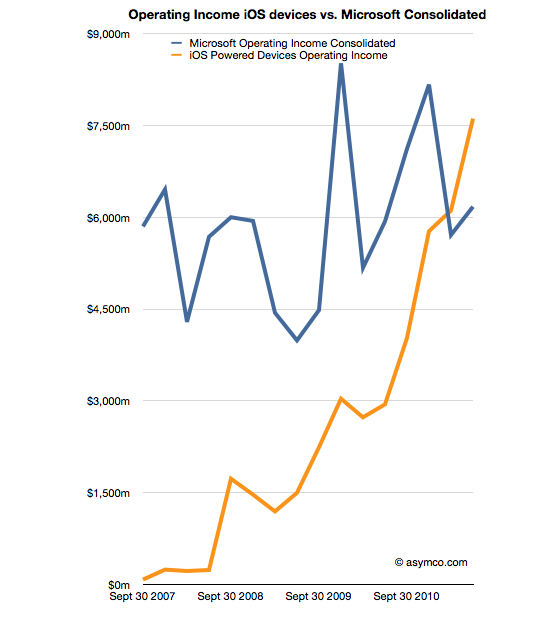
Finally, the comparison of operating income of iOS devices vs. consolidated operating income from all of Microsoft's businesses.
As iOS shifts into its fifth iteration my guess is that Apple will continue its growth trajectory. As Microsoft continues to adapt or protect its businesses from tablets and mobiles, will they grow? If so, how? Microsoft has shown consistency, but that is becoming less and less desirable.
In his third “The Critical Path” podcast, Horace Dediu explained how Apple’s cash can be viewed as a strategic option, an opinion that resonated also with other analysts [1]. Cash is one of the most flexible resources as it can convert quickly into other resources such as brands, companies, technologies, people and even processes. More cash means more strategic flexibility. The large cash reserve Apple has accumulated provides high flexibility for future investments. These characteristics of cash already imply an intrinsic option value. But how big is this value?
Calculating Option Value
To help us determine, I will apply the Black-Scholes model. The model has two key characteristics that are applicable to valuing the option character of Apple’s cash. First, the simple form of the calculation excludes dividends and, as far as we have seen, there is no new information available that would suggest that Apple will pay dividends in the near term. Second, it implies that the option can be exercised at any given time until the end of the option exercise period - just like any buying or investment decision made by consumers. Lastly, we will assume that Apple’s cash (including short-term and long-term cash as well as financial investments) is instantly available. Although large amounts are held by foreign subsidiaries or are invested in maturities longer than one year, we can overcome these practical issues by borrowing against it. As we are interested in the value of the whole pile, we use the latest reported figure of $81.6 billion as the strike price (or exercise price).
What other inputs do we need to determine the option value of Apple’s cash [2]?
Volatility: A measure that determines financial risk of a certain asset. Apple’s share has shown a volatility of 26,1% over the last year.
The risk free rate determined by the 10 year US governmental bond interest rate: 1,96%.
A timeframe in which the option can be exercised. Let’s assume a 10 year timeframe in line with the risk-free rate and an imaginable horizon for mere mortals.
The value of the underlying (or what Apple is investing in):
The return of the investment exercised with the cash at hand should yield a higher Return on Capital Employed (RoCE) than previously achieved to increase shareholder value. On the other hand, such a high cash pile also provides the flexibility to invest into lower return ventures. Such an investment would be taken if a certain technology or trend has been missed by management or becomes suddenly more important in the priorities of the company. In defensive moves or moat creating ventures, the expected return would be significantly lower or can even be negative. For the last twelve months, Apple has returned 106% in terms of operating income over its capital employed [3]. I use the return to value the underlying. For example, investing $81.6 billion in assets that yield 106% return equals a underlying value of $168 billion.
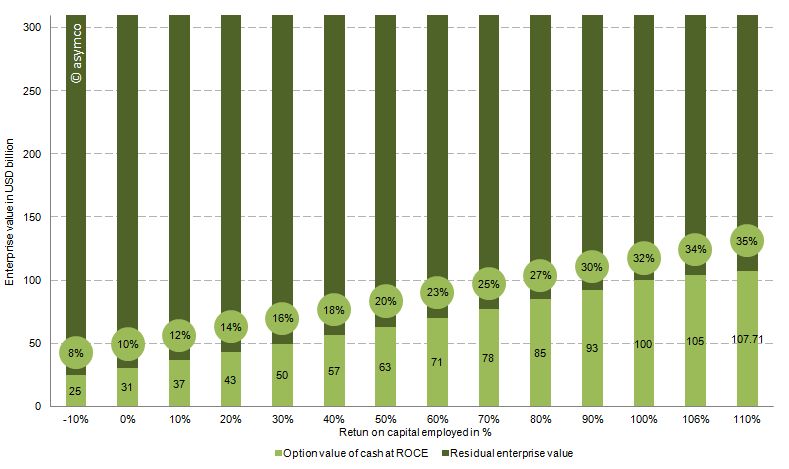
The chart below shows the option value of the cash as a percentage of enterprise value of Apple (at the time of writing $310 billion) based on the range of the expected return on capital employed. Or in other words, how much of Apple’s current value is explained by the option value in holding such a large cash reserve.
Conclusion
Therefore, with the assumptions above and a RoCE from -10% to 110%, between 8% and 35% of Apple’s current valuation is explained by the option value of cash. We can see that even with large variations of the key input variables, Apple’s enterprise value is partly explained by the option value of cash which, in turn, is attributable to the sheer amount of cash at hand.
If we look at the option value explaining 25% of Apple's enterprise value then 75% or $232 billion is the "Residual Enterprise Value" (REV) representing the value of Apple's cash flow generating operations. That puts Apple's valuation at 6.9x REV/EBIT 2011 or 6.5x REV/EBITDA 2011 -- fairly low relative to recent performance. EBITDA and EBIT have been growing at a rate of 70% for the last two years and at a rate of 84% over the last year alone.
It’s good to be king (http://5by5.tv/criticalpath/3) , Apple: Behold The ‘iEndowment,’ Says Wedgewood (http://blogs.barrons.com/techtraderdaily/2011/09/20/apple-behold-the-iendowment-says-wedgewood/)
Operating income of the last twelve month of 33.8 USD billion divided by capital employed of 31.8 USD billion defined as total assets minus cash (or sum of all asset excluding cash)
I began comparing Microsoft and Apple's financial performance with a review of "top line" or revenues by product lines over a four year period.
This post is about the "bottom line" for the same companies and products.
Before I jump in I would like to make sure there is no confusion about the terms. I will be comparing "operating income"[1] as a measure of "bottom line". This is a common way to compare the profitability of companies because it excludes taxes and interest income. These non-operating expenses/income can distort a comparison of performance because they can be the result of investment activity or changes in tax law or where the company is domiciled. One should not make judgements of comparative performance on those non-operational bases.[2]
Another challenge is that some companies report operating income by division while others don't. We can usually compare overall operating income but usually not on a division or product-level. This is the challenge I will try to overcome in this analysis between two very different operating models.
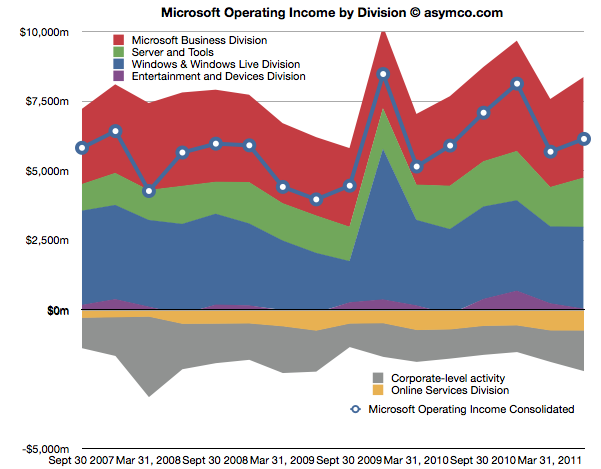
The first chart shows Microsoft's Operating Income by Division as reported by the company.
Each area represents a business division. Note some are showing negative income (losses).I've added a line representing consolidated operating income which is the sum of all areas (including the negatives).
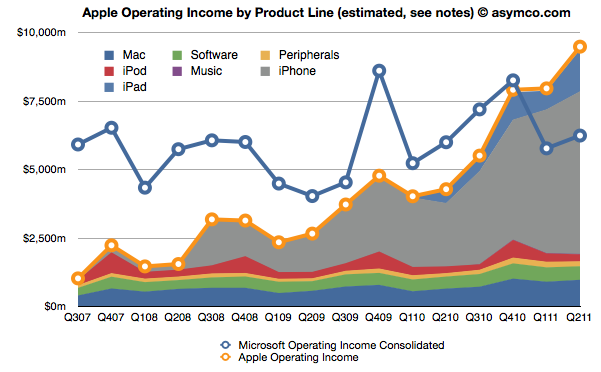
The same line from the chart above is super-imposed on the chart below and is comparable to the orange line that represents the operating income that Apple was able to obtain over the same time frame. Note that both axes are using the same scale.
The Blue and Orange lines are indisputable but the allocation of the areas under the orange line may be open to debate.
As Apple does not report a break-down of each product line or division, getting the areas in the Apple chart is a matter of analysis and estimation. The method I used was to estimate gross margins per product (the overall gross margin is known) and assigning a portion of OPEX (also known) in a ratio equal to the sales level of that product. [3][4]
To make the contrast sharper (though more cluttered), I took all operating incomes from all product lines and divisions of both companies and laid them out as time series line charts in the following chart. I allocated Corporate Level Activity as an expense proportionate to each business unit in a ratio proportional to its sales. This allows comparison of product lines individually.
Finally, I combined all the iOS product lines (iPhone, iPad and iPod touch est.) as one line and laid it alongside overall Microsoft Operating Income (consolidated).
The second chart in this post showed that Apple has reached higher operational profitability than Microsoft by the end of last year. This fourth chart shows that iOS products combined are more profitable than Microsoft as a whole.
Microsoft invented the software business and built it to become the world's most valuable business by the year 2000. It's still been growing since and after 35 years it is reaching a profit of $27 billion per year. It did this while maintaining enormous margins and a highly disruptive monopoly business model the likes of which the world had never seen before.
It is scarcely believable then that a device business has been created to overtake it in four years.
On the other hand, one should not use Gross Margins alone. The crucial difference between Gross Margin (Sales Revenue - Cost of Goods Sold or COGS) and Operating Income is that fixed costs are also accounted for. These fixed costs are typically Selling, General and Administrative Expenses and Research and Development Expenses (commonly summarized as Operational Expenses or OPEX) which can be allocated to a particular business or division. For different business models, gross margins can be widely different. In the case of Microsoft for example, software has negligible direct variable costs. A CD or download is of tiny cost compared to the price of the license to use it. As a result software often has 80% gross margins. Hardware on the other hand can have very thin margins in single digits (e.g. PCs). Conversely, Microsoft will have very high fixed costs to pay for developers, product management and sales forces. A hardware vendor may have few engineers and sales could be handled through resellers. Thus Microsoft will have very high OPEX and a PC company will have very low OPEX.
So, for example, In Q2 '11 the iPad had an estimated gross margin of $2.06 billion (which assumed 34% margin on published revenues of $6.06bn). As it also was 21% of total revenues that quarter, I assigned 21% of OPEX to the iPad. That means 21% of $2.54bn or $540 million was the operational expense allocated to the iPad. This results in operational income estimate of $1.52bn for the iPad in Q2.
To summarize, the assumptions this estimate depends on are gross margin estimates and the allocation of OPEX in proportion to sales. Gross margin analysis has been a matter of iteration and peer review for some time and I'm fairly confident in my estimates. The allocation of OPEX is more arbitrary. Chances are that these expenses vary greatly with each quarter where more work is done nearer to launch of a new product and less in late season. If there are better methods available to allocate expenses by product, I'm open to suggestion.