Asymco

Asymmetric Intelligence

PC

  1. How many smartphones did Samsung ship in Q2?

    Research · 62 comments

    50.2 million.

    That's the estimate from IDC. So why bother asking?

    Because that is an estimate. Of the 104 million Android phones shipped in the quarter (itself an estimate from another, possibly different methodology), I could only account for 7 million actually reported. That figure comes from a close reading of an investor presentation from Sony. HTC does not report their shipment numbers. It stopped some time late last year. Neither does Motorola now that it's a part of Google. Huawei is silent except for setting targets and ZTE published a press release citing IDC's estimate of its own shipments.

    But most glaring of all is the absence of any mention by Samsung of its performance. The company stopped reporting any data on either overall phone shipments or of smartphones within that total since Q3 2011. We may have been able to estimate Samsung if we had more competitor actuals, allowing us to back into a figure. But we don't.[1]

    Which leaves us with IDC's estimate[2]. But the problem is that since the industry is growing so quickly it is very sensitive to assumptions. Consider how difficult it is for consensus estimates for Apple's iPhone shipments to come near the actuals--and that's for one quarter, and knowing all the previous quarters with precision. The absence of visibility into the assumptions made by market analysts (or their methods) should lower confidence in the results.

    Consider that IDC specifies 50.2 million Samsung smartphones, implying an accuracy down to 100,000 units. Is this accuracy believable?

    There is reason for doubt.

    I start with the following graph:
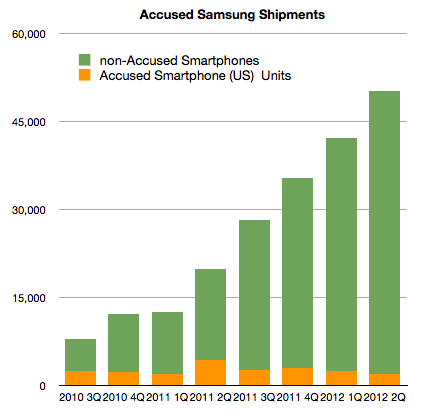
    It shows the estimates for Samsung global shipments (latter four quarters are estimates without the benefit of company reports.) I separated the component of shipments that Samsung reported as part of its submission to the Samsung v. Apple trial in California. Note that this (orange) segment consists of most US smartphone shipments. It's not all US Samsung shipments. It notably excludes the Note, the latest Nexus and the Galaxy SIII.

    Without these "non-accused" phones, it would appear that Samsung's US volumes dropped to 4% of global totals from a 10% average[3]. In order to return to 10%, the US totals would need to be adjusted as shown below:
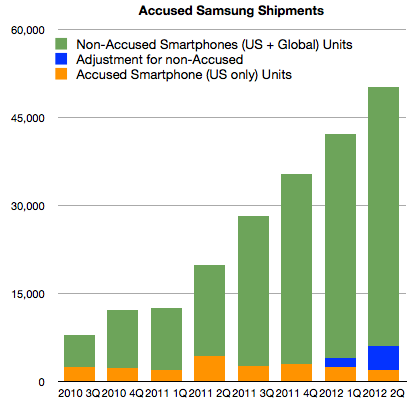
     

    I added 1.5 million units in Q1 and 4 million units in Q2 (to account for Galaxy SIII).

    So far this seems consistent with the total estimated global shipments of 50.2 million from IDC. US units would result in 12% of global shipments.

    However, there is more data we can test against. First, we are also given pricing for the US phone portfolio, or at least we have revenue per unit sold. This allows us to get an idea of what revenues can be obtained for the smartphones in the US, and possibly world-wide[4]. Knowing prices for smartphones and knowing global sales (which Samsung reports) and finally knowing global total phone shipments allows us to price the average non-smart phone.

    Excluding the non-accused smartphones, the average revenue per smartphone in the US for Samsung in Q2 was $339. Adding in the estimated Galaxy SIII (4 million) at an average price of $470 gives a new "ASP" of $413.

    This is where the analysis goes off the rails.

    If we assume the global ASP is equal to the US ASP and knowing everything else about the mix of smartphones (54% of total) and revenues (as reported) yields a negative ASP for feature phones. Assuming the revenue figure is correct, either the number of smartphones is wrong (50.2 million) or the global ASP ($413) is wrong. The total phone number is also an analyst estimate which can be called into question.

    There are many assumptions being multiplied here so I have very low confidence in the result, but we should ask "what do you need to believe" in order for the 50.2 million figure to be real. The following scenario for example has to be true:

    1. Global Samsung phone shipments total 93 million units (which means 42.8 million feature phones sold as well as the 50.2 million smartphones).
    2. 6 million smartphones shipped into the US, equivalent to about 50% increase y/y, roughly in-line with market growth
    3. 4 million Galaxy SIII shipped (but not necessarily sold through) at an ASP of $450. This results in a US total smartphone ASP of $413
    4. The global smartphone ASP is significantly lower (at 80% of the US or $330)
    5. Global revenues of $18.14 billion is essentially all from phones
    6. Global feature phones will have an average price of $36

    If these conditions are met then it's possible that 50.2 million Samsung smartphones did ship.

    The figure for feature phone ASP is difficult to accept as it would be lower than Nokia's. Also, the low global smartphone ASP is also difficult to accept but it might be possible to find a scenario with the above variables which makes the 50.2 million figure believable.

    Unfortunately this is an unsatisfying analysis. I could propose another figure to answer the question in the title, based perhaps on more "believable" assumptions. But I have no means to defend my assumptions. The only option I have remaining is to caution that the total smartphones shipment estimate for Samsung remains precarious. The new evidence from the US trial places more doubt on it but it is not enough to disqualify it entirely.

    ---

    Notes:

    1. This cone of silence over 93% of the most popular mobile platform is somewhat puzzling in contrast to the perfect information we are used to having about iOS, BlackBerry and even Symbian. It seems that the more open a platform, the less is revealed about its market performance. This extends to the licensed Windows Phone whose shipments are only revealed through Nokia's reporting of Lumia shipments.
    2. In the PC market, vendors also selectively publish their units. The norm is, however, not to. As a result IDC et. al. are the only sources for global market data. However, the PC market can be sampled more easily than the phone market. PC retail measurement methods are more reliable compared with all the points of sale for phones.
    3. Note that Apple sells about 30% of iPhones in the US.
    4. Apple's pricing world-wide is very consistent with pricing in the US which makes sense from a channel management point of view. One would not want to create incentives for cross-border arbitrage of phones.
  2. Perspective and Context in Personal Computing

    Research · 49 comments

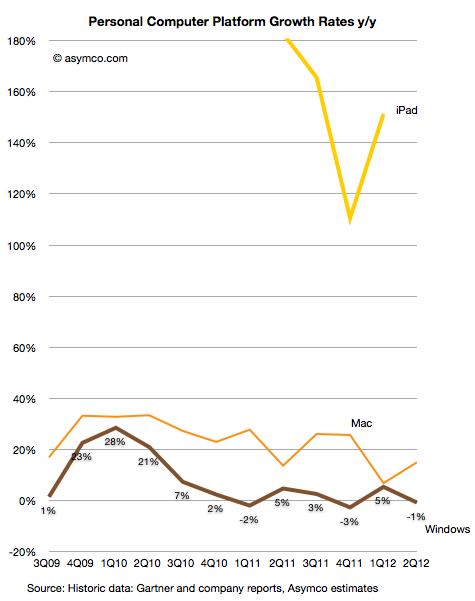
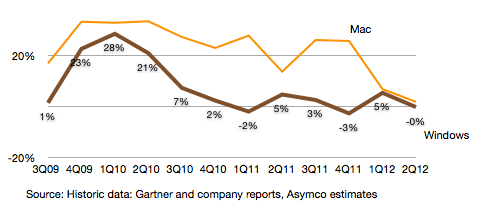
    The Mac grew at the extremely low rate of 1.8% over last year's second quarter. Although it grew faster than the Windows PC market, the gap has narrowed quite a bit. The following graph shows the growth of the two members of the computing Ancien Régime.

    We have to wait a few more quarters before we can decide whether the Mac will enter a new phase of diminished expectations. Although it's not immune from the impact of the iPad, the effect can take a long time to be evident and in either case, growth can come from conversion of Windows users which vastly outnumber loyal Mac users who might upgrade.

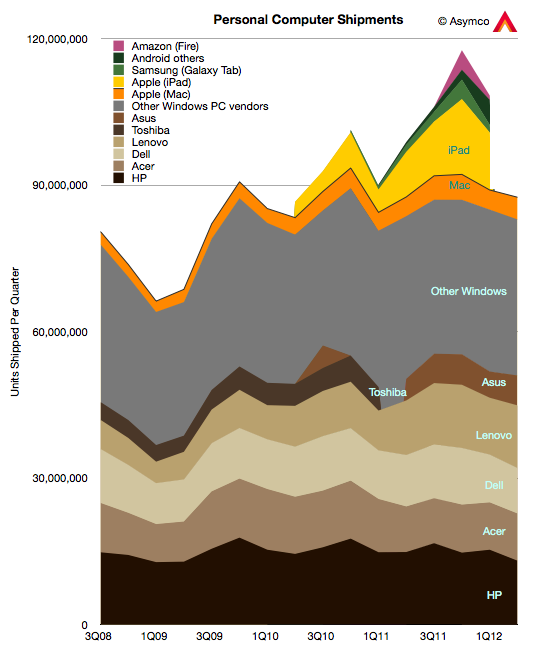
    If we see the computing market as the superset of keyboard+mouse input and touch-based input then new computing consumption becomes easier to spot:

    Seen this way, rather than there being a crisis in personal computing, we have a renaissance. And as in the actual Renaissance, it's a volatile and unsettling period.

    Nowhere more so than in the changing of bases of power. Consider the following data:

    A change in perspective leads one to conclude that Apple is the new leader in selling personal computers. Maybe this charting is putting too fine a point on it, but the data is beginning to make evident that which has been perceived subjectively by only a few.

  3. Waiting for Godot

    Research · 46 comments

    Gartner has published preliminary PC unit sales for Q2. The data from Apple's Mac sales has not been published yet but based on some estimates, we can draw a partial picture of the personal computer market.


    My estimate is that the Windows PC market fell by 1% while the Mac market grew by 15%. Gartner reports an overall flat market. I'll leave out the iPad for the time being, and show the growth of the Mac vs. Windows:


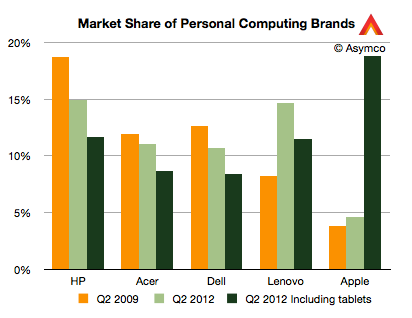
    In terms of individual vendors vs. each other, the patterns are as follows:

    It's perhaps a bit early to tell, but if the Windows PC market continues to slow or contract, it may be possible that HP and Dell will cede their market share leadership positions to Lenovo and Acer. Already "Others" account for as many units as HP and Dell put together.

    If we are to believe the analyst community reflects consensus, the industry, in the aggregate, continues to treat the potential for disruption from devices as unlikely. There always seems to be a wrinkle, a quirk, or an exceptional circumstance that is to blame. I won't get into all the excuses given by analysts for the slowing of PC sales but will point out that there's been a series of initiatives put forward by the industry to act as "catalysts" for growth. So far they have not worked. The current expectation is that Windows 8 will reverse this trend.

    Perhaps. But perhaps the relief, if it comes at all, will be temporary.

    [UPDATE: Due to a data error, the drop in Windows was overstated in the initial version of this post as 10%. It's been corrected to a drop of 1%]

  4. Building and dismantling the Windows advantage

    Research · 328 comments

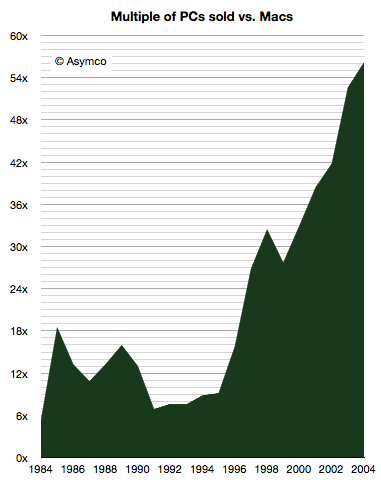
    When the Macintosh was launched in 1984, computers running the MS-DOS operating system were nearing a dominant position in the market. Having launched in 1981 as the IBM PC, they were quickly cloned and four years later "PCs" were selling at the rate of 2 million/yr.  The Mac only managed 372k units in its first year.

    In other words, PC was outselling the Mac by a factor of nearly 6. It turned out to be a high point. The ratio by which the PC outsold the Mac only increased from there.

    When Windows 95 launched in 1995 it negated most of the advantages of the ease of use of the Macintosh and the PC market took off. The ratio reached 56 in 2004 when 182.5 million PCs were sold vs. 3.25 million Macs.

    During the second half of the 90s it was already clear that Windows won the PC platform war. Windows had an  advantage that seemed unsurmountable.

    I should point out that this ratio between platforms is not just an exercise in arithmetic. It's a measure of leverage. The advantage of dominance is realized in an ecosystem which creates lock-in and additional economies in marketing. Ecosystems become self-perpetuating and there is a tendency toward monopoly. The stronger you are, the stronger you get.

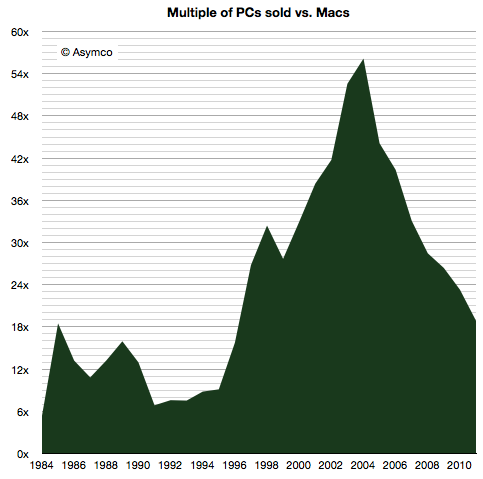
     Then, in 2004, something happened.

    Although PC volumes continued to grow, they did so more slowly and the Mac grew faster. What coincided with this was the emergence of portable computing. The MacBook became easily differentiable as a "better" laptop. It was not faster, did not have more storage or any key metrics being used to sell PCs. It was just better as an integrated product. The integration manifested itself through a sense of quality and robustness as well as intangibles like aesthetics and "feel". I wrote about this a few years ago.

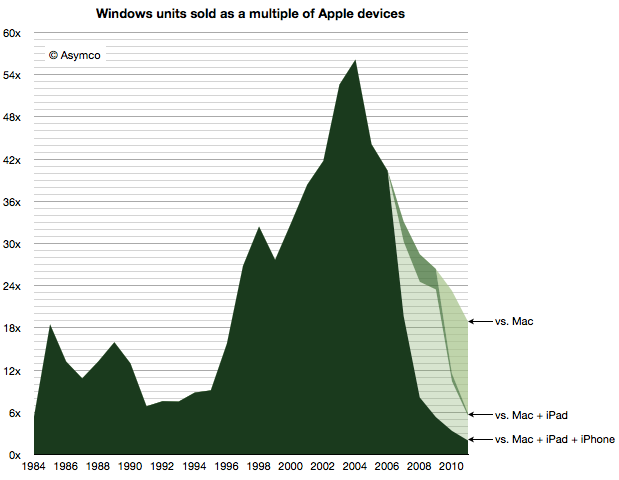
    As a result the Mac began to whittle down the advantage Windows had. The ratio  of Windows to Mac units shipped fell to below 20, a level that was last reached before Windows 95 launched. It's as if the Mac reversed the Windows advantage. This was an amazing turnaround for the Mac.

    But the story does not end there.

    If we consider all the devices Apple sells, the whittling becomes even more significant and the multiple drops to below 2. Seen this way, Post-PC devices wiped out of leverage faster than it was originally built. They not only reversed the advantage but cancelled it altogether.

    Considering the near future, it's safe to expect a "parity" of iOS+OS X vs. Windows within one or two years. The install base may remain larger for some time longer but the sales rate of alternatives will swamp it in due course.

    The consequences are dire for Microsoft. The wiping out of any platform advantage around Windows will render it vulnerable to direct competition. This is not something it had to worry about before. Windows will have to compete not only for users, but for developer talent, investment by enterprises and the implicit goodwill it has had for more than a decade.

    It will, most importantly, have a psychological effect. Realizing that Windows is not a hegemony will unleash market forces that nobody can predict.

  5. Who will be Microsoft's Tim Cook?

    Research · 88 comments

    As previously noted, Apple has overtaken Microsoft (and Google) in operating margin percentage. This is an astonishing statistic as Apple is still largely perceived to be a "hardware company" while Microsoft is a "software company" and Google is a "services company."

    To suggest that "hardware" could be more operationally profitable than either software or services is akin to heresy in technology analysis. This reversal is newsworthy indeed. However, even the most casual observer would note that Apple does not derive its market power from hardware alone. It is, in fact, an integrated hardware, software and services company (with a few more roles besides.)

    So the emergent successful business architecture in this technologically transitional period is of integration and completeness of solutions.

    This shift explains at least at a conceptual level Microsoft's tectonic Surface shift.

    But what about another point of view? What does integration mean for Microsoft's income, cost and profit structure? Is integration self-disruptive to Microsoft?

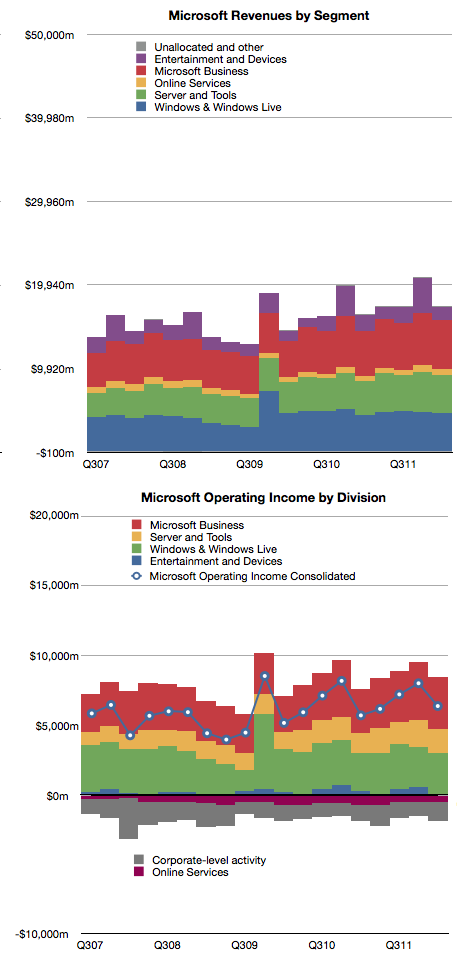
    Here's a reminder of Microsoft's revenues and operating income by division:

    The challenge of devices for Microsoft is that the licensing of software for devices is very difficult to sell.

    In 2011 Microsoft received about $18.7 billion in Windows revenues and $23 billion in Office revenues. The chart shows that this is a fairly steady growth business. According to Gartner, in 2011 there were about 336 million Windows PCs sold and that this too is a fairly stable and mature business.

    If we simply divide revenues by PCs sold we get about $55 Windows revenues per PC and $68 of Office revenues per PC sold [1]. The total income for Microsoft per PC sold is therefore about $123. If we divide operating income by PCs as well we get $35 per Windows license and $43 per Office license. That's a total of $78 of operating profit per PC.

    Now let's think about a post-PC future exemplified by the iPad. Apple sells the iPad with a nearly 33% margin but at a higher average price than Microsoft's software bundle. Apple gives away the software (and apps are very cheap) but it still gains $195 in operating profit per iPad sold.

    Fine, you say, but Microsoft make up for it in volume. Well, that's a problem. The tablet volumes are expanding very quickly and are on track to overtake traditional PCs while traditional PCs are likely to be disrupted and decline.

    So Microsoft faces a dilemma. Their business model of expensive software on cheap hardware is not sustainable. The future is nearly free software integrated into moderately priced hardware.

    For Microsoft to maintain their profitability, they have to find a way of obtaining $80 of profit per device. Under the current structure, device makers will not pay $55 per Windows license per device and users will not spend $68 per Office bundle per tablet. Price competition with Android tablets which have no software licensing costs and with iPad which has very cheap software means that a $300 tablet with a $68 software bill will not be competitive or profitable.

    However, if Microsoft can sell a $400 (on average) device bundled with its software, and is able to get 20% margins then Microsoft is back to its $80 profit per device sold. This, I believe, is a large part of the practical motivation behind the Surface product.

    The challenge for Microsoft therefore becomes to build hundreds of millions of these devices. Every year. Sounds like they need a Tim Cook to run it.

    ---

    Notes:

    1. Microsoft accounts for revenues using deferrals due to Software Assurance pre-payment models for many corporate customers so this figure is not a precise value for each license sold.


  6. The evolution of the computing value chain

    Research · 34 comments

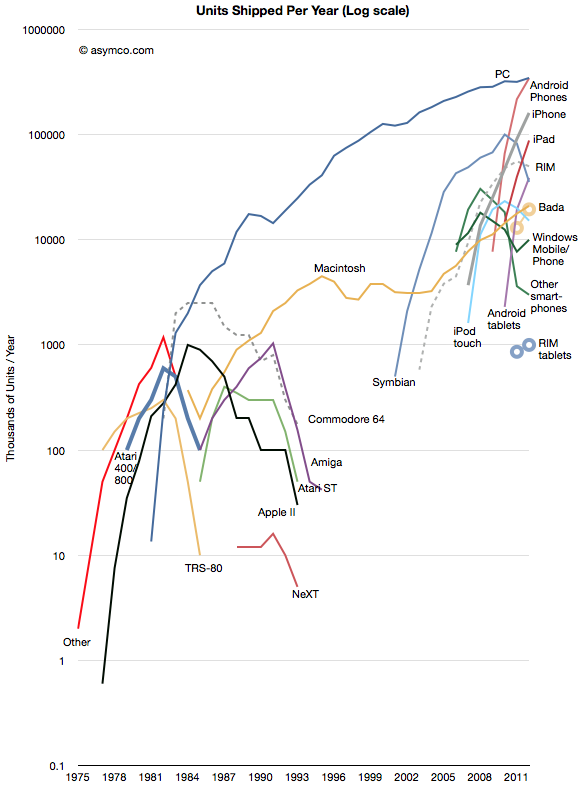
    The history of personal computing has come to be defined as the history of Microsoft. At least since 1981 Microsoft's operating systems have been the consistent market share leaders, and by a very large margin. That is about to change. This year Android will be on more devices sold than Windows. iOS is also set to also overtake Windows next year. The following chart illustrates the wave of mobile platforms that has emerged, and in spite of some notable failures, is overtaking traditional computing.

    Of course we should remember that PC themselves overtook entrenched predecessors like minicomputers and mainframes which themselves overtook business computing systems based on adding machines, typewriters and slide rules. This is the cycle of disruption and there is nothing new about it.

    However, it always seems to take people by surprise. This is because it happens in unforeseen ways and at unpredictable rates. And so it is that we are surprised by Microsoft's seeming abandonment of a business model that has sustained it for three decades.

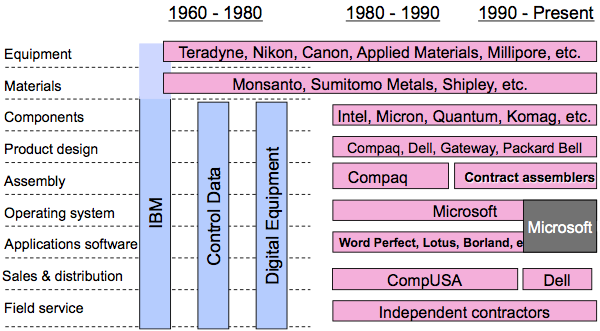
    Yesterday's reveal of Surface, Microsoft's first personal computer, was a watershed event in the evolution of value chains around computing. In a famous slide Clay Christensen illustrated (in 2004) the value chain evolution in computing from the 1960s to 2000.

    As computing moved from the desktop to the pocket the industry re-integrated. First, Apple moved from Product Design into Sales & Distribution with its stores. Then it moved into service with Genius bar. Then it moved into component design with the A series chips and unique batteries. Then it moved into materials with exclusive licensing of LiquidMetal. It also began to own the equipment used in its manufacturing. This in addition owning the operating system.

    Now we see Microsoft following in the same footsteps. First applications came early then stores, then service, and now product design. Google is also tracking closely behind as well with its acquisition of Motorola, the results of which have yet to be revealed.

    And so we can see value chains evolving in real time before our very eyes. They have always evolved but in technology industries they evolve far more rapidly and will continue to accelerate.

    Whether Microsoft or Google will be successful in their integration efforts remains to be seen. The challenges are immense as the value of the existing chains are enormous and the bonds that tie the company to them very strong. Breaking these ties will seem like value destruction and corporate antibodies will be set loose to kill the transitions. HP, RIM, Nokia and Dell are vivid examples of what happens when the response mechanisms have their way.

  7. The PC market overview for Q1

    Research · 64 comments

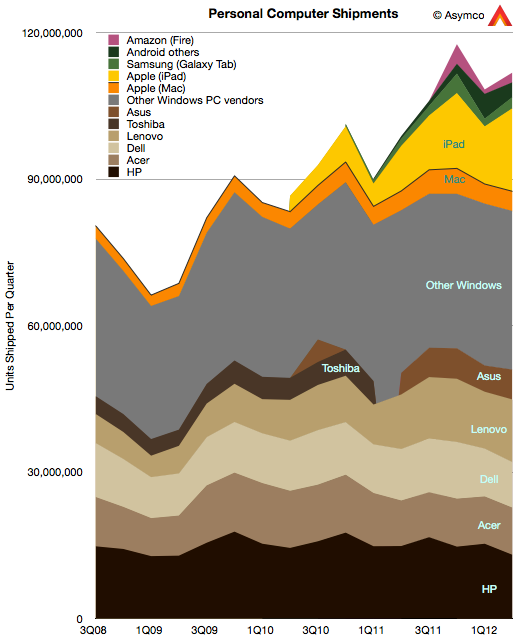
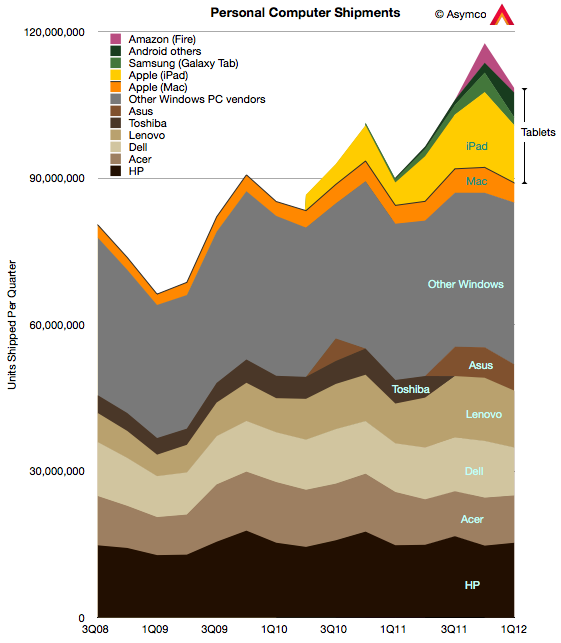
    In terms of units Windows-based computers made up 78% of all PCs sold in Q1. That was an increase from the 74% in the previous quarter but a decline from 90% a year ago. OS X based computers were about 3.7%, a decline in share both q/q and y/y, something the company attributed to a transition quarter.

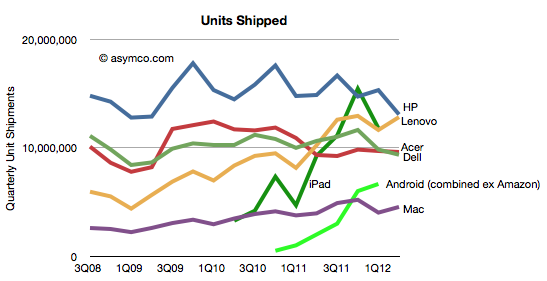
    The following chart shows the composition of vendor volumes with tablet and traditional form factor computers included:

    iOS computers (i.e iPad) were 11% of the market, declining from 13% last quarter but increasing from Q1 '11's 4.2% share. Apple reported that the iPad was not at supply/demand balance and thus could have sold more units.

    Amazon's shipments went down significantly though sell-through was perhaps twice sell-in due to inventory build-up during the previous quarter. Overall, about 5 million Amazon Fire tablets were sold since the product's launch.

    The third significant tablet vendor was Samsung, which sold about 1.6 million tablets, down sequentially but up y/y. Other Android tablets may have shipped another 5 million units.

    Overall, Apple remained the top vendor with 14.6% share, followed by HP with 14.1% and Lenovo in third at 10.7%. Dell just barely managed to beat Acer with 9% vs. 8.9%.

    The impact of the tablet (aka iPad) market is being described in the response to a significant earnings miss by Dell:

    Sterne Agee, which admits it probably shouldn't have upgraded DELL from underperform last week, says it's notable that the PC maker acknowledged competition from Apple and Google for the first time as part of Tuesday's dour F1Q report and forecast. Meanwhile, Mizuho calls DELL a "show-me-story for now" in cutting it to neutral and cutting its price target 25% to $15. And ISI snarks "everything is bigger in Texas--including the misses." It adds while the company "is making the right business-model changes...results will remain 'chained' for years (not quarters) to commodity desktops/notebooks, which comprise over half of sales."

    - Dow Jones Newswires (Kevin Kingsbury)

    And so, two years later, the impact of the iPad is becoming abundantly clear, even to the incumbents.  The resistance and denial was profound. Even on this blog, the agitation and anxiety when the subject of the iPad as disruptor came up was palpable.

    Perhaps that is the greatest testament to the disruptive potential of a product.

  8. An interview with Chris Brennan for MacUser magazine UK

    Research · 30 comments

    Chris Brennan asked a few important questions regarding potential saturation of the iPhone market.

    Is the iPhone anywhere near saturation? Can Apple continue to shift iPhones in ever increasing numbers or is a sales plateau realistically on the horizon?

    The market for mobile phones is approximately 5.5 billion connections, perhaps 5 billion users. The iPhone has approximately 300 million installed base. I consider a base of 1 billion users to be a minimum for continuing participation in this market long term. Licensed platforms will reach this in no more than two years. I don't know what Apple's ambitions are but if they don't triple their base I don't see a strong future for the company in mobile phones. In order to triple the base the company will need to sell substantially more than an additional 700 million iPhones. The retirement rate can be as high as 50% of installed base. Apple will need to sell at least 1 billion iPhones in the next few years. Seen another way, Apple has a market share of about 9% on a quarterly basis. This needs a lot of improvement. Chinese vendors are not standing still.

    Can the Mac also continue to outperform the rest of the PC market for long?

    The PC market is in decline. It will continue to decline as its disruption continues. The PC market will still exist 10 years from now but, similar to the mainframe market, it will be hard to notice. Apple is doing a fine job carving out a large portion of that market for itself but overall it's an increasing portion of a decreasing pie. It would be better to track the share of profits captured or even share of value rather than units. The reason units were important 20 years ago was because platform dynamics determined whether a marginal platform could survive. Would a 5% share be enough to attract developers? That is no longer an interesting discussion. Applications for PCs are not an area of investment for any significant pool of capital. Development has moved almost entirely into mobile or web. Therefore, as the PC is now a commodity product, the best performers are those who can capture a larger margin. Those margins should be subsequently be invested in new platforms. PC vendors who neither capture margin, nor invest in new platforms are strategically insolvent.

    Finally, this exponential growth of Apple products has to end some time soon doesn't it? How many high-income buyers for expensive products can there be left for Apple to target?

    Trying to calculate the limits to growth is futile. There are limits but they are not calculable and inaccurate estimates don't offer any useful information.

    In 1939 a total of 921 military aircraft were built in the United States. Five years later, in 1944, annual production was 96,318. A question could have been asked by an aviation analyst in 1939 about whether the American aircraft industry could grow. Aircraft, especially multi-engined ones used by the military were _extremely_ expensive. The reason an industry grew exponentially making extraordinarily expensive products was not because of organic demand but because the primary buyers engaged in a cataclysmic global war. In other words, there was a will to buy and hence there came a way to build. Therefore the answer to the question of sustainable growth comes not from an analysis of demand but from an analysis of the consequences of not growing. Not growing would have meant the end of many nation states.

    Your question was framed by an implied market categorization: that buyers are either high-income or, presumably, low-income. This is a false dichotomy. Buyers are either needful of a job to be done or not. If the job is important enough, money will be found to hire a product. Sellers of products will also find ways to meet the demand through lower prices and increased capacity. Every product Apple makes used to be out of the reach of all consumers. Whether computers (portable or not), music players and professional grade software, voice recognizing personal assistant cellular phones and tablets are all luxuries or necessities is only a question of timing.

  9. An interview with Kenney Ho of The Chosun Daily of Korea

    Research · 21 comments

    Kenney Ho, a staff reporter from Korean newspaper The Chosunilbo (The Chosun Daily) sent me a set of delightful questions.

    According to Kenney, The Chosunilbo "has a history of 90 years, has been the most dominant, and influential paper of all time in Korea. It is the No.1 newspaper company in Korea with more than 1.8 million circulation, firmly holding the largest market possession. The paper is recognized Asianwide, where there are many readers in Japan and China."

    -You said "All mobile device vendors experiencing losses are not likely to really recover". Even though, it wouldn't mean that the employees, executives of Nokia has completely nothing in hands for recovery. If you are the CEO of Nokia right now, What are your steps to make Nokia recover its deficits?

    My statement was based on the historic data which shows that 14 phone vendors have either exited the business or lost their independence during the last decade. No vendor that has reached a period of prolonged loss making has recovered. These are just observations and it's possible that Nokia may be the first to recover. However, going by the patterns of the past, it would be very unlikely. When I thought about the reasons why companies have not been able to recover I came to the second observation about the way phones are sold. Once a brand reaches a point where it's considered "risky" for distributors and operators to range they tend to defer purchases which leads to a spiral of continuing losses and more damage to the brand. The market amplifies "distress" and recovery becomes impossible.

    If I were the CEO of Nokia I would set course for turning the company into a new business. I would approach the market asymmetrically and not try to compete directly with the other vendors. I would look toward services, platforms and software solutions and de-emphasize hardware.

    -Many experts say that because Nokia dominated phone making industry in the 2000s, they maintained a corporate culture of complacency, which led them to decline. Do you agree with this? If you agree, Can you point out the examples of Nokia's complacency?

    Complacency would mean that Nokia would not invest or try new things. This is not quite right. The company invested in software, services and platforms. It tried many new things and had a large R&D budget. It was the leader in mobile software for many years. There was, however, a culture of arrogance about their position. This meant that they did not think the basis of competition would change. They thought they were too big to fail. They did not challenge the core business model of hardware-first and try to find an internal disruptive business.

    -Experts note that Nokia should have reacted directly to Apple's iPhone appearance at 2007. What should have Nokia have done at that time?

    The iPhone showed that software and experiences matter more than operator relationships. Nokia did a lot of research on user experiences and software but when the decision came to implement the ideas, the constraints of hardware and logistics and operator preferences took precedence and the software was compromised. What Nokia needed to do is build product around software not software around the hardware and the market.

    -Since Apple's iPhone appeared in 2007, Samsung took a Fast-follower tactics which made them successful, which Nokia could not. Do you think Fast-follower have advantage over first-mover?

    I don't consider first-mover or fast-follower to be accurate descriptions of strategy. Success follows from innovation and only from innovation. There are various forms of innovation: there is new market creation, new business models, low cost or distribution innovation. Nokia tended to create low cost innovations which opened new, low-end markets. Apple created a new market for browser-based devices and for app-based experiences. These were enabled by an ecosystem that benefited from integration.

    Samsung implemented a portfolio strategy with a large number of devices and price points which allowed them to find market niches that could be exploited. This was a distribution innovation. Each strategy has advantages and disadvantages and each strategy is usually linked to company core priorities and processes. There are times during a technology cycle when one strategy is better and another is worse. This is why companies find themselves successful and then fail. Their processes don't match the technology adoption cycle.

    For example, in the PC market there is little potential for new experiences tied to an integrated device (except for tablets) and hence there is little growth opportunity for an Apple-like approach. The innovation that matters in the PC market is mostly cost reduction. Nokia was doing cost reduction at a time when voice products were commoditizing. Cost reduction does not work when the basis of competition is new experiences and new business models. As smartphone hardware commoditizes, it's unlikely that Samsung will have an advantage unless is goes to a low-cost approach and enters into direct competition with low-end devices.

    -Can you predict the 'Big 5' in handset industry 10years from now? Many people think the list will include Apple, Samsung. Who else might be on the lists?

    There is no guarantee that Apple or Samsung will be the top vendors 10 years from now. I expect Chinese brands to become dominant in market volumes. I expect online service companies like Amazon, Baidu, Facebook to create new platforms which and have their own devices, perhaps in large volumes. I expect new input methods (like voice) to create new opportunities and perhaps new platforms and ecosystems. I expect Google may make a lot of money. One thing is for sure, being a hardware-oriented company without software and services and platforms and ecosystems is a sure path to becoming disrupted.

    -Nokia was the leading company in Finland. What are the reactions of Finland towards Nokia's downfall?

    People tend to blame each other for failures and this is the main discussion topic in Finland: who's to blame. The failure of a company is rooted in complex decision processes which usually take years to run their course. It's quite futile to lay blame on persons, especially since the same persons were celebrated for their wisdom at another point of time. At the same time as Nokia is failing however, another Finnish startup is celebrated world-wide and about to go public: Rovio, the maker of Angry Birds. It will be bigger than Nokia. Finland should make sure there are more Rovios to come.

  10. Google and Microsoft speak volumes with silence

    Research · 23 comments

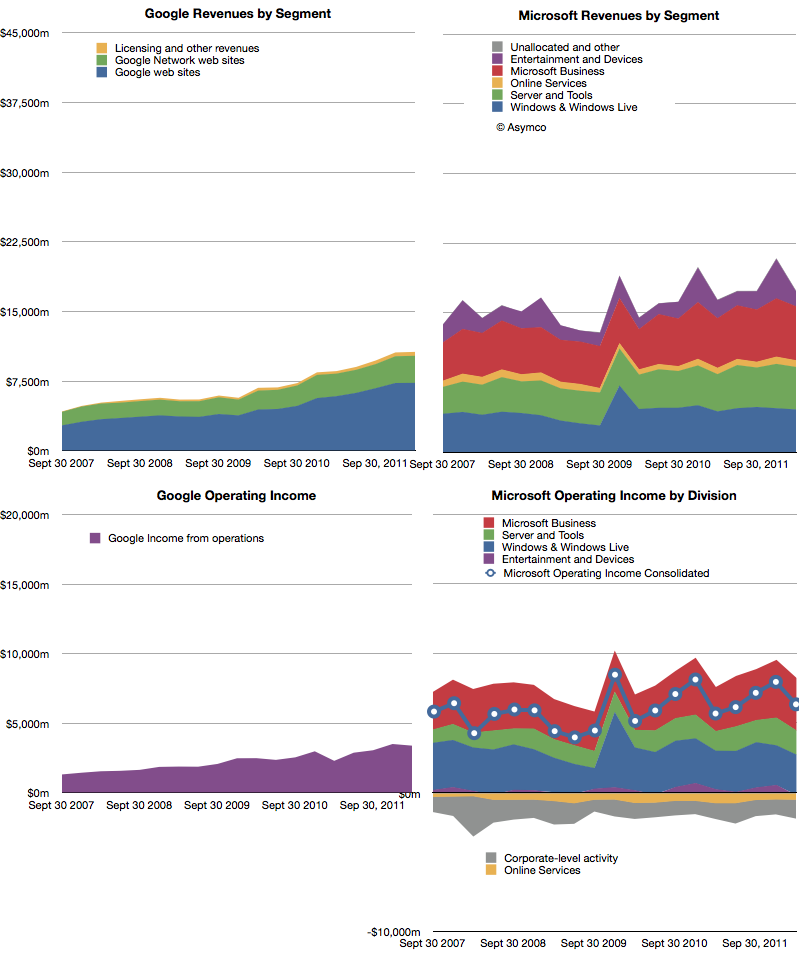
    The following charts show Google and Microsoft revenues and operating income:

    Both companies showed healthy growth. Revenues: Microsoft 6%, Google 24%. Operating Income: Microsoft 12%, Google 48%. Google had a particularly weak margin Q1 2011 so its income growth appears very strong.

    The surprise in Microsoft's performance was the 4.8% increase in Windows revenue at a time when PC sales were expected to be declining or flat. Final PC numbers are not yet out so we'll have to check back on this figure to see whether Microsoft has been able to get higher pricing for Windows or whether the market did expand. (Average revenues per PC sold have been quite steady for years). Overall, Microsoft's business shows consistency. Of course, that should not be cause for comfort. Nokia had remarkable consistency until it jumped from a burning platform and RIM grew more rapidly until its platform imploded.

    As Google still obtains 96% of its income from advertising, it's quite remarkable that it is now at 61% of Microsoft's revenues. Google is also growing more rapidly than Microsoft so the possibility exists that the top ad service will overtake the top software company in revenue, establishing a new benchmark for how software can be monetized.

    The curious thing about both of these companies' financial performance is that mobility does not appear to have had any impact on either top or bottom lines[1].  There is no business division or income statement line that can be attached to mobile revenues. Microsoft placed Windows Phone under Entertainment and Devices but that division is dominated by Xbox and accessories. Google bundles everything under Advertising and has never broken out mobile, much less Android-derived income.

    The surge in valuation for mobile-focused startups seems to leave investors in both these companies unaffected. The damnation for both companies lies in mobility being non-core businesses whose strategies center on reaction and defense.

    ---

    Notes:

    1. Google does not answer specific questions about the impact of mobile on their business but they do acknowledge that there are traffic acquisition costs (TAC) associated with OEMs and Carriers who deploy Android. This means that there are costs of mobile sales (i.e. Search) but not to any measure of specific value.
  11. Top-down vs. bottom-up: Which market analysis method is appropriate when disruption is knocking

    Research · 29 comments

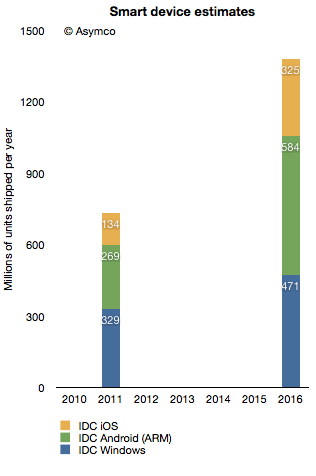
    In terms of platforms, IDC expects a relatively dramatic shift between 2011 and 2016, with the once-dominant Windows on x86 platform, consisting of PCs running the Windows operating system on any x86-compatible CPU, slipping from a leading 35.9% share in 2011 down to 25.1% in 2016. The number of Android-based devices running on ARM CPUs, on the other hand, will grow modestly from 29.4% share in 2011 to a market-leading 31.1% share in 2016. Meanwhile, iOS-based devices will grow from 14.6% share in 2011 to 17.3% in 2016.

    Via: IDC - Press Release - prUS23398412

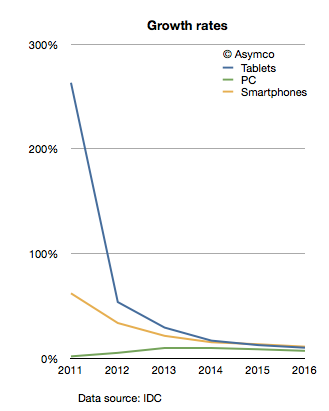
    The company provides a stacked bar chart (follow link above) to illustrate their view of the market. I took the data they included and measured the implied growth rates for the product categories:

    IDC is implying that in four years the tablet market will be growing at 10%, the Smartphone market will grow at 11% and the PC category will grow at 11%. In other words, five years from now the PC market is expected to grow faster than the tablet market and just as fast as the smartphone market!

    What's more remarkable is that this situation is not going to happen in four years. The slowdown in growth is actually expected much sooner. The growth rates two years from now are expected to be: Tablets 17%, Smartphones 15% and PC 10%. IDC is unequivocal: by 2014 the good times will come to an end to the post-PC challengers. These growth rates would be catastrophic for share prices and the value propositions of the new platforms to developers, partners and consumers.

    What's more, these growth rates are striking not only because they predict a collapse in the value of most market challengers but that they also predict a strongly resilient PC market. How can we test this forecast?

    I tried to reconcile this doomsday scenario with what is known about the components making up the data. I.e. what "bottom-up" data is IDC using? In the quote above, IDC offers some insight into this market participant data. Based on the category and share data they published it's possible to infer the following:

    Bearing in mind that neither iOS nor Android existed five years ago, we can observe they are bigger together than the PC market. And yet, IDC predicts a compounded average yearly growth rate of 16.7% in Android, 19.4% in iOS and 7.5% in Windows between today and 2016.

    In aggregate, IDC forecasts that in the next five years Android will not manage to double and that iOS will only increase by a factor of 2.4. Is this believable?

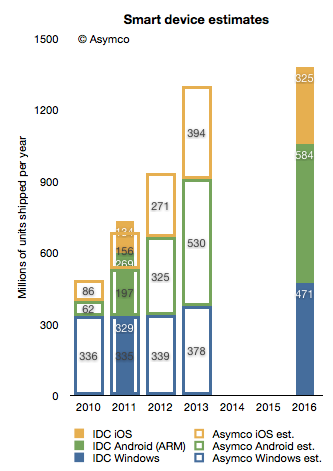
    I try to stay away from long term forecasts, but I do maintain a short term forecast based on recent growth data. My forecasts for this year and next year are shown below.

    I super-imposed my short-term forecast (outline bars) on IDC's long term forecast (solid bars) and a several differences become apparent.

    First, my 2013 forecast is nearly the same as IDC's 2016 forecast. To see why we need to look at each platform separately.

    Perhaps we might (with difficulty) agree on Microsoft's potential. I believe Windows 8 will have a catalyzing effect and that Microsoft will begin to see its platform grow again. However, my expectations are modest. To increase Windows sales rate by 100 million units/yr between 2013 and 2016 is possible but ambitious.

    The real problem is that our Android and iOS forecasts are outside any zone of possible agreement. Maybe there is a difference in what we measure. For a hint, we seem to disagree on the number of Android devices shipped in 2011. I used Google's own reports of activations to work out the yearly shipment estimates. Perhaps IDC is including versions of Android that are not Google sanctioned.

    We also disagree on the 2011 iOS figures. I obtained 156 from Apple's own reports. Again, perhaps the difference is the inclusion of the iPod in my case.

    Nevertheless, the difference in the long term cannot be accounted for only through these categorization differences. I would put the cause of the difference down to the methods used in forecasting. As can be seen from the first chart above, IDC's growth rate reductions are extraordinarily steep. Perhaps the approach used by IDC was to forecast the overall market growth and then assignment of shares to participants. This can be called the "top-down" approach. In contrast, my approach is to forecast growth rates based on recent growth rates and moderating these rates gradually. This can be called the "bottom-up" approach.

    My experience and all the data I've ever collected about historic disruptions tell me that the entrants tend to win these types of paradigm shifts. They win through a vast expansion of consumption and the recruitment of non-consumers. Markets tend to experience vast shifts in composition. If we believe this to be true then the bottom-up approach focused on entrants is likely to be more effective vis-a-vis the top-down approach of projecting steady state markets and the implicit assumption of incumbent share preservation.