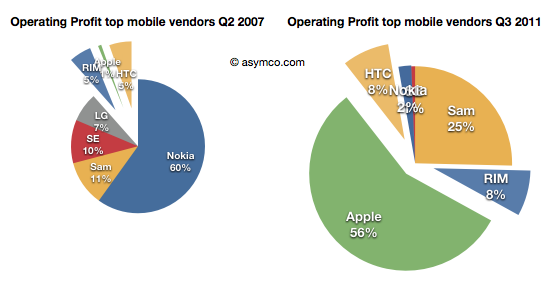
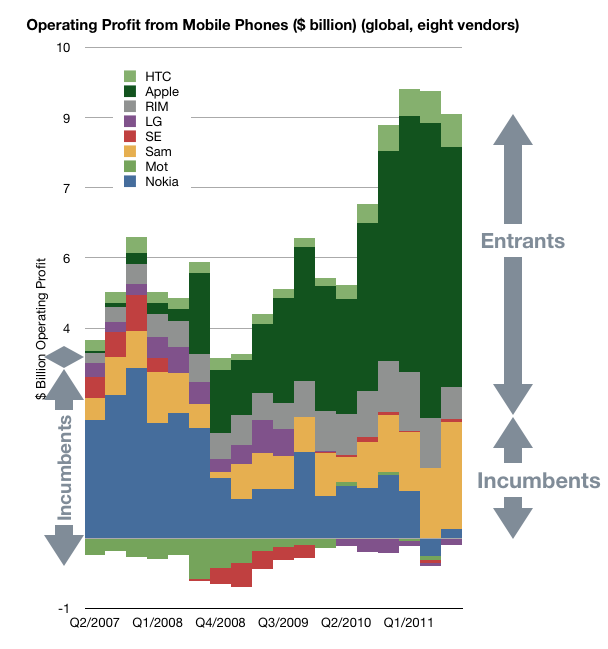
I recently posted a comparison between the profit capture of phone vendors in 2007 and the most recent quarter:
The idea was to show what a disruption looks like. A phenomenon where an entrant with none of the advantages of incumbency takes the profits away from companies privileged with ideal market access and knowledge.
The view of profit shift is the ideal view since it shows the "bottom line" impact and thus the denouement rather than more nuanced sub-plot. However, we don't always have access to profitability data. Sometimes we only have access to revenue estimates.
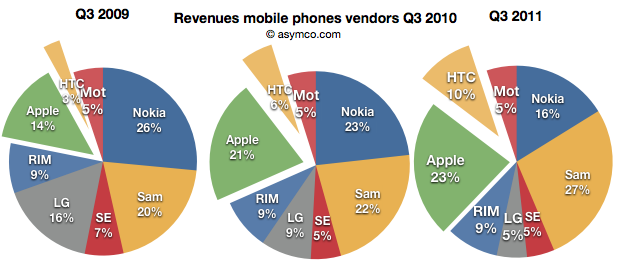
Fortunately revenues have a similar story and are often a good proxy. Consider how the evolution of revenue shares occurred in the same market:
Revenues for Apple and HTC combined doubled from 17% to 33% for the third quarter over three years.
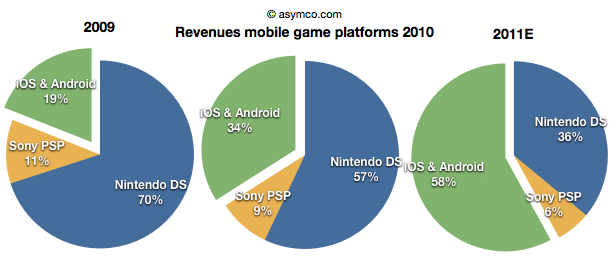
Note the similarity between this evolution and that in the mobile games market (data courtesy of Flurry):
The increase of revenues fro iOS and Android games nearly tripled over a two year period. Although we cannot say the same for profitability as the profits are not comparable since they allocated differently between platform and developer depending on platform, we can say that iOS is certainly driving vastly more value than Nintendo.
Sony and Nintendo may take some comfort from their console businesses which have not felt the same impact from mobility, but one wonders how long those franchises will last. Using an iPad with screen mirroring to a large screen TV already shows promise.
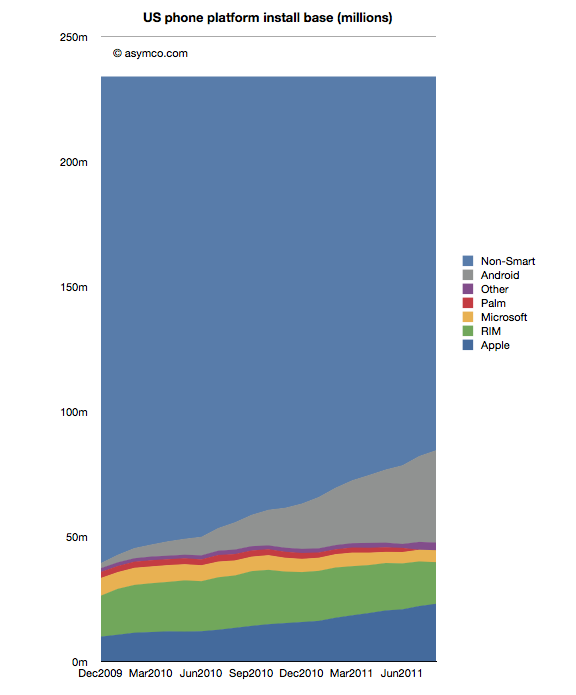
In the recently posted US Smartphone Landscape I used comScore's data to paint a picture of the growth of smartphones in general and the shape of the mobile platforms in the US. The source was survey data measuring the installed base. If we compare the installed base sequentially, we can get the increase (or decrease) of a particular platform. Comscore reports monthly but we can also summarize the data at a quarter-by-quarter basis.
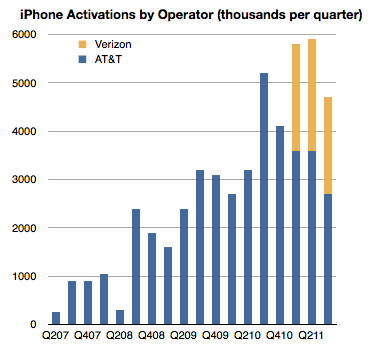
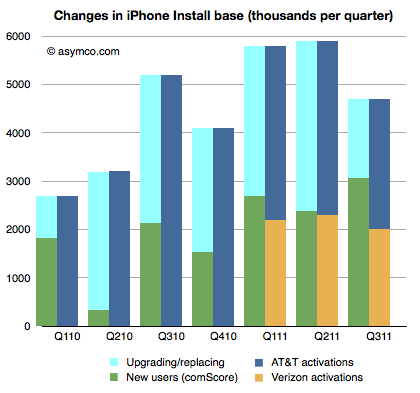
There is another source however for the US market, at least for the iPhone: operator activations. They report iPhone activations, shown below.
Can we use activations together with installed base data to learn something about the market? Yes, with some caveats.
First, it should be noted that install base should account for all sorts of devices. They could be new, old or hand-me-downs or purchased used. Changes in install base would come from addition of new devices but also from devices being discarded and users leaving the platform. Activations on the other hand include units new units but also those which have been re-activated after initial sale because they were either sold or given to other users. As far as I know operators do not report "net" activations so lost users are not included.
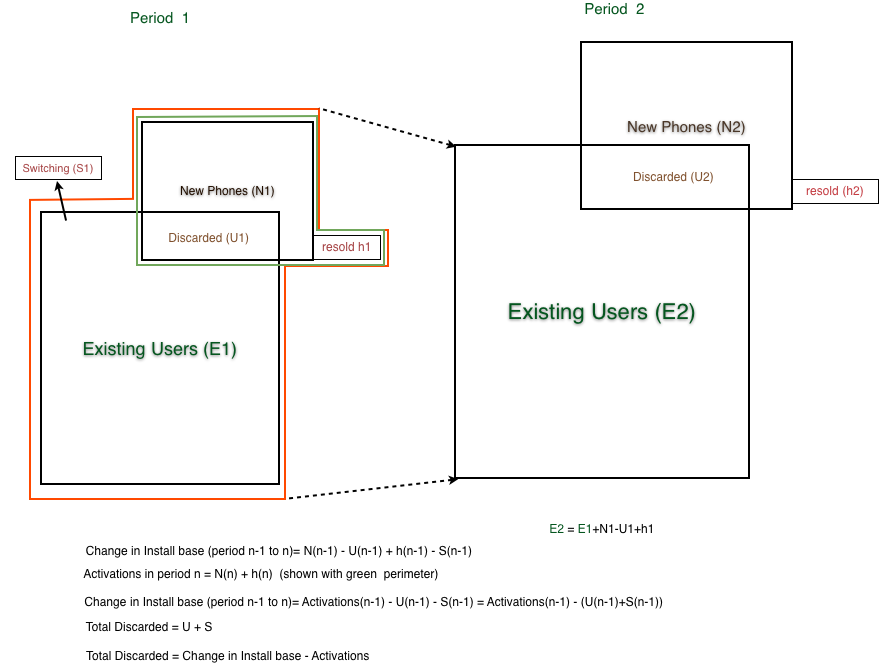
When the formulas are combined[1], what we get is the change in installed base is equal to Activations minus "discarded" iPhone, where "discarded" are both iPhones put aside in favor of a new iPhone or put aside in favor of another phone.
Since we have installed base change data and we have activation data we should be thus able to derive the number of iPhones being "discarded" or put out of use every quarter as the difference between activations and change in installed base.
That allows the following chart to be built:
The green, dark blue and orange areas are given inputs and the light blue area representing discarded phones is derived.
This is an interesting (new) piece of information. What it suggests is that at least in the US the discard rate, i.e. number of phones being discarded over number of new phones is about 50% (56% on average over seven quarters.)
It's a rate I find surprising because I expected more of the phones to be re-used. But more surprising is that it leads to some surprising and possibly implausible behavior at AT&T.
If you look at the last three quarters, you can see that Verizon activations are very nearly equal to the increase in install base. As all Verizon users are new, they are certainly not replacing iPhones, so the green bars next to the yellow bars imply that all those new users are Verizon users. But that means that all the activations through AT&T were to replace existing phones and that AT&T only added a bit more than one million iPhone users in nine months.
In quarters prior to Verizon's launch, the AT&T discard rate was a modest 60% on average and after Verizon launch it went to 81%.
What does it mean?
---
Note:
The following diagram shows the derivation of "discarded" units.
comScore published the latest data regarding US smartphone installed base. To summarize:
Penetration reached 37.4%, an increase of 2.9 million or 1.24 points of percentage.
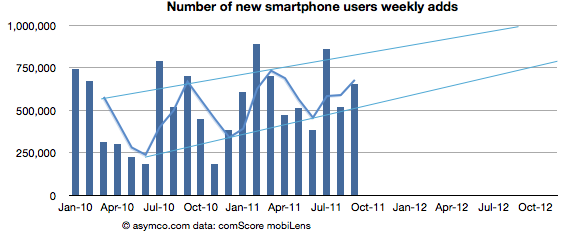
Approximately 650k consumers switched from non-smart to smartphones every week during September
Based on trailing average of six months' growth, 50% penetration will be reached by end of September 2012, though the trend is for accelerated adoption (see chart below).
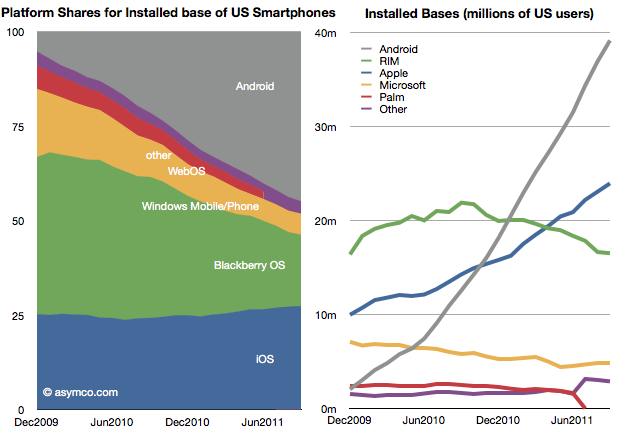
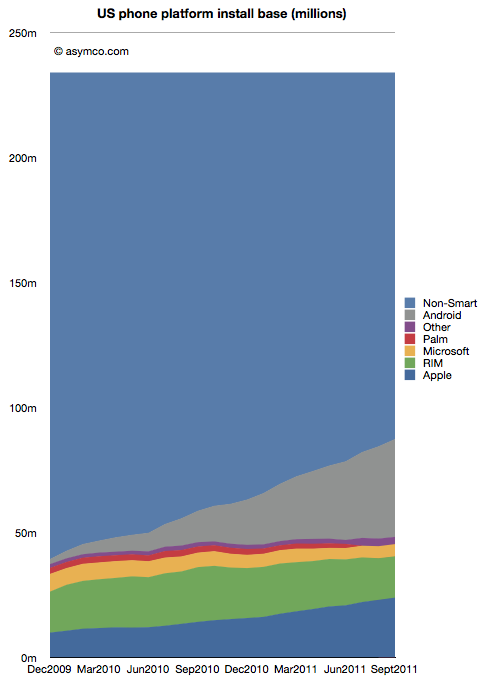
Of the platforms available, Android reached 39 million users, RIM 16.5 million, Apple 24 million and Microsoft about 5 million. Smartphone non-consumers dropped to 147 million. Among platforms, here are the shares and total users:
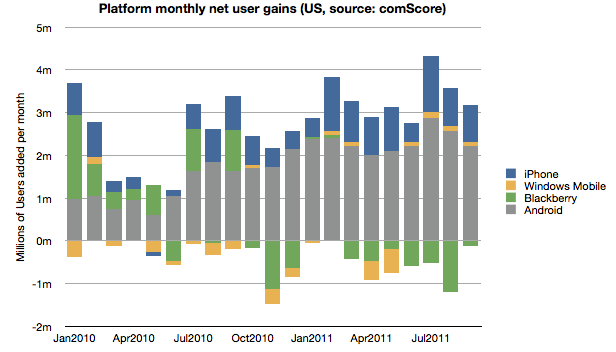
In terms of user gain/loss here is the tally:
Android and iOS have continued to increase consumption fairly consistently while RIM has moderated user losses. Microsoft has also shown the fourth consecutive month of usage increase having increased users by 440k since May. The new Windows Phones seem to have at least stopped erosion of user base though that base is still nearly a third of RIM's.
Overall, smartphone non-consumption continues to be the largest competitor though one which is steadily losing.
Even though China may overtake it in the new few months, the US is the largest smartphone market and it's a good leading indicator of the way the industry in evolving. It's also being measured by multiple observers[1] and we thus have a better chance at understanding the rate at which change is happening.
---
Note:
Nielsen reports that 43% of the phones in use in the US now are smartphones in the US with Ages 25 to 34 having 62% penetration.
A few years ago, around the middle of the last decade, the mobile phone market was characterized by the rivalry between a few established vendors. These were Nokia, Samsung, LG, Motorola and Sony Ericsson. These incumbent companies had a broad portfolio of devices including smartphones and feature phones and basic phones. Many also sold networking equipment and were deeply engaged with their customers, network operators.
There was also a set of entrants who offered only smartphones. They were quirky. HTC was a a prominent "ODM" or original design manufacturer who built phones for companies who added their brands and sold and supported the product. HTC made phones and PDAs for operator brands and for some large PC companies. It also began to sell phones under its own brand. RIM was also offering products that had evolved from pagers into email appliances with added voice capabilities. But RIM's products were not very good as phones. Voice was so poorly integrated that many people carried both a BlackBerry and a voice phone. Then there was Palm with something called a Treo which promised many things but did not quite deliver.
In 2007 something happened which changed the industry. It took a few years to even realize it was happening but by the time it was obvious, it had changed to such a degree that huge companies found themselves in financial distress. This chart illustrates the effect.
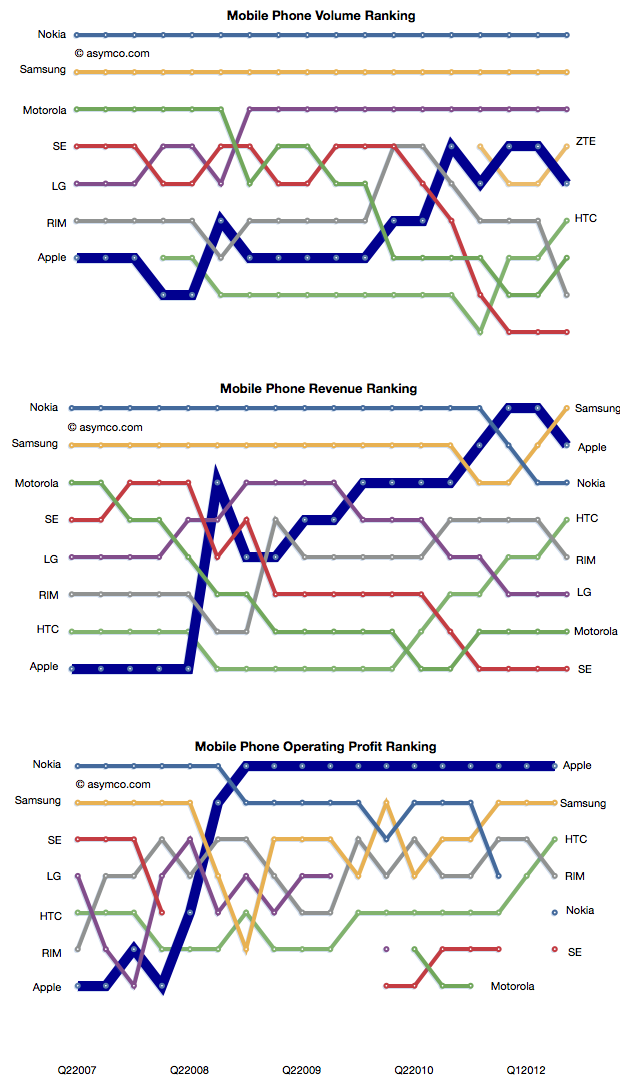
In a few short years the rivalry between incumbent handset makers has evolved into a rivalry between mobile platforms where the incumbents were caught in an increasingly unprofitable role of hardware integrators. Motorola is now being absorbed by a search company. Sony Ericsson is being absorbed into a consumer electronics company. Nokia is going through a potentially existential crisis and even abandoned its platform. Acquisition talk surrounds LG's phone efforts. Samsung is prosperous but sill at the mercy of its software suppliers. Even the entrants are starting to feel beleaguered. RIM, the oldest pure play smartphone company is trading below book value and has regressed in value to 2004 levels. Palm evaporated. A view into the changes is the rankings of the companies in terms of volumes, sales and profit as shown below.
How did large, powerful, smart companies let this happen?
It happened despite having a clear, front row view of the transition of the industry from mobile voice to mobile computing. The shift in the basis of competition from "connecting people" to "connecting people to data" ended up being a classic disruptive trap. Many will argue that it was the failing of individual managers. Perhaps, but how did they conspire to fail simultaneously?
When you see disruption happening, it's natural to seek out a cause, a pivotal magical "force" or event that enabled the weak to humble the strong--the proverbial sling that enabled David to defeat Goliath.
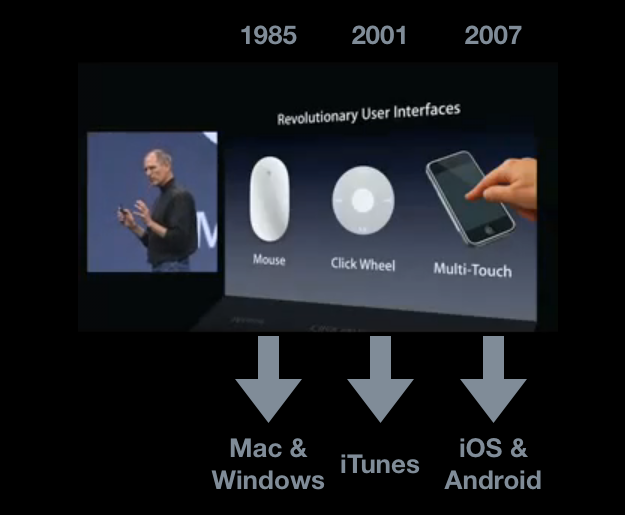
My hypothesis is that The Primary Cause for the shift of profits from Incumbents to Entrants has been the disruptive impact of a new input method. I illustrated this with the help of the January 2007 slide presented by Steve Jobs at the launch of iPhone.
Each new input method led to not just a disruption but new platforms and new business models. Each new "sling" victimized a set of historic companies. Mainframe and minicomputers, consumer electronics giants and now telecoms.
Just like David's sling, these technologies are not powerful in and of themselves, but rather, the way they are used makes them unpredictably sinister. The context of using capacitive touch on a handheld device rather than on a table-top makes it disruptive. Coupling it with high-speed mobile networks and powerful but efficient microprocessors made it into a force.
That is now ancient history. The consequences and repercussions are still being felt and weighed, but the smart money should be focusing on the next shift. From the time frame in the diagram above, it's clear that the cycle time between "Revolutionary User Interfaces" is shrinking. It's been five years since multi-touch. Is the next "RUI" already here? Is Siri the next RUI?
There are many things going for it:
It's not good enough
There are many smart people who are disappointed by it
Competitors are dismissive
It does not need a traditional, expensive smartphone to run but it uses a combination of local and cloud computing to solve the user's problem.
It is, in a word, asymmetric.
My disruptive hypothesis for Siri is that it shifts the competition from platforms positioned on a device to a "coupled" super-platform dependent on broadband and infrastructural computing.
Just after collecting enough data and observing patterns in it that give us clarity, It looks like things are about to change all over again.
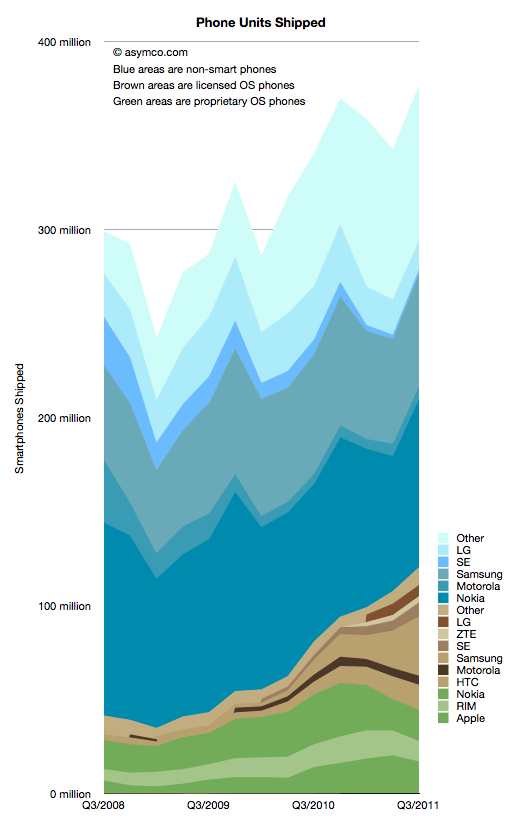
I collected all the data available so far and created a new graph that illustrates the complete market evolution over a three year period.
I chose a particular color scheme where shades of blue represent non-smart devices (think blue ocean), shades of brown are smartphones with licensed operating systems (Android for the time frame above) and shades of green as proprietary operating system smartphones. Multiple vendors are shown and those which sell both smart- and non-smart phones are shown twice. Note that the legend shows the vendors in the same order as the stacked areas.
There are several observations that are easy to make from this type of view:
The smartphone market is growing rapidly, not surprisingly. However, the overall market is also growing. Smartphones as a percent of total units sold is at around 31%, up from 14% in Q3 2008. Smartphone units however have tripled in the same time frame (from 40 million to about 120 million). This means that almost all of the market's growth has been smartphones with non-smart units barely increasing from 258 million to 272 million over a three year span.
Non-smart phones are far more seasonal than smartphones. As smartphones increase in share, seasonality should match that of the other phone types.
The number of branded smartphone vendors has increased significantly with "others" becoming a small part of the total. In contrast, the opposite effect is taking place in the non-smart market. Non-smart phone shipments have concentrated in two main brands and a large set of "others". This bi-polar industry structure points to where the value is migrating and hence where rivalry is increasing. We can use these shifts as indicators of industry maturity.
The opportunity for smartphone growth remains in the 70% un-penetrated blue area. However there is evidence that smartphone "switchers" are increasing with a noticeable decline in Nokia/Symbian and RIM. Apple's decline in Q3 is likely to be reversed in Q4 but Apple's share of all phones remains under 5%-- a five-fold increase in share from 2008 but a sign of how much is left to be done.
As Nokia shifts its Symbian portfolio to a licensed Windows Phone model the licensed cohort will tip over into an "all but two are licensees" line-up. This should be particularly worrisome as value is shifting to software and services and "super-platforms". But before the disruption is complete, there are still some cards to play. Samsung and Nokia have vast non-smart volumes to convert and it's unclear if they will do it with Android and Windows vs. layering their own proprietary Bada and future Nokia Linux platforms.
In the next few weeks I'll publish details of all the measures of the market but this first "landscape" view gives a good initial perspective. In the mean-time the data is accessible from the Asymco "cloud" here.
The August comScore mobile survey (MobiLens) is out. It measures the penetration or consumption of various mobile products and services in the US over a three month period.
I track the change in this data over time. Here are some highlights:
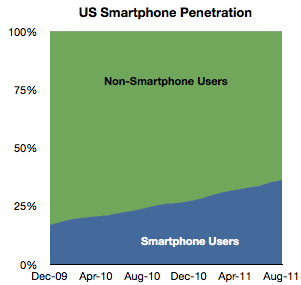
In August about 520,000 users switched to using smartphones (from non-smart phones) as their primary phone. This is a bit down sequentially from July but about average for the period starting January 2010.
Penetration increased by about 1 % to 36%.
Extrapolating this growth implies 50% penetration by September 2012. However growth is accelerating slightly so that tipping point may come sooner. Separately, T-Mobile reported that 75% of its device sales during this year have been smartphones, so if this is indicative of overall US market, then by next year it may in fact be quite difficult to find any non-smart phones to buy.
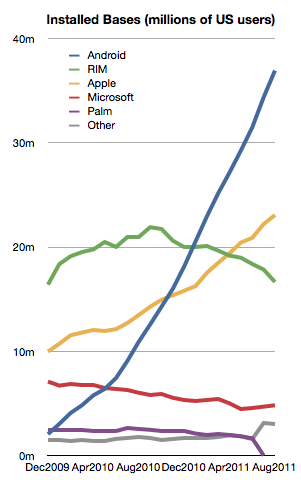
Among the smartphones, the different OSs have the following installed bases:
The growth in both Android and iOS has been fairly constant for the last 18 months.
Microsoft seems to be stabilizing at around 6%
But RIM shows an alarming deterioration. The company has lost 4.3 million users in the last year and is now at about the same number of users it had in late 2009. This is in a market that has more than doubled.
With only about 16.5 million US users and an average loss of half a million users per month, unless something drastic happens, RIM could lose its entire US user base by the end of next year.
During the last month alone RIM lost 1.2 million users. Management insists that new devices will boost sales but here we're measuring the erosion in core users, not upgrades. It's much more likely that those 4.3 million who left BlackBerry went to other smartphones. To move from a BlackBerry to a feature phone seems very improbable to me.
That means that BlackBerry's pain is probably iPhone or Android's gain. This sort of switch is often painful and I can only imagine that it's done with some reluctance. All the more remarkable then that RIM could not offer incentives to stay. The BlackBerry brand is fading rapidly and brand value is very hard to re-build.
There's one more thing.
We can see platform rivalry in the installed base chart but the bigger battle is the competition with non-consumption. The following chart shows how overall platforms are faring as they carve up the feature phone market.
There are still 150 million Americans whose primary phone is not a smartphone. The conversion of those users is happening at a consistent pace but there are many years of growth remaining. I've often wondered if and when this pace would moderate. I suggested perhaps at 50% there would be an inflection point as the "easy money" would already have been made.
Much of that will depend on how the product (device + service) will be priced. It's hard to get data on overall pricing. We can get some subsidized phone prices (for example now ranging from $0 to $400 for iPhone and probably similar for Android). What we don't have is an average device+service price point for the industry. That's what I would like to keep an eye on.
[Updated with new charts including data from StatCounter and not NetMarketshare]
Generally speaking there is an equivalence drawn between iOS and Android as technologies and even as user experiences. However, as I've pointed out on several occasions there is a very clear nonequivalence in business models and thus the "fuel" which keeps each platform running. But does this difference in models lead to some difference in the way the products are "hired" to do what they do. Does it imply anything about how the products are likely to evolve?
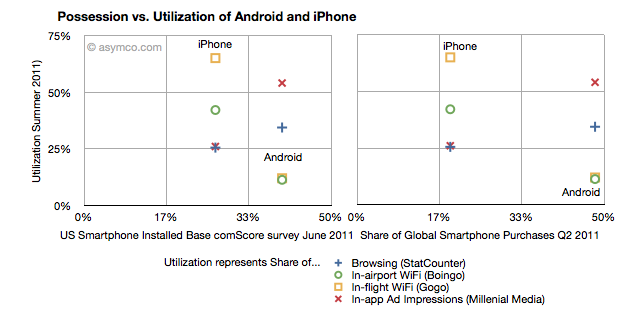
I collected into one place all the data I could find about utilization (how much of a service and how often it's used) and possession (both in terms of current ownership and new acquisitions) of iOS and Android.
Possession data comes from comScore survey data of share of US installed base of smartphones by platform at the end of June 2011 (first chart) and share of Global Smartphone Purchases as of Q2 2011 sourced from company reports and IDC (second chart).
Utilization data (vertical axes) comes from August 2011 shares of mobile browsers (from StatCounter June 2011), in-airport WiFi associations from Boingo in June 2011 (iPhone vs. Android), in-flight Wifi associations from Gogo in June 2011, and In-app Ad impressions from Millenial Media also in June.
The charts are divided into nine sections corresponding roughly to "low", "medium" and "high" utilization vs. possession.
The first chart compares a US-only population for possession vs. a mixture of global and US-only populations for utilization. The second chart compares a global population to the mix of US and global metrics.
What I found interesting is that if we take ad impressions (red X) and browsing (blue +) data out, the two platforms are indeed quite distinct. iPhone has a medium level of possession with a high level of utilization of data services while Android has a high level of possession with a low level of utilization. The data is also nicely clustered.
If we take just the ad impression or browser data then the platforms are quite similar: medium utilization for medium possession and high utilization for high possession. If the two platforms were to swap places in possession (i.e. market share) then they would probably also swap places in utilization (i.e. impressions).
What the data seems to suggest therefore is that for data services the iPhone is a far more popular tool than Android. But for in-app ad impressions and browsing the products are used in a similar manner.
The big difference is however that the services where iPhone utilization is high are those where users have to pay something. Most (if not all) of the ad impressions in apps are for free apps. So ad consumption scales with possession. But non-free services don't. This data seems to support the hypothesis that Android users are disproportionately less willing to spend money (note that the data does not say that users don't have money, but simply that they are not spending it). The other data which backs this hypothesis is that paid app sales on Android trail quite far behind the rate of purchase on iPhone. That could be due to payment problems in the Android marketplace but this data shows that there is some other effect as well.
Why is this important?
We can argue that Android is a low end product and that it disrupts and that this is consistent with that positioning. However it also indicates that the value is not in that ecosystem. And ecosystems are what sustain a platform in the long term. This debate will continue but I am reminded of other platforms which had similar patterns.
Both the Blackberry and Symbian had high possession (in terms of share) with very low utilization. There were lots of surveys which showed that browsing, app downloads and "monetization" of services after the sale of the handset were low. Much was written about it being due to poor experiences. But learned observers today insist that the experience on Android is as good as on the iPhone.
So why is there less economic participation from Android users? It's not just about these proxy services, but all manner of activities which enrich an ecosystem. Possession without utilization implies a product that does not do its job. Its features are not being absorbed. Why would that be?
In the post on OS turning circles, I used the concept of a radius of turning as an analogy for agility. One problem with the analogy is that turning in circles implies a return to a starting point or at least a closing of the loop. The idea is that there is lifecycle repetition. However, in reality, this does not apply to the world of operating systems.
An OS, as a platform, usually has a finite life. It is born, grows and usually reaches a point where it is no longer supported. Sometimes, a new platform is born to take its place from the original owner but more often a replacement comes from a new challenger company.
So rather than circles, the analogy of OS lifetimes may be more accurate.
If we do think of platforms as finite, then the natural question is what causes an end? We need to look for patterns which may indicate when a platform is reaching end of life.
The difference in this analysis is that the measure of "age" of a platform I use is not time per se but versioning. The logic is that each major version is a meaningful and significant improvement in a platform which needs to be delineated, marketed and celebrated. It embodies the business logic as well as the engineering logic of the platform custodian.
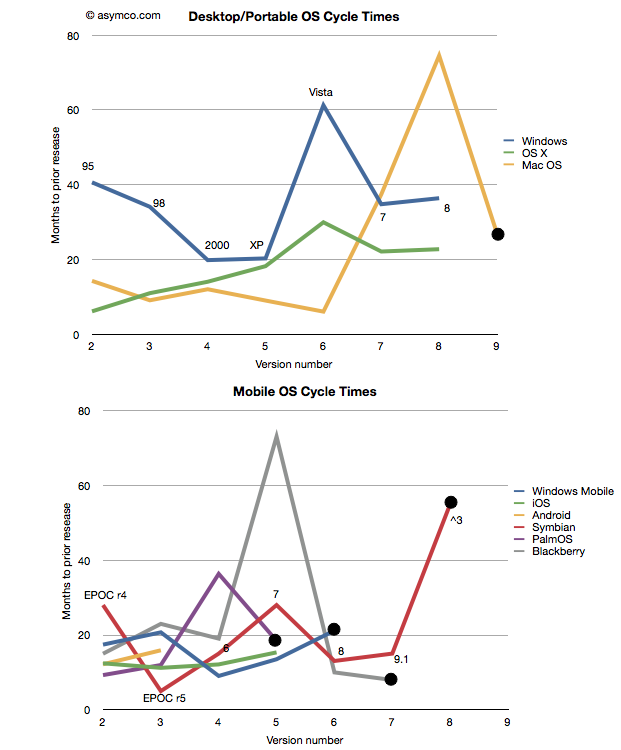
Taking the data from the last post I added a few more platforms: Symbian[1], PalmOS and Blackberry OS[2] to seek out patterns. I also separated the desktop/portable OS's from Mobile OS's and plotted these version-demarcated lifespans.
One thing to observe is that the scales of the two charts are comparable. There are examples of short- and long-term version updates and the number of iterations (lifespan) can be similar. I noted also that there were several platforms which have reached end-of-life[3][4]. Those platforms have a big black dot at the end of the line.
That leads to another observation. The end of a platform seems to be indicated not by simple age (the shortest lived was six years and the longest lived was 16) nor by the number of versions (PalmOS lived for five while MacOS lived for nine). Instead the end of life is most clearly visible as a lengthening of the development cycle.
Note that each platform that ended was preceded by a spike into the vertical--a significant delay in the release of a version. The data is one thing, but it's anecdotally supported by observation. Industry observers note that delays in improving the product are symptoms of some fundamental architectural or marketing roadblock. In the case of Mac OS, Apple struggled to bring modernity to its "Classic" OS. It need memory management, more reliability and a better file system to support the move to networking and media hub use that defined the consumer expectations of a PC.
There was a change in the basis of competition, away from pure productivity and more toward entertainment that turned out to be more demanding in new ways. Apple had to move away from Mac OS and lost time with its internal Copland effort before punting with NextSTEP. Similar transitions are visible with Palm (from PalmOS to WebOS), Microsoft (from Windows Mobile to Windows Phone) and Nokia (from Symbian to MeeGo) and RIM (from Blackberry OS to QNX). In fact, survival of a transition is relatively rare and never without significant pain and loss of value or share.
This is also understandable through the lens of disruption theory. As a product reached the point of being good enough, "breakthroughs" are harder to come by. Engineers and marketers struggle to push the product into increasingly rarefied strata of performance. The old architecture does not fit the new demands but it's crammed into them anyway. This last big push is then followed by a stall and ultimate demise. Meanwhile, an entrant gains lift in the rich atmosphere of new bases of competition with an architecture that's built specifically for it. The process then repeats.
And so the charts relate the same story of sustaining improvements followed by inevitable last gasps that Clayton Christensen first illustrated[5] in The Innovator's Dilemma. A book that came out just as the first mobile platforms cataloged in these charts began their ascent.
---
Notes:
Versions of Symbian do not match easily to integer values. I used the versions as recorded by pdadb.net. The sequence is as follows: EPOC Release 3: "1", Release 4: "2", Release 5: "3", Symbian OS 6.0: "4", OS 7.0: "5", OS 8.0: "6", OS 9.1: "7" (9.0 was deproductized), Symbian ^3: "8". Symbian ^4 has been cancelled. These original version numbers are noted on the chart.
The times recorded are for "general availability of product" which in the case of mobile OS's means the time when a device using that OS was released.
End of life is defined as the last version generally available. In some cases (e.g. PalmOS 6) newer versions are built but they may not be released into a working complete product.
Windows Mobile is treated differently here than in the previous post. I chose to declare it EOL after version 6 and consider Windows Phone as a separate OS. This is because the name change is indicative of a break with the past. As before, I defer decisions about continuity to the developers and/or marketers who choose the naming conventions.
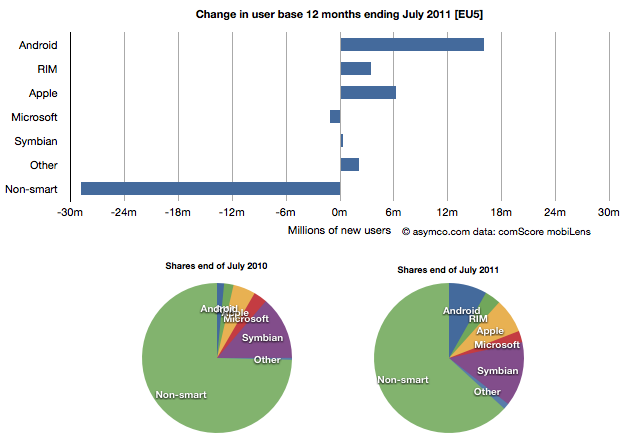
Yesterday comScore published survey results for EU5 (France, Germany, Italy, Spain, UK) on smartphone use and installed base. The headline is very similar to what would be written about the US: Android had phenomenal growth over the last twelve months. I also noted that the apparent growth of Google (16.2% share change) seemed to be matched by an apparent decline of Symbian (-16.1% share change.) However the reading of the data is not so simple.
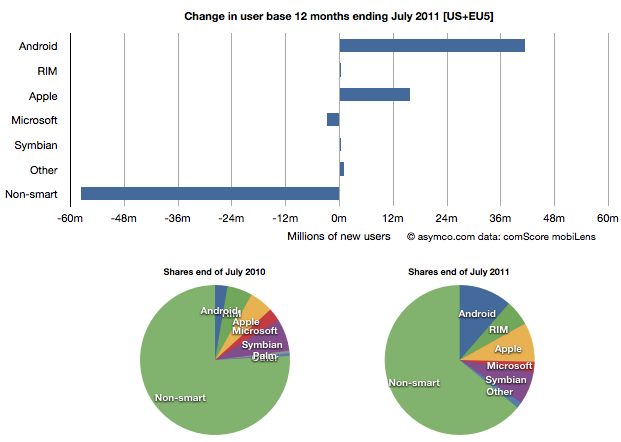
In order to understand what has happened to usage, it's much more valuable to look at consumption and the actual number of users rather than change in share of a subset of the market. Consider the following charts:
The bar chart shows that three platforms gained users in the last year (ending July) and that there were negligible losses in users by others. Negligible except for non-smart phones. A remarkable 29 million users moved from non-smart phones to smartphones. Those switchers switched into Android (16 million), iPhones (6.3 million) and RIM (3.4 million). Symbian even gained about 330k users. Microsoft lost about 1 million but its platform has not been actively promoted in that time.
When seen as a pie chart, you can see how the usage shifted from non-smart to smart even more clearly. It does not appear that Android took share from Symbian at all. Android took share from non-smartphones. The table in the link from comScore leads one to conclude otherwise.
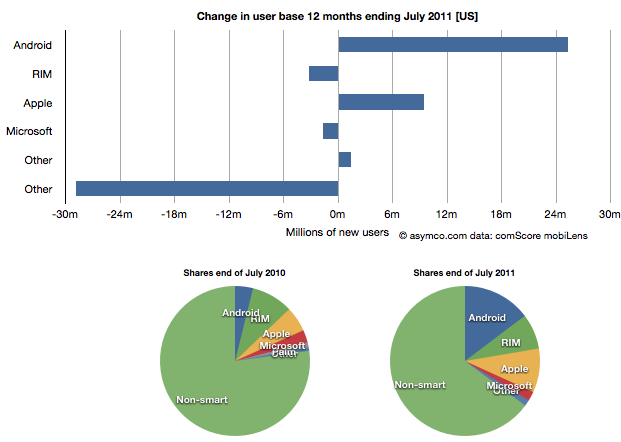
I took the same approach to look at the US data (also from comScore). It shows a similar pattern.
In the US, RIM was a net usage loser but its losses also paled to the losses of non-smart devices. In comparing with EU5 the pattern is very similar.
I then combined the EU5 and US data and provided a view into the combined markets (note scale change from previous two charts.)
This shows the change in platform phones more or less being from non-smart to Android and iPhones. The total population is 470 million people--not insignificant. The total number of non-smart devices abandoned is nearly 60 million in one year, which equals the total number of new smartphone users. That's 12% of most of the developed world switching in one year. If this keeps up, the "tipping point" when smartphones will outnumber non-smart phones in use in these large markets will be in another year.
In terms of sales rate, the tipping point has already happened. Sales of smartphones crossed over in the US and Europe several quarters ago (November 2010 in EU5) and the trend is accelerating. Furthermore, if patterns of mobile technology adoption repeat as they have for the last two decades, emerging markets will follow in two to three years.
This tipping point observation has been repeated on this site a number of times when reflecting on the data in the US. Now it's becoming clear that the same pattern has been underway in Europe as well.
The big picture from the survey data is just how vast the demand for smartphones is. Some platforms are benefiting more than others in terms of share of growth, but the biggest mobile loser is clearly the non-smart phone. Not only is it an unprofitable product for almost every vendor, it is also being increasingly shunned by buyers.
At the same time, at 450 million users we're still only looking at less than 10% of the market. As this pattern spreads globally the platform install bases will be measured in the billions of users.
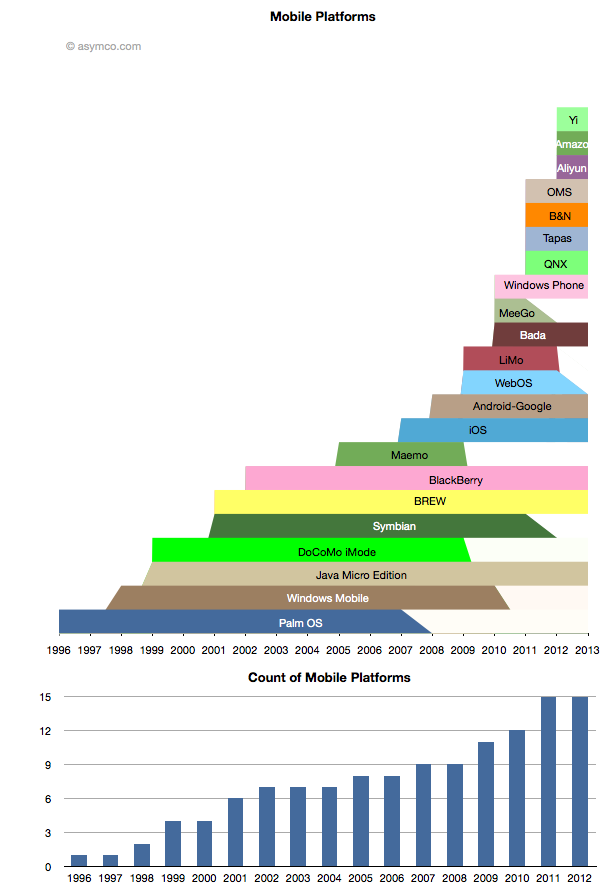
While some mobile platforms are being withdrawn from the market, others are being introduced. The net is that there are more mobile platforms announced for 2012 than ever before. The following chart shows the lifespan of the platforms that I can recall.[1]
Amazon's entry is only rumored but I think the description of it is detailed enough to be credible. The day after the scoop with Amazon, Baidu announced the Yi platform. Baidu is the sixth most visited site in the world, so it's not a bit player and it makes as much sense for Baidu to have a mobile platform as it does for Google.
Aliyun is Alibaba's latest and it, like Amazon's, is positioned on commerce and shopping. I also included the platform underlying Barnes & Noble's Nook for consistency.
Many of the newcomers are Android-like or Android-derived platforms but cannot be rightly called Android as they are not licensing the Android trademark nor any of the proprietary part of Android. They may run some subset of Android apps but that is not guaranteed to continue.
It's also worth noting that many of the newer Android-derived platforms are being launched by Google's competitors and indeed seem to be designed to take value away from Google.
The lifespan is bounded by the dates of public announcements of start and end of development efforts by the platform owner. It does not include times when products are still in the market or the platform is still supported.
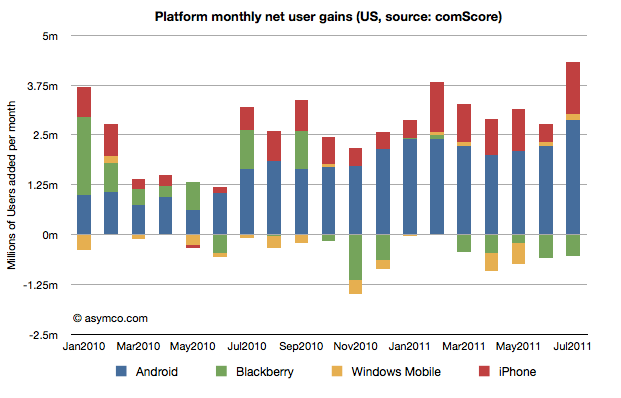
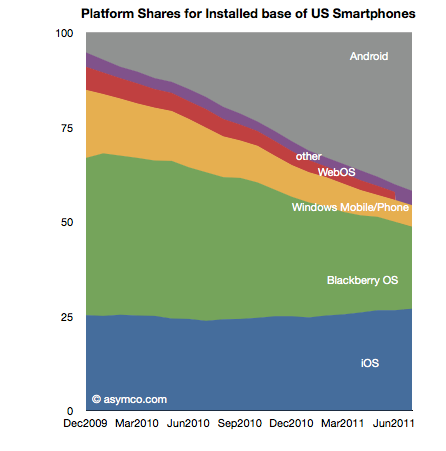
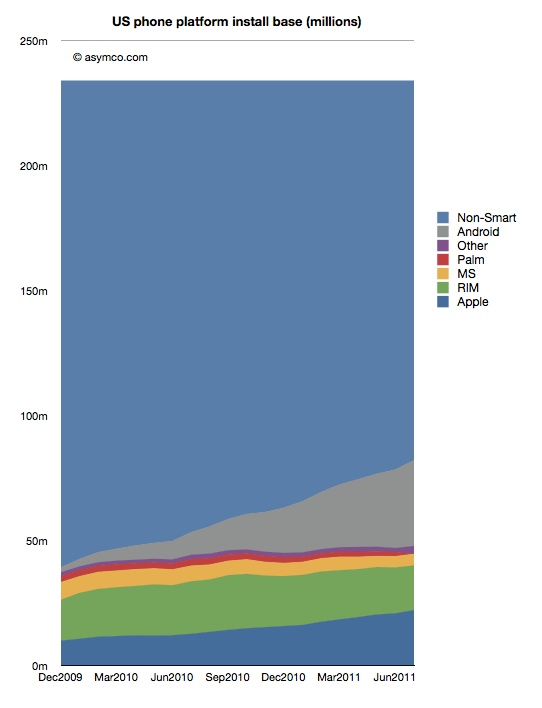
The latest survey from ComScore breaks down the installed base of specific mobile platforms in the US. Tracing the data over time shows the following charts:
In the last month Android gained about 2.9 million users, iPhone 1.3 million, Blackberry lost 530k users and Windows held on with a gain of 132k. Other platforms had a net loss of 95k users.
In the last 12 months, Android gained 25 million users in the US. iPhone gained 9.5 million while Blackberry lost 3.2 million and Microsoft lost 1.6 million. Other platforms had a net loss of 1.2 million.
The total net gain of smartphones was about 29 million new users.
RIM switched from being a consistent net gainer of users to a consistent net loser of users in October 2010. Windows Phone is showing signs of holding the line on user base erosion but share remains below 5% (now at 4.7% vs. 4.6% last month). To put the mountain-sized hurdle in perspective, Android now has 7 times more users in the US while iPhone has about 5 times more. To become the largest mobile platform in the US, as some analysts are predicting, Microsoft has a 12:1 disadvantage that looks to continue to grow.