Will there come a time when Samsung will earn more profits from the iPhone franchise than from its own Galaxy product line?
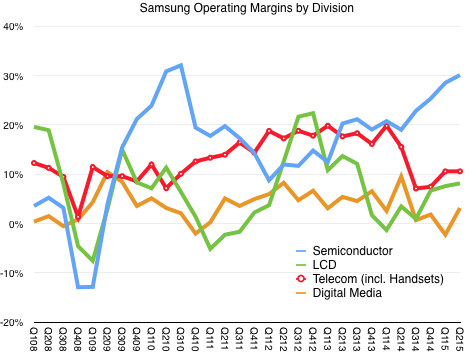
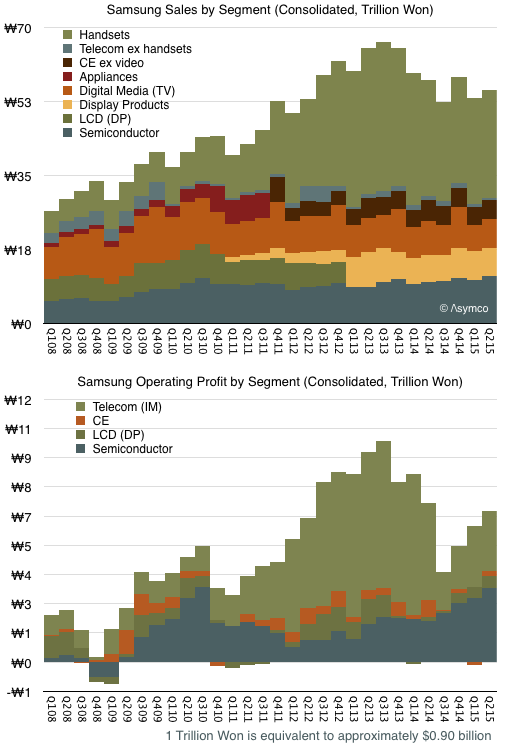
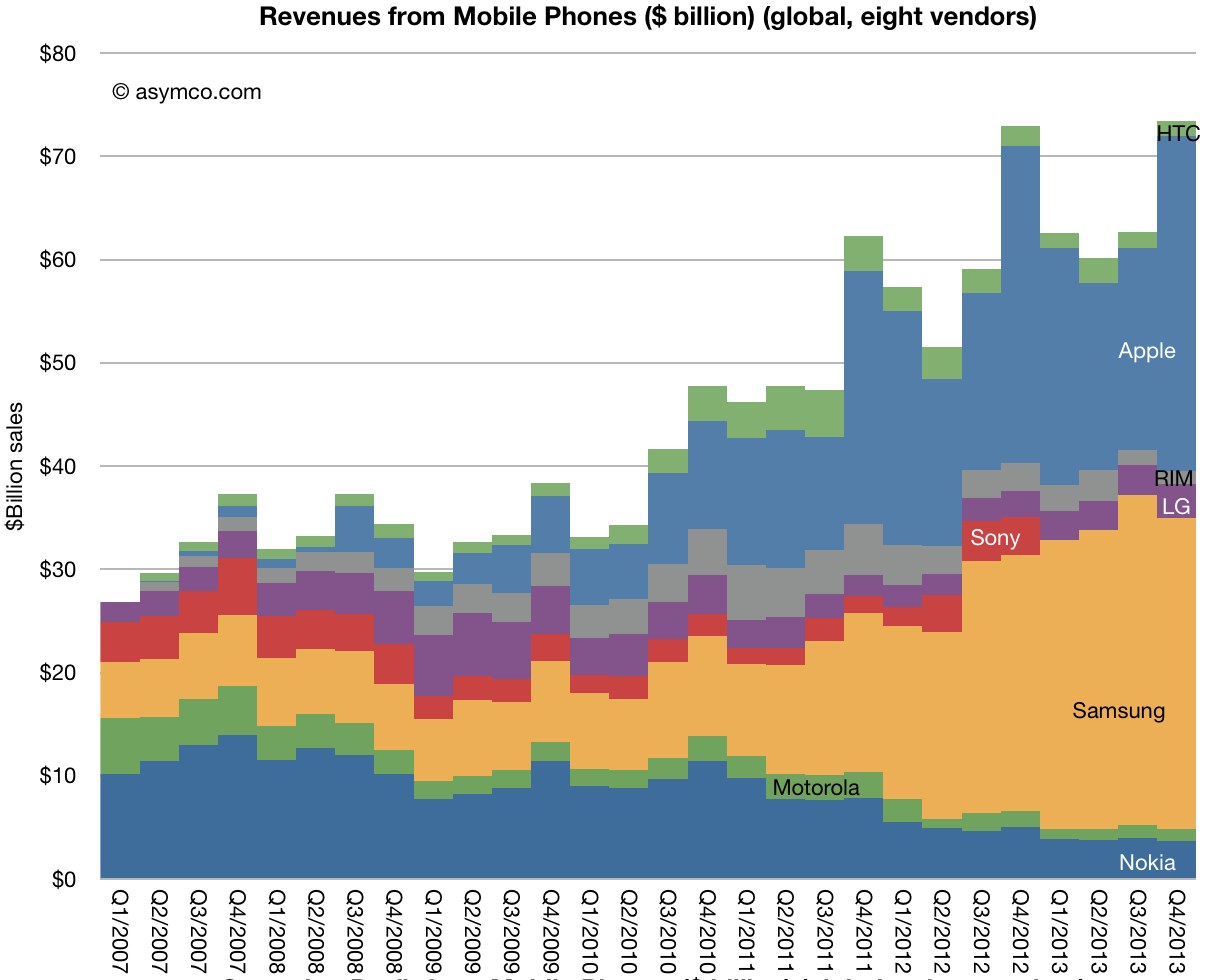
The problem for Samsung is that although it still sells the most phones ((over 80 million but we don't have a precise figure)), and the most smartphones, the price and margins for these products are collapsing. The pattern is shown in the graphs below:
Phone operating margins peaked in Q1 2014 at 20% but are half that level today. These margins have dropped to levels Samsung had in 2009, before the Galaxy launched and before they had any substantial revenues from smartphones.
In contrast, the semiconductor group is growing both revenues and margins. Margins and operating profits are both 50% higher than those of devices.
We also know that Apple is Samsung Semiconductor's single biggest customer. We can't be sure how much of the total revenue/profit comes from Apple but if the pattern continues then Apple could be the greatest contributor to Samsung's profitability in the near future.
How could this be? Wasn't Samsung supposed to "disrupt" Apple?
The reality is that Samsung's own smartphones are being disrupted by good-enough Android devices, typically made by Chinese brands. This low-end disruption is also affecting LG, another phone maker and Apple supplier.
Unlike Samsung and LG, Apple is less susceptible to low-end disruption. What Apple offers is a brand promise, an ecosystem, associated products and services and what amounts to a new market. It's this parallel value network that competes with Android/Google, rather than with Samsung.
Samsung is a supplier in the Apple network and a licensee in the Google network. As a result, it has a near monopoly position with a platform controller (Apple) and a commodity position with a platform licensor.
Neither position is one of control, but the current market stage benefits Samsung within the Apple ecosystem more than in Google's ecosystem. It's a situation analogous to one where Intel made both x86 chips and PCs that ran Windows. Long term it's likely that the sole-source chip business does a lot better than the multi-source systems business.
That should be a warning to others who hoped to survive as Android OEMs. They don't have semiconductors to sell to Apple.
Searching for "iPhone killer" returns millions of hits. It's hard to remember any phone/product/service/platform/initiative/merger/startup which was not at some point considered an iPhone killer. A sampling is offered here.
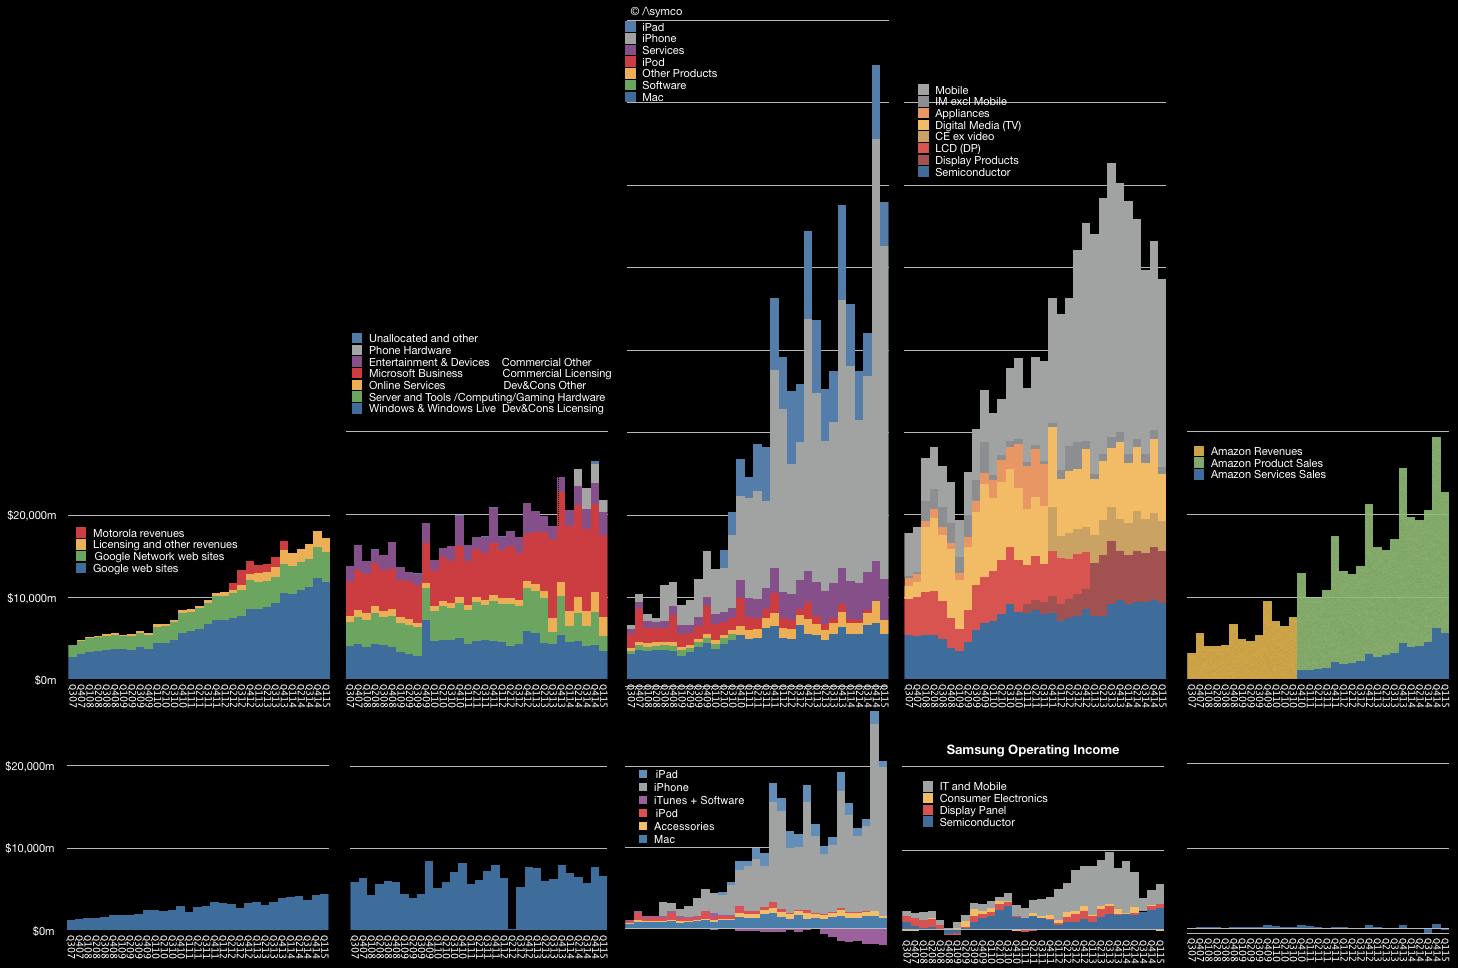
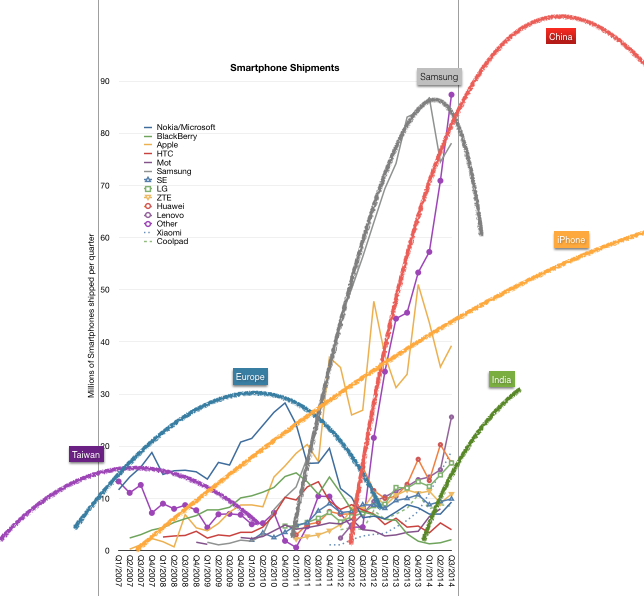
In reality, the killers seem to have all faded away while the iPhone continues. We could just shake our heads and move on, but a deeper analysis is possible. Take a look at the graph above. Note that iPhone's (and hence Apple's) ascent has not caused decline in its nominal competitors. When seen in the context of the graph above, the success of the iPhone has in fact been complementary to those companies who would be its killers.
Consider that the iPhone drives a large portion of Google's revenues as it is the home to many Google services and engagement through the iPhone is higher than any other platform, including Google's own. iPhone users tend to make better customers. In exchange Google pays a great deal for traffic acquisition on iOS devices. The placement of search on Safari is probably the biggest single cost item on Google's income statement ((Estimates are a few billion dollars a year.))
The iPhone example drew Google to build Android as a facsimile and that, coupled with Brobdingnagian spending on marketing, led to Samsung's Galaxy success. That success seems to have peaked and the brand is now a victim of low-end disruptors which copied it and the iPhone in turn. However, Samsung electronics benefits from the iPhone in terms of its semiconductor division. Apple is Samsung's biggest customer and the semiconductor division is now the largest source of operating profits.
The explosion of Android has led to IP licensing revenues for Microsoft and now Microsoft is extending its software applications to iOS, hoping to participate in the iOS ecosystem rather than competing with it. The time may come when Microsoft shows growth from the iPhone.
Finally, although it may seem oblique, Amazon is benefiting from the iPhone. Instead of killing it with the Fire ((presumably as a low-end disruption)), the iPhone and iPad offered much more mobile shopping opportunities to the Amazon store. Data shows that iOS leads in shopping traffic and order size precisely at a time when Amazon obtains its largest volumes. Amazon's AWS also handles a great deal of iOS-originated traffic.
This alternate reality shows that the benefits from the iPhone revolution are broad and deep. It's not just the direct revenues (($25 billion paid so far)) from app sales on the App Store but also the creation of entire new communications modalities (Instagram, Snapchat, WhatsApp) new services (Uber, Airbnb) and the multi-billion dollar accessories markets. These benefits are largely unmeasured and therefore not visible in accounting systems. They are perceivable however.
Users perceive the value, developers perceive the value and, in the end, the only account that matters, the brand, accrues these perceptions to grow in value.
As the brand flourishes, the perception of vulnerability dissipates and the narrative shifts from Apple getting killed to killing it.
It's taken eight years and 500 million loyal users but, perhaps, just perhaps, this change in perception is entering the collective consciousness.
In the fourth quarter of 2013, mobile phone sales in mature regions fell due to weaker demand."Mature markets face limited growth potentialis the markets are saturated with smartphone sales, leaving little room for growth with declining feature phone market and a longer replacement cycle," said Anshul Gupta, principal research analyst at Gartner. "Lack of compelling hardware innovation has further exacerbated replacement cycles for high-end smartphones in 2013 because consumers don't find enough reasons to upgrade." - Gartner
Anshul Gupta's assertion of market saturation was not the first. IDC also cited "a number of mature markets nearing smartphone saturation" in late 2013.
Shortchanging the smartphone market is nothing new. It was happening very early in the market's formation when initial growth was not as rapid as expected. I recall Nokia managers disappointed with sales growth losing faith in smartphones in 2004. Eleven years later, the market is still growing.
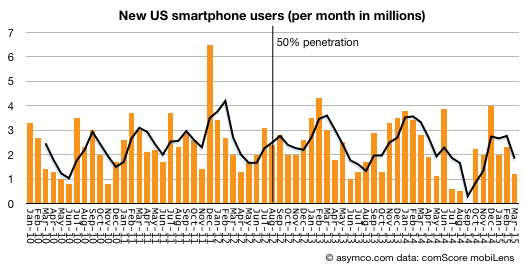
comScore reported that during the first quarter of 2015 the US market was adding over two million new smartphone users every month. These are not two million units sold every month but two million new users who began using smartphones for the first time ever, every month.
Since the end of 2013 when both IDC and Gartner declared the onset of saturation in "mature regions" ((The US is the most mature by penetration data)) 31.5 million new-to-smartphones Americans adopted the product. That's an addition of 11% of the sampled market.
And the sampled market is just a subset of the addressable market. comScore only counts 'primary phones' in use and excludes company-purchased devices and any users below age 13.
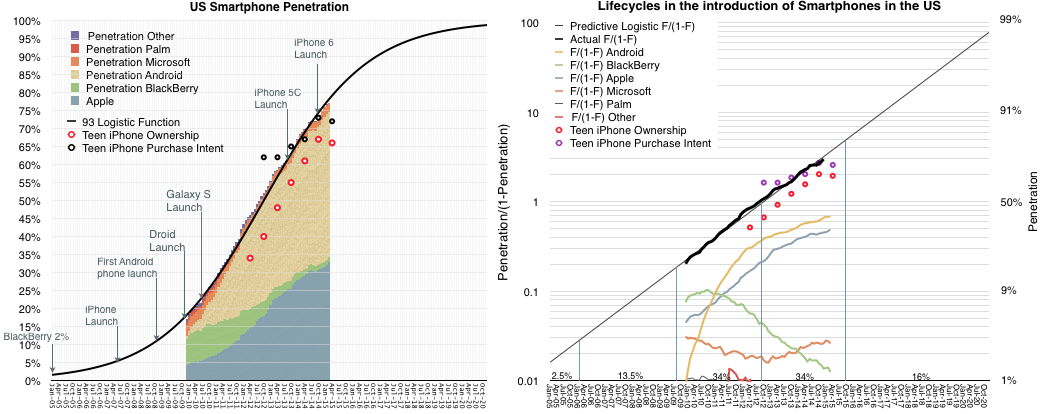
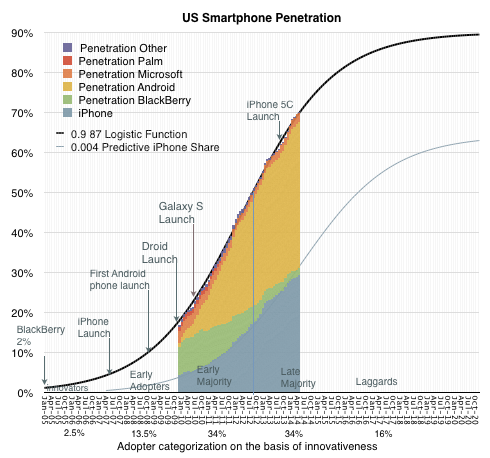
So according to comScore's data, the US market is at 77% smartphone usage. My assumption is that saturation would come at the earliest at 90% and could be 100%. ((Of the market comScore measures)) The fact that conversion to smartphones is still proceeding at roughly the same rate it has been for five years, makes this assumption pretty safe.
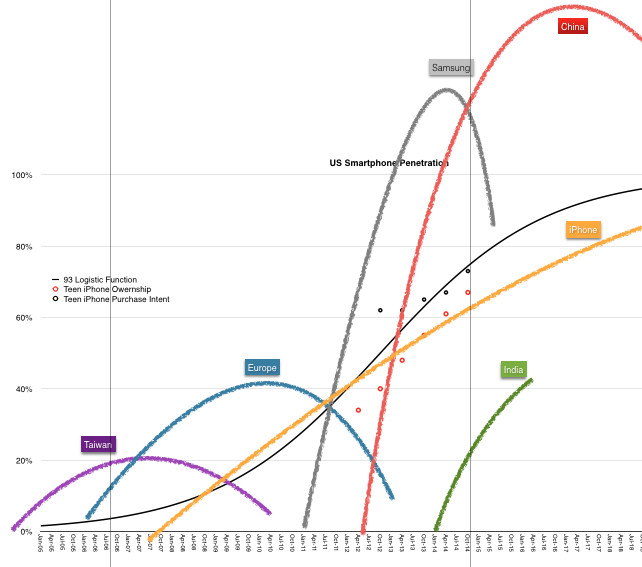
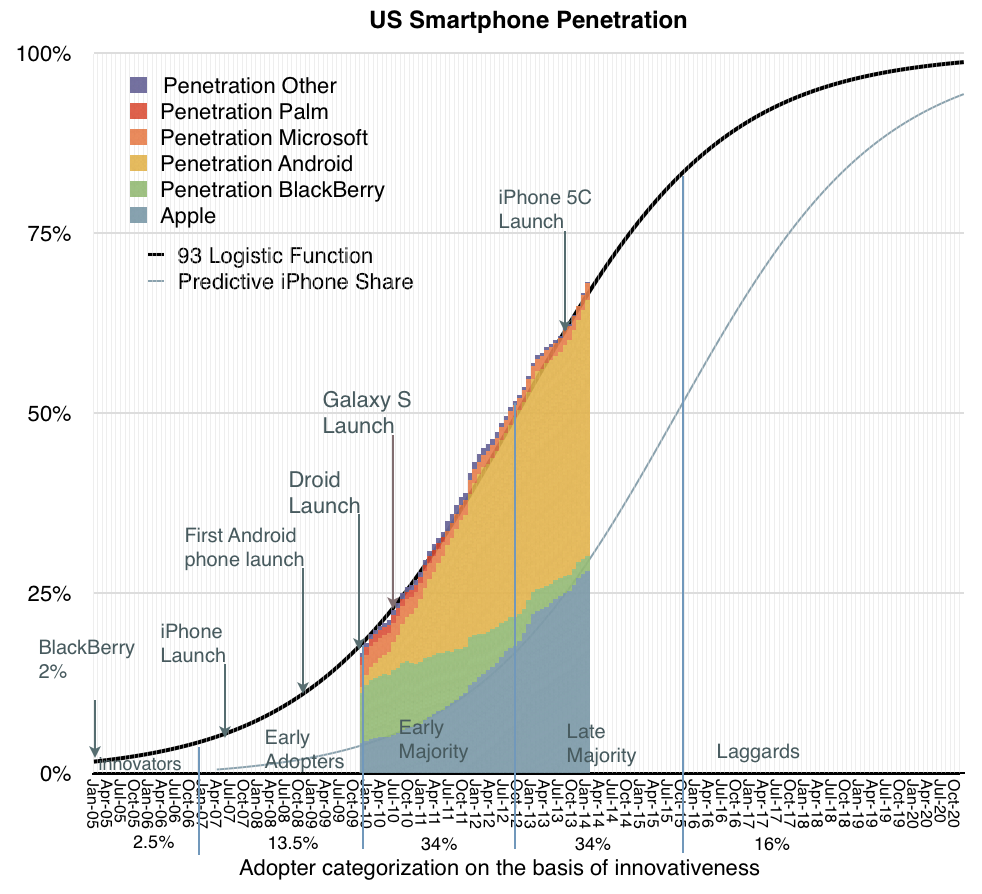
The pattern of growth fits a diffusion S curve (Logistic curve) as closely as ever:
Note that the curve continues to rise even into 2020, and that this is the US only.
The US is the most highly penetrated market but it's not the biggest. That would be China. So it's not surprising that two years after declaring US growth was over, IDC claims "China's smartphone market has reached saturation".
Chinese penetration is far below the US. It was estimated at 43% by the end of 2014. If we assume Chinese users are no less hungry for information than US consumers, then why should Chinese stop adopting the technology at less than half of US levels of use?
That would be risky.
This understanding of the maximum potential of a market — its highest level of user adoption — is crucial for product development. Paying attention to short term sales trends blinds you to the power of the job your product is hired to do. Your product's purpose is not to be sold, but to be hired. If your product is powerful enough, it can be hired for universal jobs and it should be desired by all consumers, not just the fickle.
Being patient for growth means that you can release features when the majority of users can absorb them, not just when early adopters choose to play with them. Often, early adopters offer feedback which is off-putting to later, mainstream adopters. In engineering and design one has to always make compromises. The right balance at the right time avoids overshooting a market or under-performing against competitors.
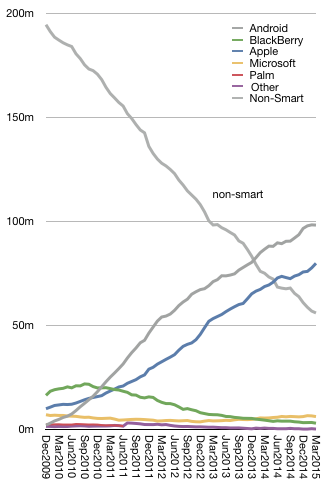
There are plenty of examples of getting it wrong (see the graph on the right above).
At this stage in the US market, the iPhone has more than 80 million (sampled) users. Android has about 100 million. It's still a growing market so apart from BlackBerry, ((Three million BlackBerry users in the US remain.)) the churn between the smartphone platforms is still minimal. The two main platforms are still harvesting non-consumers.
This will change of course. And when it does, the competition will shift from winning against non-consumption to winning against other-consumption or over-consumption. That post-saturation competition will be decided by brand loyalty as much as anything else.
---
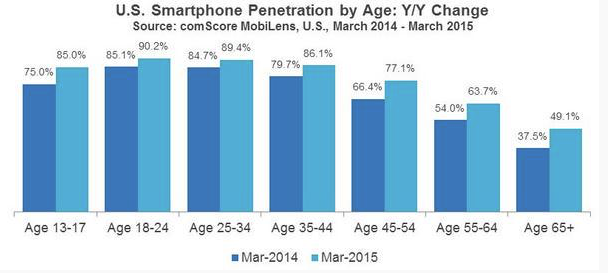
Update: comScore just published US Smartphone penetration by Age which offers some clues where smartphone hiring is still going on. (Note: <13 ages are not shown).
It won't be easy. The company will not be reporting the Watch segment revenues or (presumably) unit sales and therefore we won't have an accurate unadulterated view of the business. In addition, the large number of products in the mix and wide price variance means that it will be difficult for analysts to determine demand and price.
There is a hidden benefit to not having this data. All data is a creation and it tends to lead thinking in directions led by whatever is being measured (and whoever chose those measures and their motives). And yet without data there is no evidence and no credibility. In other words: You can't manage without measurement but you can't be sure what to measure.
The analyst is then faced with a requirement to have good taste or at least judgement about what to measure. This judgement is based on experience and good theory. Given that, what could we measure to determine whether the Apple Watch will be a success?
Here are some suggestions:
Language. Measure whether "Watch" will come to mean "Apple Watch". "Phone" has come to mean not only "smartphone" but also all mobile/cellular phones and not just things used for calling but things used for all manner of information. This is a great test because the theft of semantics can only be accomplished through a degree of ubiquity of influential mindshare. Incidentally, the brand may well have been designed to do just that. ((It leaves open the question as to what watches as currently defined will come to be known as.))
A measurable and significant reduction in the use of the iPhone. The Watch peels off uses from the iPhone and therefore the more it peels off, the less remains. However, that which remains will be more uniquely valuable to the incumbent. This is the process of carving and erosion that the PC experienced vs. mobile devices in general.
An increase in the mix of large-screen iPhones. As iPhones are removed from pockets more rarely, the larger version might be more comfortable to carry and more useful to use for the immersive tasks that are outside the scope of Watch.
An overall increase in iPhone sales beyond the foreseeable trajectory. This would suggest switchers from Android would be drawn to the platform purely for the value of the "accessory". Note that this is not inconsistent with the lower usage and higher spec mix measurements.
Apps uniquely targeting the Watch. It's hard to imagine how this will develop as it involves millions of creative minds, but as smartphones created new economic value through the solving of new jobs to be done, the Watch should do the same. As a side-effect it should lead to new empires (or at least Unicorns) being formed around Watch use.
Iteration. How quickly and deeply will the product be improved? Basic accessories like headphones and Apple TV have a leisurely update cycle. Smarter devices are faster. The cycle time of iteration should indicate how seriously Apple takes the platform and that itself should be fueled by positive consumer sentiment for the product.
These indicators are vague and the data will be weakly signaled but in many ways it will be more meaningful than any financial performance figures.
The adoption curve has been used to categorize adopters into groups by their behavior: innovators, early adopters, early majority, late majority and laggards. This categorization asserts that adoption is function of psychology, or the likelihood of people to act or react within social systems. [Rogers first edition 1962]
It's a compelling model and has been proposed as a tool for firms to help with their marketing strategy. As diffusion proceeds through each adopter category, the product is re-positioned to address each group's presumed behavior. Innovators (first 2.5% of the population) are offered novelty, a chance to experiment and uniqueness of experience; early adopters are offered a chance to create or enhance their position of social leadership; the early majority build imitate the leadership of the early adopters and justify it with productivity gains; the late majority are skeptics but, given a set of specific benefits, join the earlier adopters. Finally the laggards reluctantly agree to adopt as their preferred alternative of not adopting disappears.
The theory suggests that a firm can be successful if they modify their marketing and perhaps product mix to accommodate these adopter categories in a timely manner.
If this is the case however, why is it that those who have access to these data (i.e. who is buying and when) not to do the right thing? Why is it that during a technology adoption curve, there is a high degree of turnover in the firms which capture profits from the products that deliver this technology?
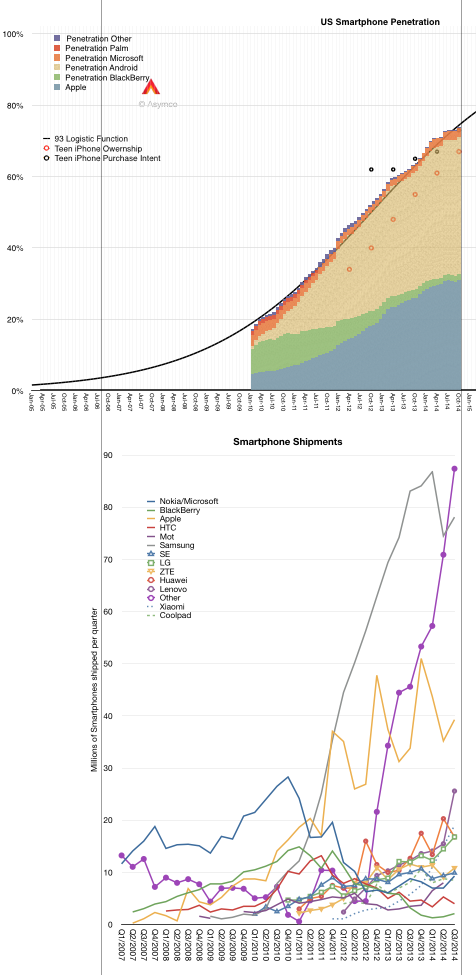
If you don't believe this to be the case, consider the smartphone market. The data about buyers is easily obtained (even without paying a fee). Shown below is the US smartphone penetration data as obtained by comScore (including teenage survey data from Piper Jaffray).
Following the penetration data there is a second graph showing the smartphone shipments for the largest vendors as well as the sum of the "others" which make up the difference with the total market. I used vertical registration lines to align the different data sets to the same time scale.
Having observed the market for some time, it's possible to see a set of "epochs" which show the rise and fall of various platforms/vendors/geographic production areas. I applied these "epochs" as a rough sketch over the production data.
I define these epochs as:
The Windows Mobile epoch from 2003 to about 2010 peaking in 2007. Competitors from Taiwan using Windows Mobile fielded a large number of devices and led that platform to win over proprietary Palm and Symbian.
The Nokia/RIM epoch from 2005 to about 2012 peaking in 2010. Nokia's distribution power takes its platform to global dominance. At the same time BlackBerry surges in popularity peaking at about the same time.
The Samsung epoch from 2010 to (probably) 2016 peaking in 2014. Samsung surges from almost no smartphone volumes to double the nearest competitor in a matter of three years.
The Chinese epoch from 2012 and ongoing. With a vast number of new competitors doubling or tripling sales over a few short years, "Other" becomes once again the bulk of volumes with additional brands like Lenovo, Huawei, ZTE, Xiaomi, Coolpad adding to the total.
The (probable) Indian epoch from 2014. This epoch is not so much of or about India as the "local brands" which begin to have large, even majority, market share in markets such as India, Indonesia, Philippines, Vietnam, etc. This epoch is the triumph of the local over the global and represents the latter stages of adoption.
Now I deliberately left out Apple because, as can be seen in the shipments data, Apple never held a pre-eminent volume position. It is however a competitor with a steady rate of growth. So steady in fact, that it seems to mirror the overall market. Essentially, Apple shows that there is a potential for growth without competitive flux. A type of growth that is "systemic" rather than a function of some rivalry and hence turnover.
But Apple is an exception. As so often it tends to be.
The real puzzle is why are there so many turnovers in leadership in such a short span of time. The idea that five distinct eras can exist in a mere decade seems preposterous. These turnovers are not without economic drama. They are booms as well as busts. They happen in a market where there are literally billions of consumers spending the equivalent of $300 billion/yr. so the stakes are pretty high.
But it's even more strange. If you super-impose the epochs on the (early) diffusion curve you can observe how a predictable adoption curve ((I.e. one whose shape can be determined well in advance and updated with very high precision)) results in unpredictable success in the market.
There must be something about the way companies behave *while* they are watching the evolution of the market. They seem to be running at a cycle time far faster than the market's overall absorption rate. Is this because competition is forcing them to mis-spend their energies?
Could it be that the behavior of firms is also a function of the psychology and reward systems of managers? That they seem compelled to optimize for a time frame shorter than the economic lifespan of the technology? That this mismatch of phase between lifespans of a technology market and their profit model leads to premature demise of their market position?
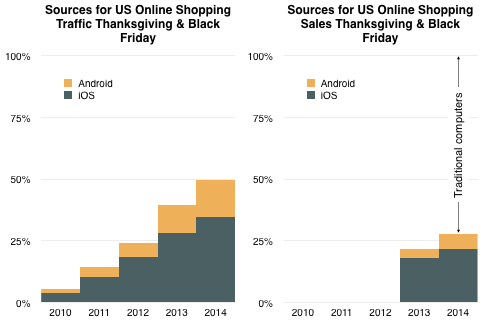
This year's Thanksgiving and Black Friday data from IBM shows a continuing pattern of growth for mobile devices. As the graph below shows, in the five years since 2010 mobile devices grew from 5% of the online shopping traffic to 50%. Traditional computing (desktop and laptop) made up the difference.
The graph also shows that sales value via mobile devices crossed over 25% of online spending. The fact that mobile shopping is not equal to mobile spending is due to the convenience factor of mobile. It's more likely that users will spend idle time scanning for bargains or tracking down ideas from friends but wait until they are at home to make the final purchase decisions in front of a computer.
The transition to spending directly from a device is a slower process, but that process was also one that online had to undertake as buyers became comfortable with online commerce. When it comes to payment, buyers are understandably more cautious.
This does not change the prediction made last year that "the transition to post-PC consumption will also be practically completed by 2020". That leaves six years for mobile saturation and a total transition time of one decade.
At that point I expect 90% of browsing and perhaps 75% of spending to be happening on devices. Some of this will undoubtedly be enabled by biometric authentication as shown by Apple Pay. Trust and ease of use in this technology will undoubtedly accelerate the transition making mobile payments more comfortable and secure than on the legacy computer.
What is less predictable is how much those devices will also be used to transact payments for the physical retail stores. In some scenarios it's possible that by 2020 a majority of all shopping will be enabled by devices. ((There is also the matter of in-store discovery and advertising via NFC and bluetooth i.e. iBeacon)) That would subjugate the retail segment to the power politics of mobile platforms.
It is interesting therefore to note the mix between the platforms in the graphs above.
My hypothesis is that The Primary Cause for the shift of profits from Incumbents to Entrants has been the disruptive impact of a new input method.
It was a description of what I considered to be the "disruptive technology" which caused incumbents which had a "front-row seat" to the future of their industry to be completely displaced and marginalized by an entrant ((later more than one)) with no discernible right to do what they did.
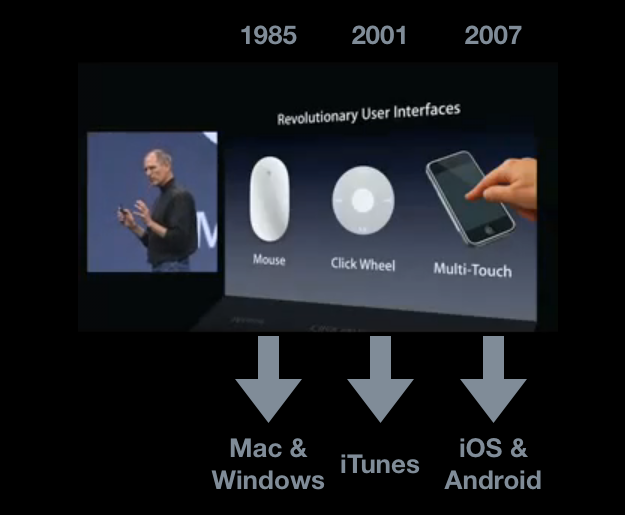
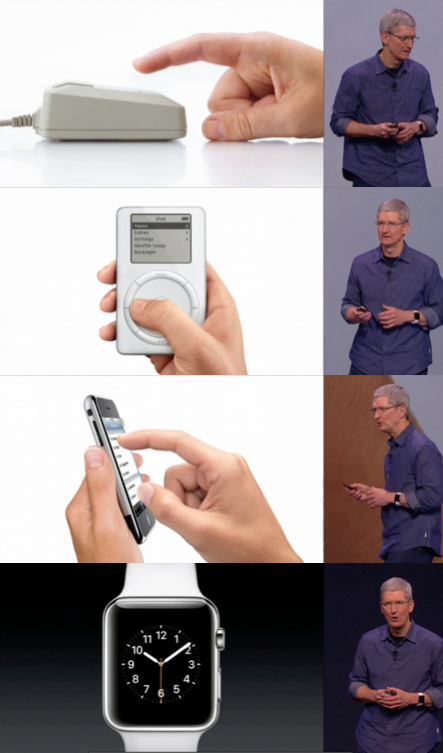
I illustrated what underpinned the sea change in the phone business via the slide that Steve Jobs used in the iPhone launch event:
I added the years when each input method was introduced and the platform/ecosystems created as a result. These new ecosystems were the primary cause for dramatic industry-sized shifts in profits.
Not coincidentally, during the 2014 Apple Watch launch, the presentation began ((Begins one hour into the 2 hour downloadable video)) with a re-telling of the "mouse, click wheel and Multi-Touch" story.
Seven years later, the difference is that there is a new object added to the story. It answers the question that has been on my mind since that first post on revolutionary user interfaces was written: what will come next.
Now that we have an answer, the next step is to understand the new platform, its ecosystem; which industry will be affected and which incumbents will be displaced and to what degree will value be created beyond that which will be displaced.
If software can be injected into an industry's product it will bend to the will of the software writers.
This theory expands on Marc Andreessen's observation that "software is eating the world". The evidence is that software, coupled with microprocessors, sensors, batteries and networking becomes applicable to an increasingly larger set of problems to be solved ((Or, put another way, is eligible to be hired to perform an increasingly large set of jobs)). Software has "eaten" large portions of entertainment (e.g. Pixar, iTunes, video games), telecommunications (iPhone, Android, Messaging), various professions including journalism, management and law, and is entering transportation, energy and health care and poised over banking, finance and government.
As entry happens, asymmetries are enabled and disruption follows. This is the bending to the will of the writers--who tend not to be incumbents. The incumbents can't embrace the changes in business models enabled by software without destroying their core businesses and thus, invariably, they disappear.
The pattern is easily observed but the speed and timing of it is difficult to predict and hence investment success is not certain. ((Which, ironically, means that the jobs of venture capitalists are still safe. At least until the theory develops to the point where it can predict with more accuracy winners and losers.)) There are many entrants who try and few succeed and there are many incumbents who will survive longer than a prophet can stay hungry.
Nevertheless, this process of software-induced turnover in wealth--and, incidentally, vast, additional wealth creation--is inevitable.
But can we predict anything other than timing? For example, can we predict the next industry to succumb to this force?
There is hope because the last big disruption was predictable. When looking at what caused telecom to become a domino, the pattern of development of hardware pointed the way. It was clear in the late 1990s that computers would become small enough to fit in one hand. The first instances were PDAs (mid-1990s) and once they proved valuable in solving many jobs it was easy to plot their evolution into phones.
So if we follow the "packaging" constraint, it's clear that computers are becoming small enough to be worn. Many prototypes exist and even small companies can build them.
All that is needed is a new user interface and a new platform will be born. Once a platform is born, the creativity of millions can be unleashed to expand the problem set that can be solved. The process then repeats.
So it's obvious that as a computer becomes wearable it will affect the industry that currently is hired to also be worn: apparel.
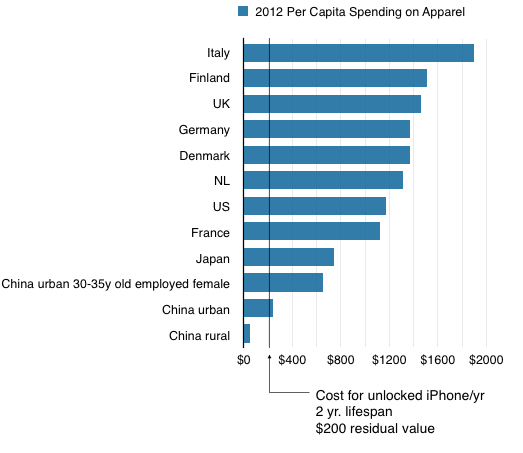
Apparel is the word describing every garment, shoe and accessory product sold and amounts to about $1.2 trillion/yr. ((The US is about $331 billion or 28%.)) ((The Telecom industry is slightly larger at about $1.3 trillion)) This amount of money is not spent only to protect the wearer from the elements--any more than the money spent on telecommunications is spent to convey vital information. Most of the value in apparel, perhaps 80%, is spent on solving psychological needs.
And therein lies the opportunity. As the value is beyond functional, substitution of psychological jobs by new products is a matter of engineering better solutions. Consider the behavior of US teens: anecdotally, their spending on apparel is fading as the solution to feeling good about themselves increasingly relies on a device and service. Already, in this context, apparel retail is in crisis while buying shifts to devices.
While looking at the spending, it's also easy to see how much there is to divert from a non-functional to a functional/service bundle:
In many markets individuals spend more on apparel than on personal technology. And as personal technology increasingly competes for the same jobs to be done, that spending will transfer to the entrants.
To know who's already planning for this you can follow the trade news on the hiring of talent.
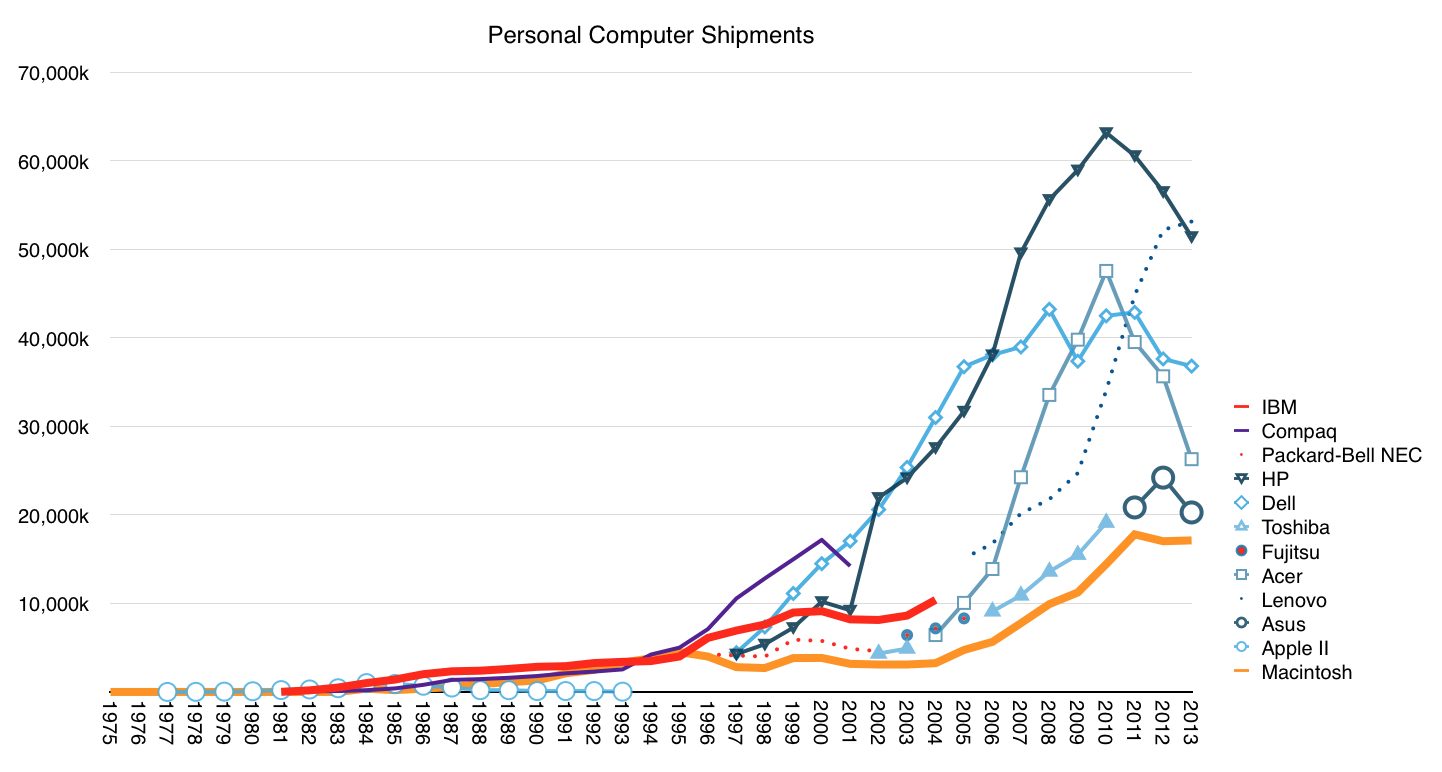
IBM did not invent personal computing but their "PC" became synonymous with the category. Having entered the market in 1981, the IBM PC quickly became the top selling brand. From 1984 to 1993 IBM sold more PCs than any other vendor, conceding the spot to Compaq which remained on top only until 2000. No PC vendor remained at the top of the sales leagues longer than IBM. HP had the second longest run but that run was broken last year as Lenovo (who acquired IBM's PC business) surged.
As the graph above shows, the period of time when IBM was dominant was characterized by far lower volumes. In 2004, the year IBM exited, they sold about 10 million units. ((as the graph shows, if we consider Lenovo as taking over from there, they did a very good job extending the legacy.)) It was a decent performance but one that did not keep up with the Dell and HP/Compaq race to the bottom in pricing and subsequent rise in volumes.
However, throughout its position of strength, IBM was a reluctant PC maker. IBM never controlled the PC platform the way they had controlled their mainframe and mini-computer businesses. Their falling out with Microsoft over OS/2 and their attempts at differentiating with the PS/2 architecture show how uncomfortable the situation was. Their exit in 2004 must have come as a relief and, in retrospect, they should be congratulated for having exited the market well before it began deteriorating. First came pricing and margin collapse and later total volumes began to decline. Most of the remaining vendors are today in various states of distress. Lenovo is growing but incumbents like Dell, HP and entrants have come and gone (Fujitsu, Sony, NEC, Toshiba). Potential disruptors like Asus and Acer have found no long-term success with PCs.
This is because without control over the platform, PC hardware is nothing more than a commodity, with negligible margins, intense competition and an inability to control one's destiny.
One company making computers did manage to control its destiny. By continuous refinement, the Macintosh survived and even thrived as the market pivoted toward mobility (and hence requiring integration that values design). Indeed, Apple now ships over 17 million Macs a year. More than either IBM or Compaq did at their peaks. It's not in the top five globally but has a very profitable niche. ((It's very likely that it captures more operating profit than the top five vendors combined.))
As a matter of fact, through 2013 Apple shipped a total of 156.5 million Macs, 50% more than all IBM PCs ever shipped. Apple also shipped more than twice as many iPads and five times more iPhones. And it's not just popular with consumers. With iOS Apple manages to reach 98% of Fortune 500 companies and 92% of Global 500.
At the same time, even though IBM exited the hardware business, it remained a powerful force in computing. IBM pivoted to primarily being a service company with a vast client base and increasing global reach. It essentially moved up the value chain to become an integrated services provider to business customers. IBM's reach in breadth and depth of services is extraordinary.
This dramatic turnaround–Apple moving to a device leadership position and IBM moving to a service leadership position–created the conditions for today's announcement of a strategic partnership--an event which is astounding to those who witnessed the 1980s and 1990s. Were it not for the tenacious independence of Apple and the business model agility of IBM, neither company would be around today to leverage one another.
There is drama in this industry and this latest chapter has a plot twist which any poet would envy.
Seven years after the iPhone was launched, 70% of the US population is using smartphones. Smartphones existed before the iPhone so the category is older than seven years but as far as adoption goes this is nearly the fastest ever.
The CD Player reached 55% in seven years and the Boom Box about 62%. If measuring the period between 9% penetration and 90% ((which I consider the "economically attractive" period of growth)) the smartphone in the US will have a lifespan of about 9 years starting in 2008. Before this period, the product was largely experimental and participating vendors ((Palm, BlackBerry, Nokia)) mostly failed. After this period most products will be "commoditized" with decreasing margins and increasing consolidation.
The rapidity of growth is all the more remarkable given the penetration is at the individual, not household level. The total user base is therefore over 270 million rather than the 115 million usually targeted by consumer technology, nearly 60% more purchases. This is also remarkable because the product has a shorter lifespan of use (two years) than is typical for other consumer technology products ((e.g. TVs, Refrigerators, Radios, etc.))
We are therefore now in the "Late Majority" phase of the US market. This is not a surprise. The inflection point in the market occurred in mid 2012 so we've been in this phase for two years already. It's not therefore controversial to predict two years of continuing though decelerating growth.
As Geoffrey Moore explained, the marketing of technology products needs to be varied as we get into different phases of the market. Innovators (first 2.5%) need to be sold on the premise of novelty itself. Early adopters (next 13.5%) seek status and exclusivity. Early majority (34%) seek acceptance and Late Majority (34%) seek pragmatic productivity. Laggards (last 16%) seek safety.
One aspect of this adoption cycle that is misunderstood is the role of pricing. The assumption is that pricing matters more as adoption increases. This is misunderstood because pricing always matters and therefore it never matters. Pricing is one of many elements of marketing mix and at any time there are product choices across a wide spectrum of pricing. Pricing is also a signal which can be elaborately obfuscated through bundling and unbundling.
One way to illustrate this is to consider how Apple products behave in the late phases of markets. Apple products have notoriously firm pricing.
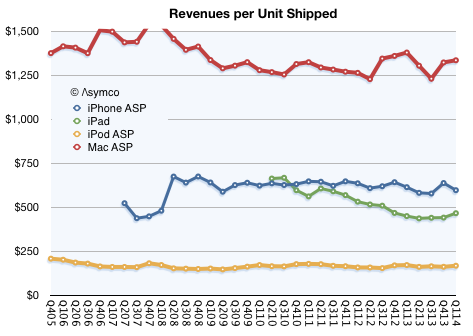
The revenue per unit of Macs, iPods, iPhones and iPads remains stubbornly consistent. This is not to say that each unit sold is the same price. The company tweaks "the mix" of mid, low and high products to keep the average selling price constant. But fundamentally the average remains constant which means that regardless of market phase, Apple retains its margins.
So as we look forward to the last two years of growth for smartphones, how will Apple fare?
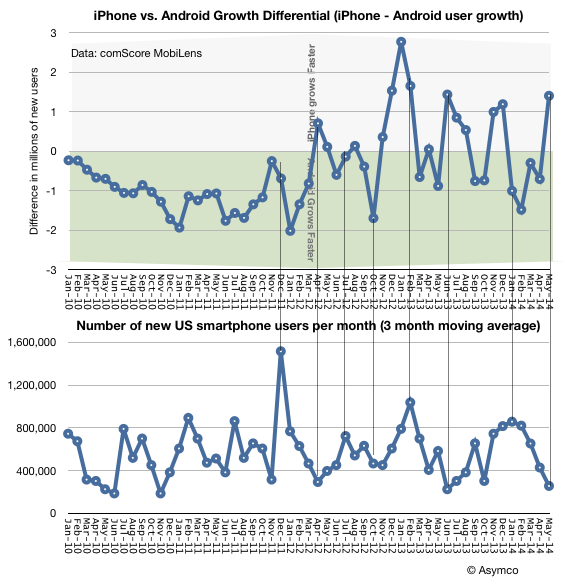
There are weak signals that it will do rather well. I looked at two sets of data for clues: the number of new-to-smartphone users being added each month relative to the increase of usage of either iPhone or Android.
[Edit: The title of the second graph above should be "Number of new US smartphone users per week (3 month moving average)"]
What I'm looking for is a relationship between the rate of adoption of the overall product and the rate of adoption of iPhones. I measured the new-to-smartphone users as the change in user population (per week) and the preference for iPhone as a growth differential. ((iPhone growth in millions of users minus Android growth in millions of users. Positive data points suggest iPhone grew faster in a period and negative points suggest Android grew faster.)) The data shows no perceptible correlation between adoption rate and preference for either platform, however when looking closer there is a periodicity to the addition of users, especially starting in 2012.
The range is not insignificant, ranging from ~300k users/week to well over 1 million. The periods of growth of users could be due to new product launches or incentives and promotions done by the mobile operators. Whatever the reason, there is some flux.
If we look at the corresponding adoption differential in platforms the relationship seems to be that peaks in adoption are matched to Android preference and troughs to iPhone preference. This might seem logical: after the 50% saturation point, when promotions are run by operators, non-consumers are drawn in and they tend to adopt the "low-cost" product.
However, this is also paradoxical. Why, when we are in a late stage of the market, does the iPhone do well when users are not incentivized to adopt? The graph above shows that as we crossed 70% adoption, 1.4 million more users adopted the iPhone than Android.
Even if we look out to the last six months, iPhone added 15.5 million late majority users while Android added 14.2 million. If promotions decrease for the "late late majority" and laggards then would the iPhone do even better relative to Android?
The only answer seems to be that "low cost" is not what's driving this market. But then again, it never did. Towards the end of the "pre-smartphone" market the most wildly popular voice phone in the US was the RAZR. And it was a premium product.
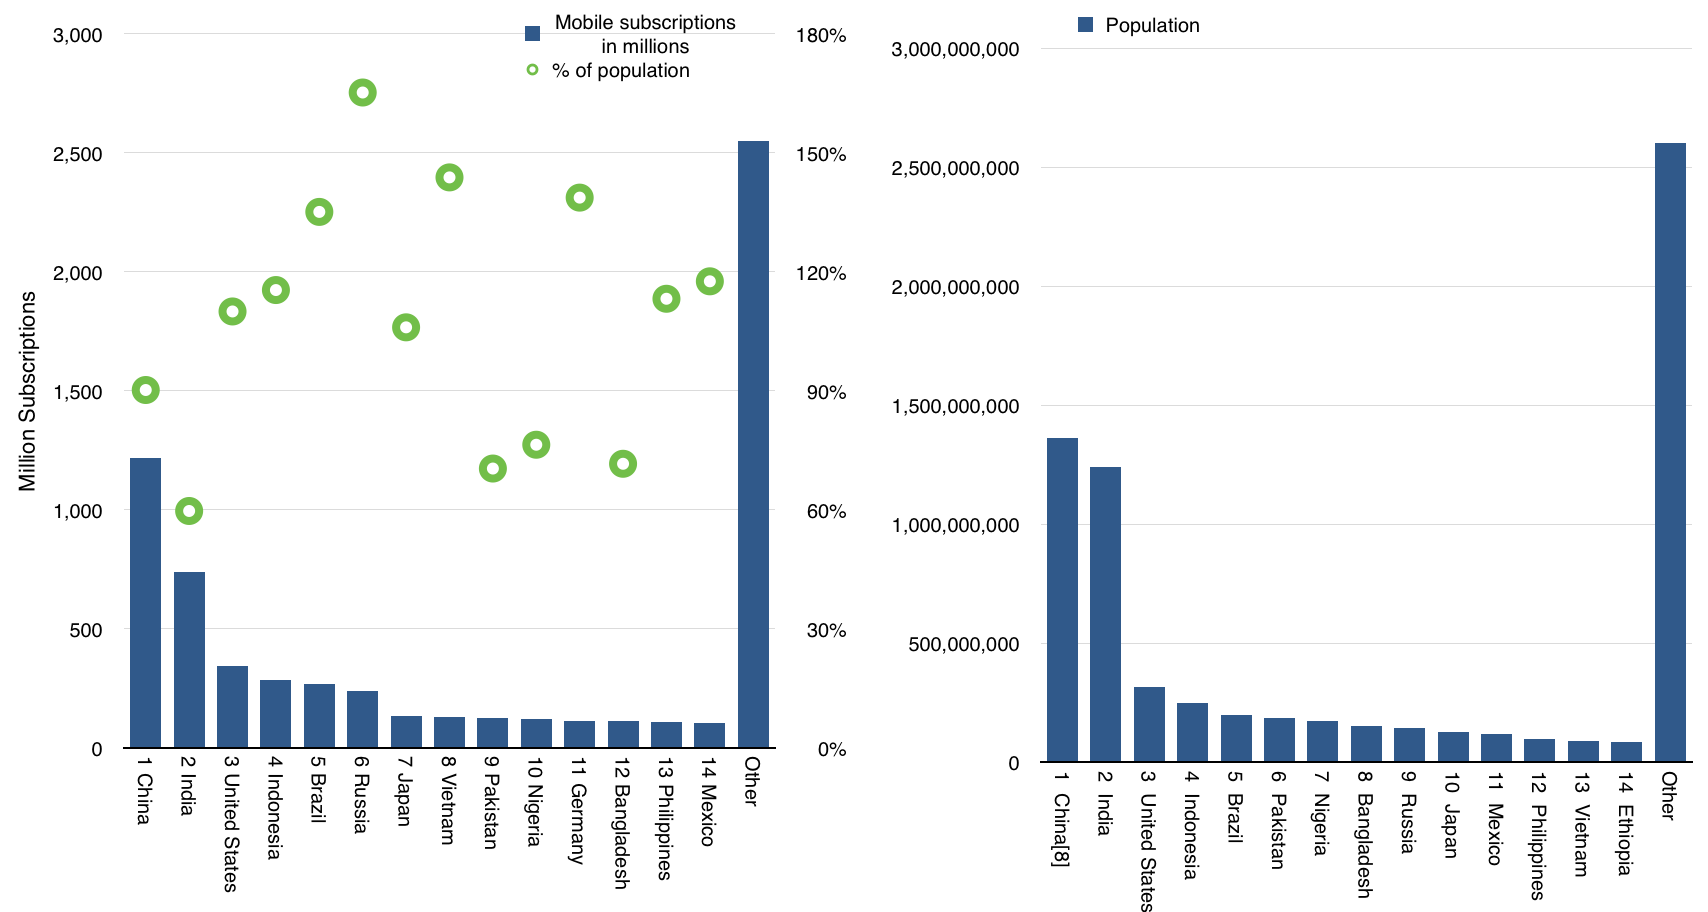
There are 7.1 billion people on Earth. Coincidentally there are also 7 billion mobile connections. Those connections are held by 3.45 billion unique mobile subscribers. ((GSMA)) Unsurprisingly, the largest national mobile markets (by number of subscriptions) correspond closely to the most populous nations.
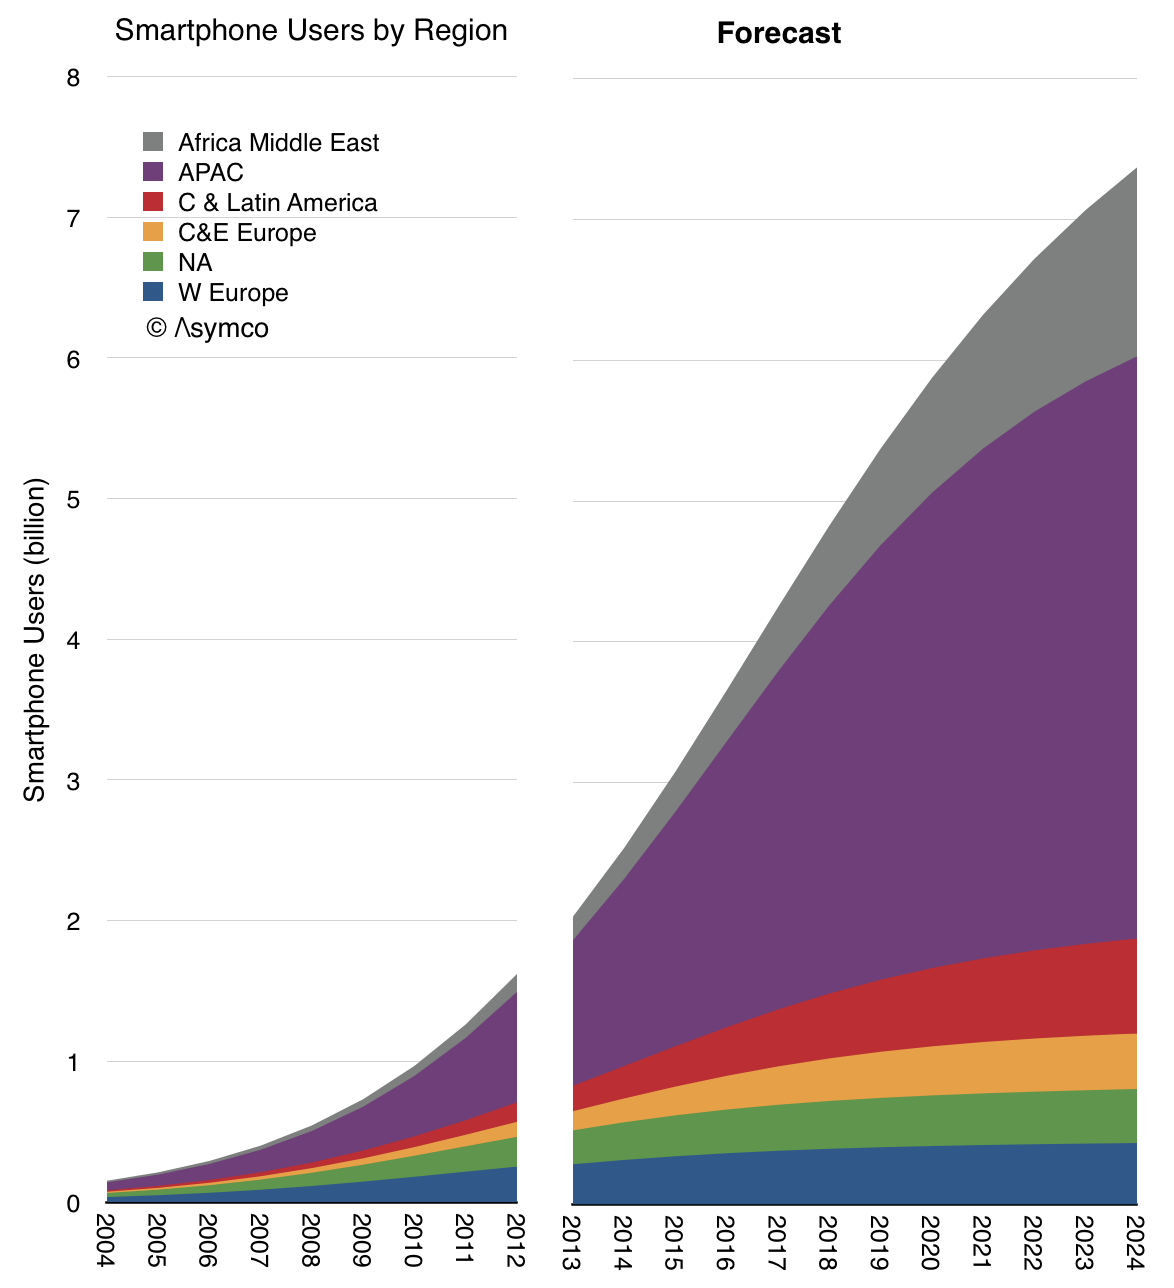
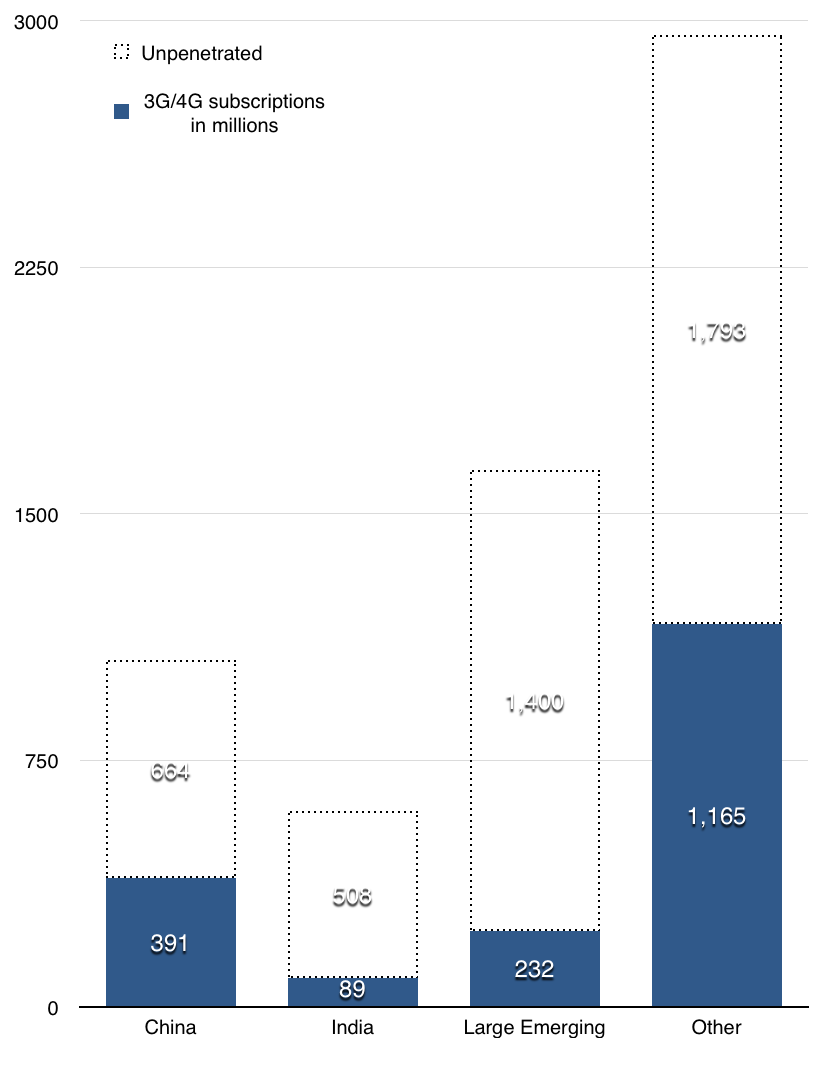
Considering smartphones, last year 1 billion smartphones were sold and the number of smartphones in use is about 2 billion ((There are also about 2 billion 3G/4G connections world-wide))
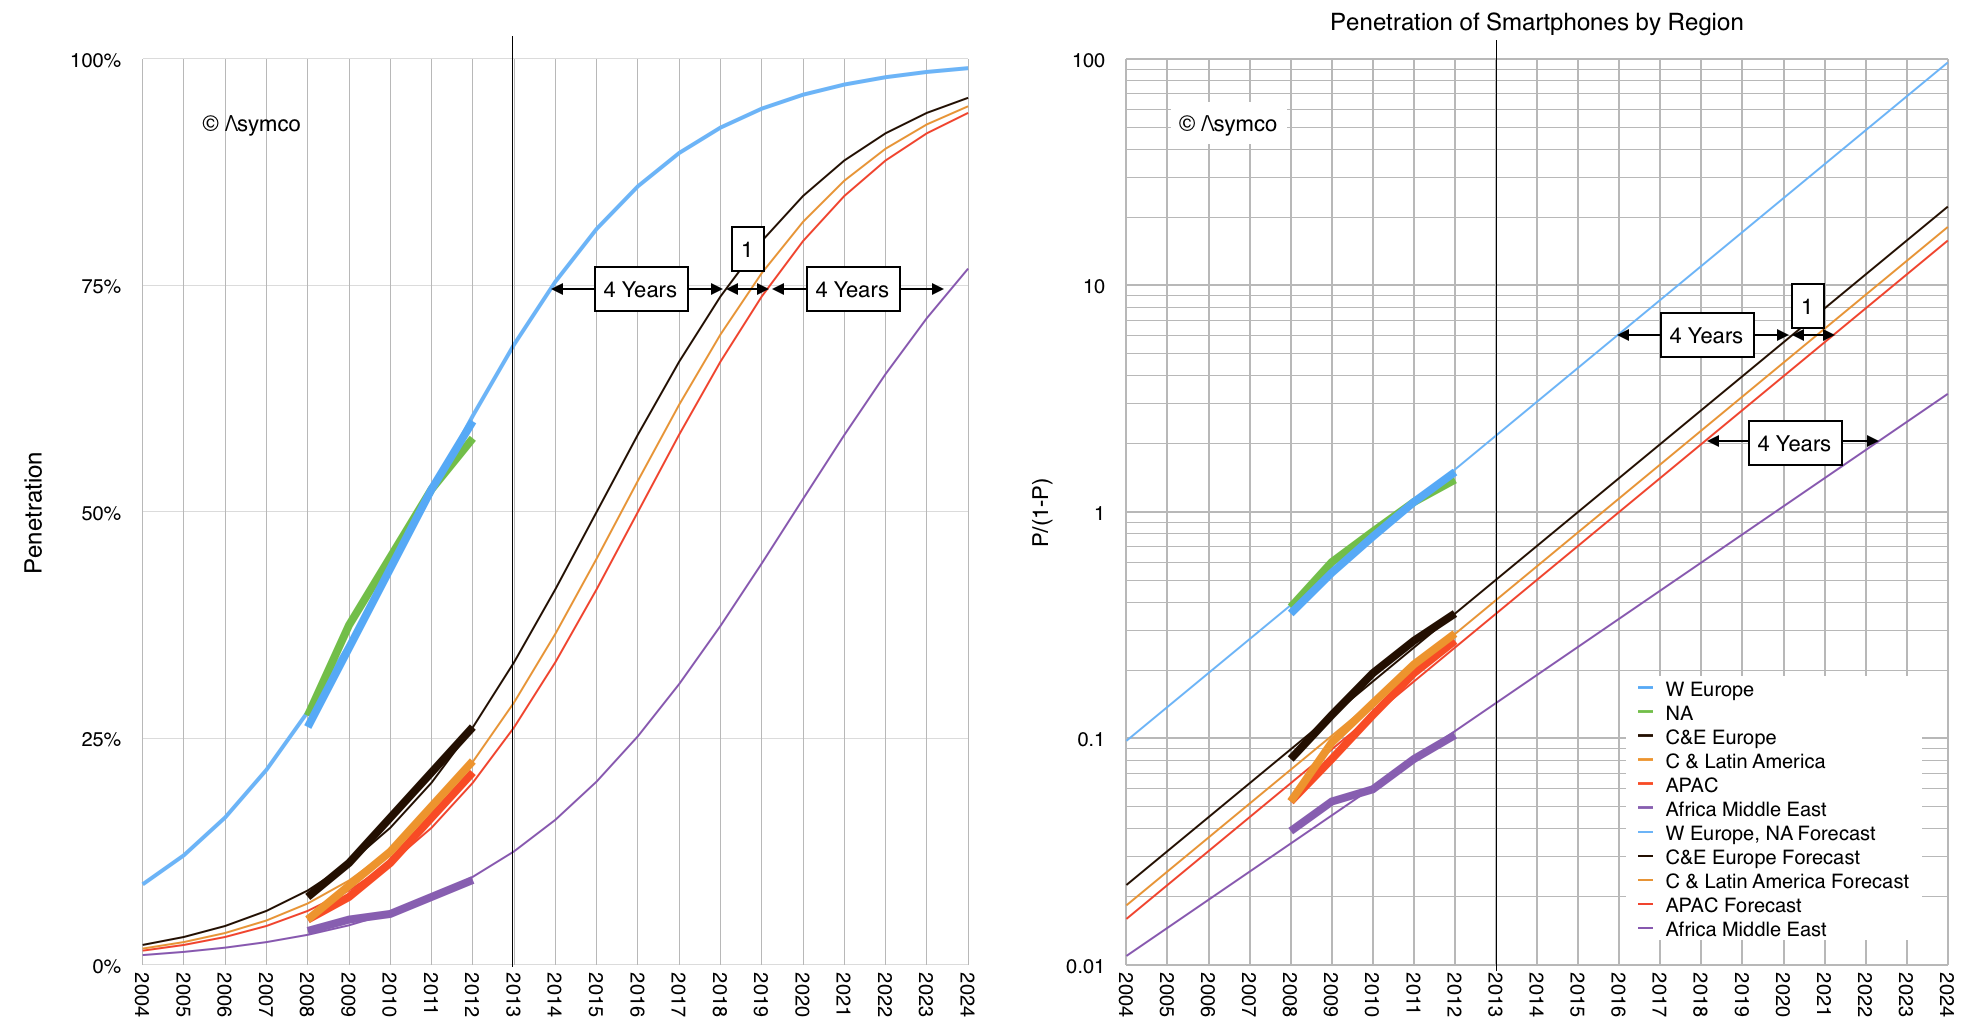
Given the rapid adoption of smartphones, it's also safe to assume that smartphone penetration will follow population distribution. In the US, where comScore data is published monthly, penetration is following a predictable logistic curve.
Assuming similar patterns world-wide we can forecast regional smartphone penetration.
This yields the following forecast for smartphone usage world-wide.
Three years ago the notion of smartphones becoming as ubiquitous as toothbrushes seemed far fetched but it's now gradually being accepted. The smartphone is well on its way to becoming the most successful technology in history.
So what?
What will the smartphone do for us? Does smartphone ubiquity change anything? Besides increasing ARPU slightly in a $1.2 trillion industry? Besides doubling the size of the device business? ((
))
Besides creating a $20 billion app industry? How do we assess the impact of having a connected computer in one's pocket? In everyone's pockets? With us all day. Every day.
Before we answer, we have to realize that the smartphone has been disruptive. Which means it has that special quality of not affecting the world in a predictable way. Its growth has been largely unforeseen and has affected the fortunes of the incumbents. As big and ubiquitous as it has become, the companies which were most intimately aware of it, its very own creators, were cursed by it.
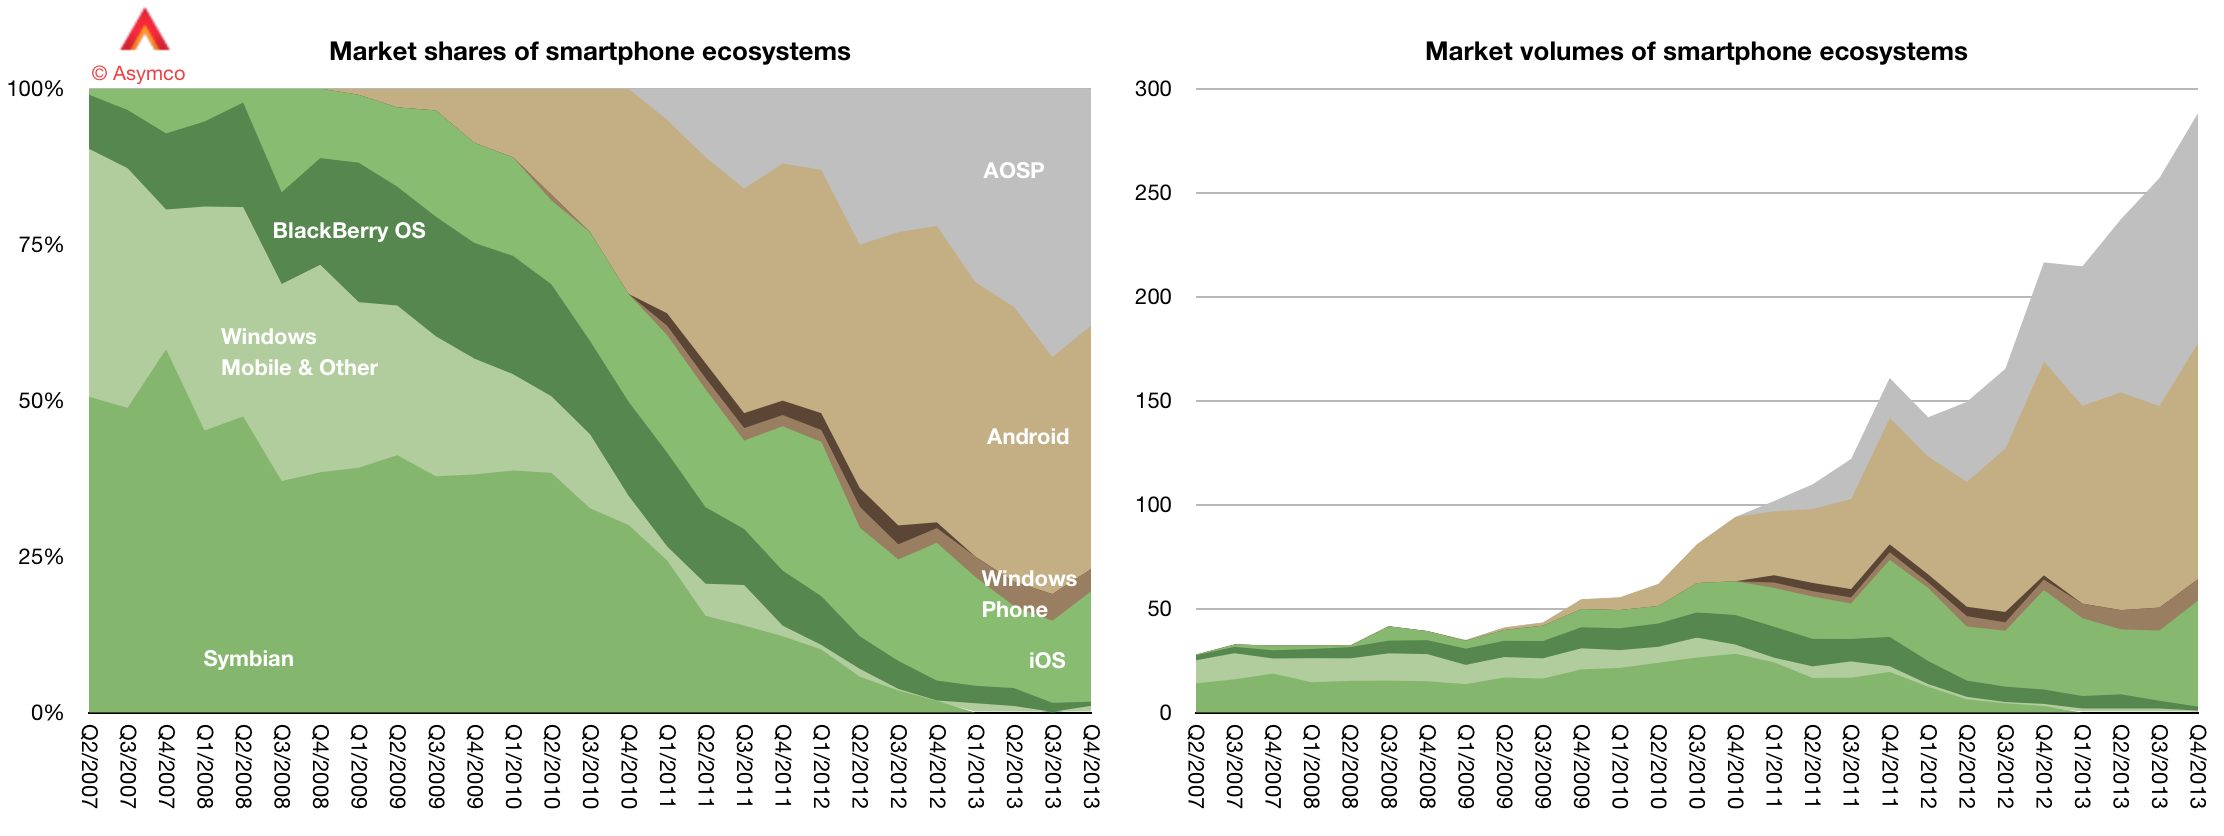
The evidence is in this graph:
As the market exploded, the incumbent platforms all but disappeared. The innovators fell into the trap of treating the complex new product as a niche whose appeal was for selected "segments" described by the coarse data they were able to gather. Ubiquity itself was asymmetric to the basis of competition they established.
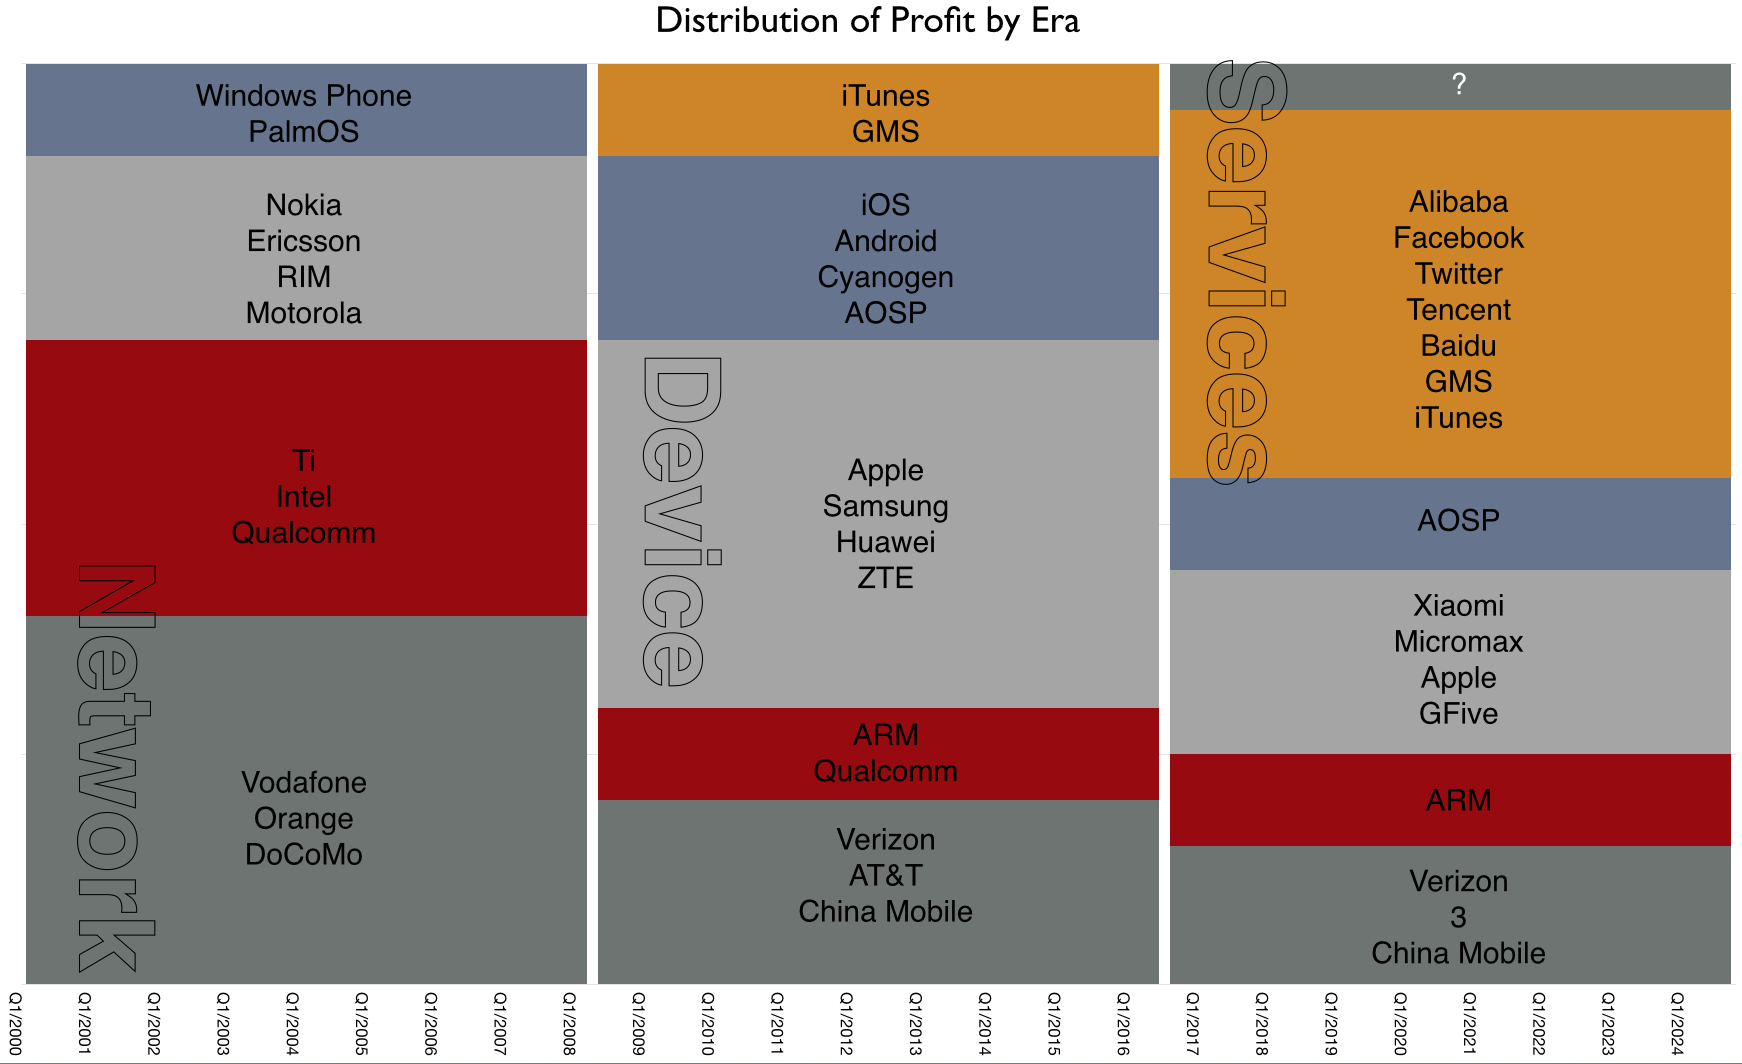
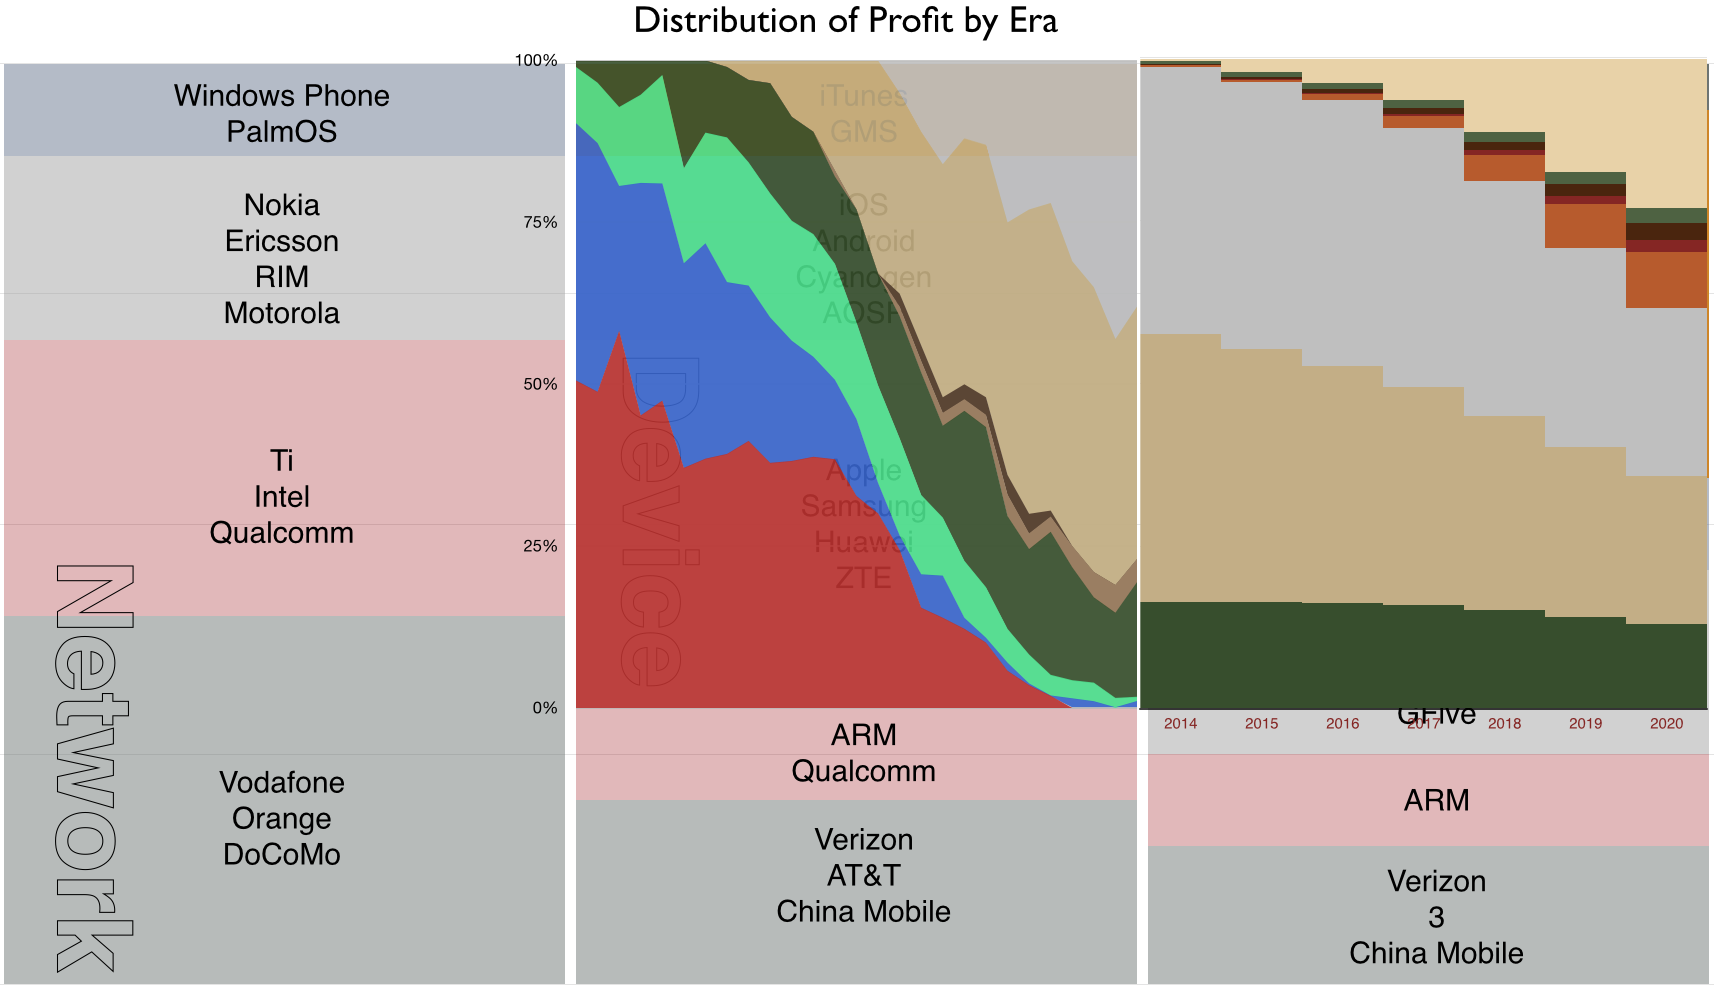
Today we can note how even the usurpers iOS and GMS Android are being swamped by the more modular alternative AOSP. Indeed, if we squint a bit we might notice that the OS/platform churn we see is part of a trend where the value is migrating up the stack from Components and Networks, through Devices and Operating Systems and on to Services and Experiences.
I call these the three mobile eras: (Firm names used are representative of a cohort and are not a complete list of participants.)
The thesis is based on Value Chain Evolution Theory which states that disruptions cause profits to evaporate from commoditized segments and condense in adjacent spaces, usually toward more modular, more convenient or lower cost innovations.
Note that the eras have specific time spans. If the pattern holds then we can overlay the time frame of smartphone penetration on these eras and even plot ecosystem entrants.
Disruption suggests that we are likely to see yet more shifting of fortunes. It means enabling new ecosystems to take advantage of the modularization of platforms. But how can it happen given the entrenched nature of the incumbent duopolists?
The clue lies in the first graph in this post: It suggests a geographic segmentation. The largest markets are large enough to sustain independent ecosystems. Note that China and Russia have already established alternative local service ecosystems. We may dismiss the possibility of localized Google and Facebooks in emerging markets but China and India are universes in and of themselves. But there are another 10 markets of more than 100 million users. That's another billion users among them.
But it's not just the availability of a vast pool of new users. The rapidity of growth of services like WhatsApp and SnapChat and Tencent shows that barriers to entry are low. We see increasing indigenous innovation in payments, logistics and business models in the newest markets. We see no shortage of talent and capital to start these businesses. We see increasing language and culture clustering in social media. We see political resistance to hegemony.
Focusing on the established, highly penetrated markets as an indicator of opportunity would be a mistake. Those markets foretell the rate of adoption but not the evolution of the value chain. Apple and Google will continue to anchor in those markets but there is no reason for the remaining two thirds of the world to follow. Indeed, there are incentives not to.
Incentives exist to localize services. Indeed, service businesses have always been local businesses. There are few global service brands. This has been true in retail, transportation, banking, hospitality, media and communications. Why should we believe that ecosystems can overcome the advantages of localization? Services are local because they are delivered by individuals and have high "touch" with the user.
Fundamentally, ecosystems are social systems and social systems have cultural and political dependencies. ((Post-modernism is a typological world view which sees truth as socially constructed and a rejection of 'totality')) Technology does not homogenize unless it is centrally controlled. The control of mobile computing has already been abdicated by its creators.